AWS Partner Network (APN) Blog
Tracing Amazon FreeRTOS on NXP LPC54018
 |
 |
 |
Editor’s note: This is the first of a two-part series on the APN Blog. Read Part 2 >>
By Johan Kraft, CEO at Percepio AB
At the last Embedded World, NXP showed a cool Smart Home demo using the new NXP OM40007 Internet of Things (IoT) kit, featuring a powerful LPC54018 microcontroller and an integrated Qualcomm Wifi module, all powered by Amazon FreeRTOS.
The tiny-but-powerful board connected to AWS IoT Core, and NXP also included an Amazon Echo device providing Alexa voice control. For instance, you could ask “Alexa, what is the current temperature?” and she tells you the latest temperature reading from the NXP OM40007 board.
As an embedded software guy used to C programming close to the hardware, the concept of Alexa voice control of a microcontroller really impressed me.
Since Percepio AB, an AWS Partner Network (APN) Standard Technology Partner, specializes in trace visualization tools for embedded software developers, I was eager to learn more and see how this demo would look in our Tracealyzer tool. The nice people at NXP gave me a hardware kit, a pointer to the demo source code on Github, and provided excellent technical support.
Goals for This Post
In this post, the first in an APN Blog series about Amazon FreeRTOS development for AWS IoT Core, we will go through the setup required for running the Amazon FreeRTOS application, how it works on a high level, and how to connect it to AWS IoT Core.
We will also present Percepio Tracealyzer, a tool for debugging the real-time behavior of Amazon FreeRTOS applications, together with a real-world example where Tracealyzer was used to analyze a connectivity issue I encountered when getting started with this project.
We assume the reader to have some knowledge of embedded software development but no prior experience with AWS IoT Core. This post relies heavily on the excellent getting started guides provided by NXP and Amazon Web Services (AWS), but also highlights some encountered issues.

Figure 1 – The NXP OM40007 IoT kit, with an Amazon Echo Dot device.
What is Tracealyzer?
Percepio Tracealyzer allows you to look inside your Amazon FreeRTOS software at runtime. It’s a complement to a traditional debugger that provides better means for debugging, validation, and profiling of multi-threaded embedded software, like Amazon FreeRTOS, and without stopping the execution. This is all implemented in software using code instrumentation, so no special tracing hardware is required to use Tracealyzer.
Our secret sauce is the advanced visualization, offering more than 30 views of the runtime behavior, showing the execution of tasks, interrupt handlers, API calls, and custom logging calls added in the code.

Figure 2 – Percepio Tracealyzer
The recorded data can be shown from several different perspectives and abstraction levels, which makes it easier to overview the data, spot anomalies, and drill down to find the cause. Since version 4.0, Tracealyzer even features live visualization so you can view the behavior in real time, as illustrated by the video found later in this article.
Tracealyzer is a commercial tool provided by Percepio AB, and we have collaborated with the original FreeRTOS author Richard Barry since 2012. Today, Tracealyzer supports Amazon FreeRTOS, Linux, and several other real-time operating systems.
Building the Demo Application in MCUXpresso IDE
The demo application described in this post has been developed by NXP’s partner BlueWind and is available on BlueWind’s Github repository. This is an MCUXpresso IDE project with full source code. If you are not familiar with git, just select “Clone or Download” > “Download ZIP.”
The basic setup is described in NXP’s getting started guide for the OM40007 kit. This describes both the target-side setup and the basics of the AWS IoT setup.
You need to import the right Software Development Kit (SDK) for the board into MCUExpresso IDE. This can be downloaded in step 1.2 of the NXP guide. Then, in MCUXpresso IDE, find the “Installed SDKs” panel (usually in the bottom tabs) and drag and drop the SDK zip file to this panel.
Once the SDK is installed, the project should now build. However, for the Wifi and AWS IoT connection to work, you also need to update the MCUXpresso project with AWS and Wifi security credentials, as described below.
Connecting to AWS IoT Core
When getting started with AWS, make sure you create an AWS Identity and Access Management (IAM) user account and use that for your development, rather than the administrator account. This is described by section 2.2 of the NXP guide.
Then, follow the first six steps of Getting Started with AWS IoT in the AWS IoT Developer Guide. In the first step, you will notice this guide uses another device as an example (the AWS IoT Button) but the basic setup is identical.
In the second step, “Register a Device in the Registry,” follow the manual approach and name the device “myShadowThing” or similar. When you come to step 7, “Configure your Device,” the AWS guide gets specific for the AWS IoT Button used as an example. Instead, open the demo project in MCUXpresso IDE.
To configure your NXP OM40007 device to connect, first to your Wifi network and then to your AWS account, you need to update two header files found in the MCUXpresso project under amazon-freertos/include:
- aws_clientcredentials.h
- aws_clientcredentials_keys.h
Setting up aws_clientcredentials.h is pretty straightforward. You need to specify the Wifi credentials, the Thing name (e.g. “myShadowThing”), and the MQTT Broker Endpoint as seen in Figure 3. The Broker Endpoint can be found in the AWS IoT Console under AWS IoT/Manage/<your thing>/Interact.

Figure 3 – Setting up aws_clientcredentials.h
As for aws_clientcredentials_keys.h, I strongly recommend using the “CertificateConfigurator” tool to generate this file, rather than manually modifying the template file. This tool is an html document, found in the BlueWind demo project at NXP/doc/amazon-freertos/devmode_key_provisioning or in the Amazon FreeRTOS Github repository.
Open CertificateConfigurator.html in your web browser, select your certificate file and the private key file, and the tool will generate a new aws_clientcredentials_keys.h. Overwrite your existing template file with this one.
Hard-coding the keys in the source code is convenient when getting started with Amazon FreeRTOS, but in production devices you should use suitable hardware facilities to store the keys in a secure manner.

Figure 4 – Use CertificateConfigurator.html to generate aws_clientcredentials_keys.h
Skipping the Serial Terminal
Before we run the demo application, I like to mention an issue that caused me some trouble. The demo application includes a serial terminal shell, provided via a virtual COM port over USB (VCOM). This is used for configuring the Wifi credentials, so you don’t need to hard-code this in the source code. This also allows for diagnostic printouts from the application. You connect using a terminal program, like PuTTY.
The VCOM interface depends on the software USB stack on the LPC54018, and the serial connection died whenever the board halted (when debugging in MCUXpresso, for example). This could have been an acceptable limitation, but in my case I could not get the VCOM serial connection to work reliably at all, probably due to some host-side driver issue.
NXP recommended a particular driver that might have worked better, but it wasn’t compatible with my operating system (Windows 10). So I decided to skip the serial terminal and find other solutions instead.
The BlueWind demo application assumed the Wifi settings had been stored to flash using the serial terminal, which I was unable to do. I had to modify the demo application. I found the relevant code in a function called vFlashReadWifiSetup, which is called from main.c. This function overrides the hard-coded settings in aws_clientcredentials.h, even if no Wifi settings had been saved to flash.
The solution was simply to comment out this call, so the aws_clientcredentials.h settings are used instead. However, in production devices you should use suitable hardware facilities to store the keys in a secure manner.
But what about the diagnostic printouts? There is a lot of “printf” style logging in the project and in the Amazon FreeRTOS stacks, but since Tracealyzer is able to show custom logging in real-time I could just as well reroute the printouts to Tracealyzer and get the printouts together with all of the other information in the trace.
With these changes, I no longer needed the serial terminal. Thus, there was no need to start the shell task, so I changed the state machine in the main task (main.c) to skip the eMain_StartShell state and instead jump directly to eMain_Wifi_Connect.
Running the Demo Application
Next, build the MCUXpresso project, make sure there are no errors or warnings, and run it. To see the activity when AWS IoT Core receives the temperature readings, select “myShadowThing” (or whatever you called the Thing) on the main AWS IoT Core page, select Manage, and then open the “Shadow” or “Activity” page.
The shadow page shows the current values, and the activity page shows a log of recent updates. Note that it takes some time for the connection to establish; about 20 seconds in my case.

Figure 5 – Device Shadow page in AWS IoT Core.
To see some more action, you can easily set the demo application to provide more frequent updates. The default is every 5 minutes, which is a bit slow for experimentation, so I reduced it to every 5 seconds. The relevant code is found in led_control.c, in prvShadowMainTask around line 430.
There, you will notice a call to xQueueReceive, where the last parameter is the timeout. This is the maximum time the task waits for input (a queue message), after which it times out and updates the temperature value in AWS IoT Core.
How it Works
AWS IoT Core uses a concept of device shadows to represent the data of your device in the AWS Cloud, both the structure and the latest reported values. This is expressed in JSON format, as shown in the “Shadow state” in Figure 5.
Your IoT device typically publishes data by updating the AWS device shadow, and other AWS services may then subscribe to the updates, as part of a larger application. In the MCUXpresso project, you find the relevant code that updates the shadow in source/led_control.c. The shadow API and documentation is found in amazon-freertos/include/aws-shadow.h.

Figure 6 – The communication stack.
An illustration of the communication stack is shown in Figure 6. The shadow updates are provided via MQTT, a publish/subscribe protocol. The MQTT communication runs over Amazon FreeRTOS Secure Sockets (aws_sockets.c), a TLS implementation that ensures a secure connection to AWS IoT Core.
In this case, the demo application defines the shadow, so it’s not necessary to specify the shadow in the AWS IoT Core console. The demo application begins by calling SHADOW_Delete to remove any existing shadow definition for the Thing, and then calls SHADOW_Update to define and update the shadow.
The Wifi connectivity is provided by the Qualcomm Atheros QCA4004 module, an independent device that runs the Wifi and TCP/IP stacks. The communication between the NXP LPC54018 MCU and the Wifi module is handled by a Qualcomm driver (the wifi_qca directory) and runs over SPI, which is pretty fast. But you don’t need to worry about the details, unless you are really interested to learn how it works underneath.
To publish your data, all you need is the Shadow API, and Amazon FreeRTOS handles the rest.
Introduction to Percepio Tracealyzer
Tracealyzer is a desktop application that can be downloaded for evaluation on the Percepio website. Register in the form and make sure to select FreeRTOS as target operating system.
Tracealyzer comes with a trace recorder library, provided with full source code, that needs to be added to the project. This is found in the Tracealyzer application directory, under the FreeRTOS folder. The tracing relies on instrumentation points (trace macros) already available in the FreeRTOS kernel. By default, these are empty macros and do not generate any code. The recorder library defines these macros to call the recorder library at suitable events.
Enabling the recorder requires three small changes in your code:
- In FreeRTOSConfig.h:
#define configUSE_TRACE_FACILITY 1 - In FreeRTOSConfig.h (at the very end):
#include “trcRecorder.h” - Early in the startup (main.c), add:
vTraceEnable(TRC_START);
The Tracealyzer User Manual provides a more detailed step-by-step guide, found under Recording Traces > FreeRTOS > Integrating the Recorder. Since we are to use the streaming mode, also do the steps described under Recording Traces > FreeRTOS > Setting up Streaming.
In this post, I am using a SEGGER J-Link debug probe, both for MCUXpresso debugging and for streaming the Tracealyzer data. This popular debug probe is directly supported by Tracealyzer and the recorder library. The recorder library, however, is highly configurable and allows for streaming the data over any interface you may have available; see “stream ports” in the user manual.
The recorder can also be used in “snapshot” mode, where the trace data is kept in ring-buffer in target RAM. This keeps the latest events in memory, from which you can take a snapshot at any point (e.g. when halted on a breakpoint) by transferring the buffer contents to a host-side file. This has some advantages, but typically only allows for short traces. In a later post, I will look into how AWS IoT Core can be used to obtain traces instead of using a J-Link probe.
For an IoT system, you need longer traces and streaming is recommended. Tracealyzer allows for streaming trace data over practically unlimited durations as long as you have storage space. As the typical data rate is quite moderate and measured in KB/s, you may record for many days or even weeks. For instance, we have done a 72-hour trace, spanning over a weekend. This resulted in 20 GB of data. That’s not very much on a modern hard drive, but how do you analyze a 20 GB trace in practice?
For this purpose, we have developed lightning-fast previews of multi-GB trace files, which can deal with trace files of any size. The preview shows high-level metrics and visualizations and allows for selecting a smaller section of relevance for detailed analysis.
Tracing Amazon FreeRTOS with Tracealyzer
To see the runtime behavior in Tracealyzer, begin with opening a new debug session in MCUXpresso IDE, but don’t run it just yet. Start Tracealyzer and then select “Start Streaming Trace.” Tracealyzer should now begin listening for trace data from your device.
Now, select “Resume” the MCUXpresso to start the system. In Tracealyzer, you should see several live views of the Amazon FreeRTOS runtime behavior, as seen in the video.
Since I didn’t have the serial connection, I thought it would be nice to see the already existing “printf” logging in Tracealyzer as “user events.” Most diagnostic prints in this project rely on a macro called configPRINTF, defined in FreeRTOSConfig.h. The configPRINTF macro was modified to generate Tracealyzer user events by calling vTraceConsoleChannelPrintF, instead of writing to the VCOM serial port.
This function, vTraceConsoleChannelPrintF, was added in Tracealyzer v4.1.2 for this very purpose and works as a drop-in replacement for printf. It uses vsnprintf from stdio.h to format the string in runtime and the resulting strings are stored as Tracealyzer user events, labeled “Debug Console” in Tracealyzer. User events are shown in the Event Log and also in the trace view, as yellow labels.
This way, there was no longer a need for the Logger task, so I disabled that as well. Finally, to see more information about the MQTT communication, I enabled the option mqttconfigENABLE_DEBUG_LOGS in aws_mqtt_config.h.
A Note on SEGGER J-Link and RTT Data Transfer
The SEGGER J-Link streaming uses a feature in the J-Link probes called RTT, or Real-Time Transfer, which relies on a RAM buffer in the target system (a few KB) which is read by the probe during execution.
This usually works fine, but on my first attempt of connecting with Tracealyzer, it didn’t get any data. This was because the SEGGER RTT control block (named _SEGGER_RTT) had been placed in a secondary RAM bank of the LPC54018. The SEGGER J-Link driver is supposed to find this automatically by scanning the RAM, but it only searched the first 64 KB of the primary RAM bank. Luckily, you can change the placement of _SEGGER_RTT by adding a definition to SEGGER_RTT_Conf.h.
The following setting works in this case:
#define SEGGER_RTT_SECTION ".data.$RAM2"
In this string, “data” reflects the linker section and RAM2 is the RAM bank. In MCUXpresso IDE, you can see the available RAM banks under Project properties > C/C++ build > MCU Settings > Memory Details. Note that the section should really be “bss” since the RTT control block is not initialized at compile time, but that section was outside the scanning range of the J-Link driver.
Analyzing the Amazon FreeRTOS Application with Tracealyzer
When preparing for writing this post, I could not get the board to connect to my Wifi network. An excellent opportunity for Tracealyzer to prove its worth. I recorded the system behavior from the startup and got a 16-second trace, and then the system stopped for some reason. The trace can be seen in Figure 7. Note that the views are zoomed out to overview the full 16-second trace, so you don’t see much details at this zoom level.
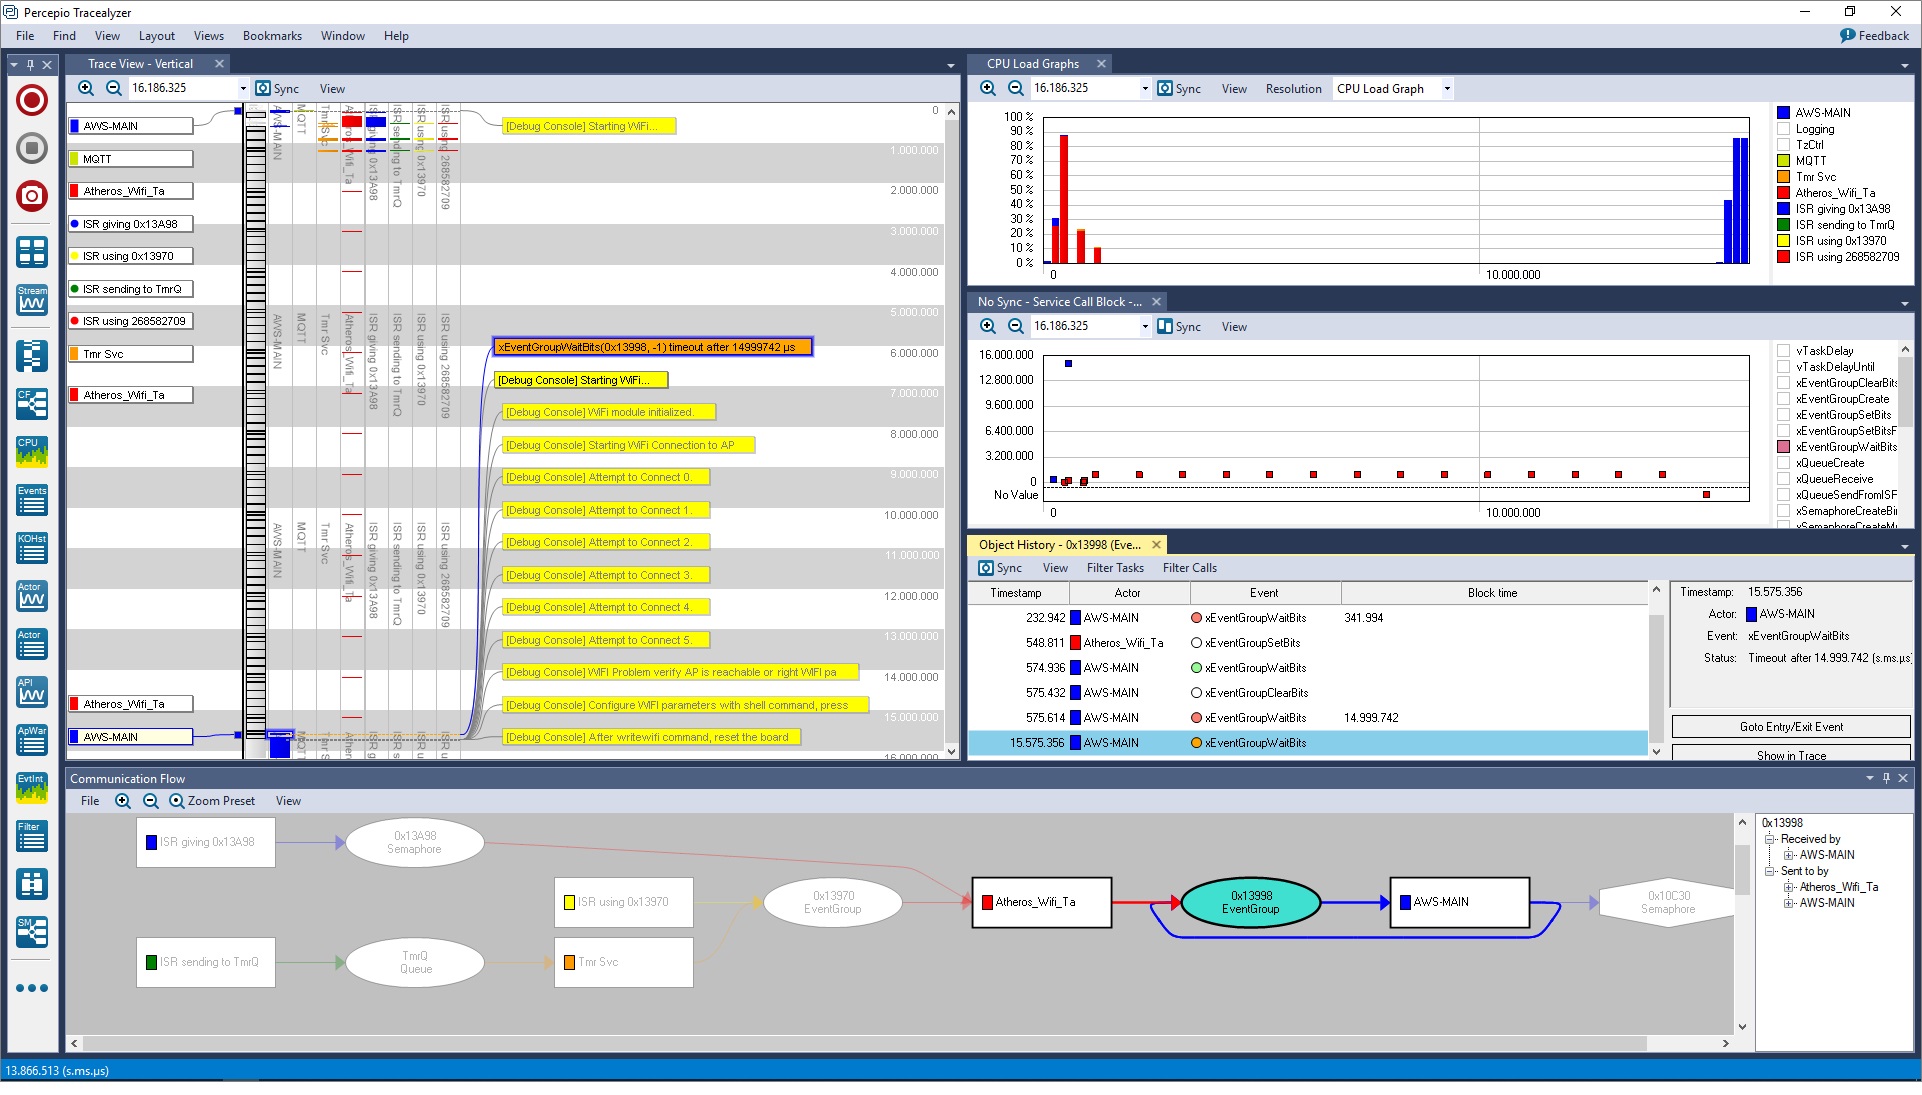
Figure 7 – The system fails to connect and stops after 16 seconds.
You can see an initial burst of activity for about 1 second at the top of the vertical time-line, and then the system becomes almost idle and seems to waits for something. After about 15 seconds, this ends with a timeout on a xEventGroupWaitBits call (the orange label) in the AWS_MAIN task (blue).
The configPRINTF logging (shown as yellow user events) revealed this occurs just after the initial “Starting Wifi” event, and after the timeout there is a second “Starting Wifi” event (apparently it tries again and fails), which seems to be related to the connection problem.
To get an overview of the application, I opened the Communication Flow view (bottom part), which shows how the tasks are interacting via kernel services, such as Event Groups and Semaphores. In this case, it shows that the AWS_MAIN task receives input from the Wifi task (Atheros_Wifi_Task) via an Event Group object, probably to inform about the Wifi status.
We can see a filtered view showing only these events in the Object History view (the highlighted one), which reveals there has only been a few EventGroup events in the Wifi task > AWS_MAIN interaction, early in the trace, and no further interactions after the timeout.
So what does this timeout mean? When I knew what kernel call was the direct cause of the 15-second blocking, I could quickly find it in MCUXpresso IDE by searching for references to xEventGroupWaitBits.

Figure 8 – Calls to xEventGroupWaitBits found by MCUXpresso IDE.
Luckily, there was only one such call in the Wifi code. I put a breakpoint there, restarted the debug session, and then checked the call stack to see the context. This revealed the below statement, which has a 15-second timeout matching the symptoms.

Figure 9 – The cause of the 15 second timeout.
To verify this, I added logging to highlight the problem in the trace. The result can be seen in Figure 9.

Figure 10 – The timeout issue highlighted in Tracealyzer.
After some further experimentation, it just started working all of a sudden. The call didn’t block for any noticeable time and the application reported an IP address. I was happy but a bit puzzled by this random behavior, so I decided to check the stack usage of the tasks to see if the problem could have been a stack overflow. After all, that may cause all sorts of random problems.
For this purpose, I used the built-in stack analysis tool in MCUXpresso found under “Task List (FreeRTOS). The stack usage seemed fine, so I figured it must be something else.

Figure 11 – Stack usage of Amazon FreeRTOS tasks shown in MCUXpresso IDE.
I noticed the problem only occurred on the first run each debug session. If I made “restart” within the MCUXpresso debugger, it worked perfectly. Just increasing the timeout didn’t help, so the problem seemed to be related to the device programming. Moreover, I used a SEGGER J-Link probe while the developer of the Demo Project (Blue Wind) used LPC-Link2 probes and didn’t have this problem.
I finally updated the J-Link driver from the SEGGER website to version 6.32c, which solved the problem. The Wifi connection worked reliably and, after some additional minor issues, also connected to AWS. So, make sure to update your J-Link driver from SEGGER’s website when working with the LPC54018 using a J-Link.
When using Tracealyzer in parallel with another development tool like MCUXpresso IDE, this results in two instances of the J-Link driver. This is supported, but it’s important they are of the same version. It is therefore advised to always update the J-Link driver after installing Tracealyzer or another debugging tool using the J-Link driver. This way, all copies of the driver are updated to the same version.
Summary
In summary, this article has demonstrated how to get started with Amazon FreeRTOS, AWS IoT Core, and Percepio Tracealyzer using the NXP OM40007 IoT kit as example.
For further information, please see:
In the next article, we will take a closer look at the Amazon FreeRTOS communication stacks and how Tracealyzer can be used to analyze the communication with AWS IoT Core. This can be useful for debugging the AWS IoT connectivity, as shown in this article, but also allows you see the data transmissions in parallel with the software behavior.
This way, you can check that your application only transmits data when it is supposed to, find bugs causing unnecessary data traffic and optimize your application to reduce data traffic costs.
The content and opinions in this blog are those of the third party author and AWS is not responsible for the content or accuracy of this post.
.
|
Percepio – APN Partner Spotlight
Percepio is an APN Standard Technology Partner. Tracealyzer provides unprecedented insight into the run-time world of FreeRTOS systems. Solve problems in a fraction of the time otherwise needed, develop more robust designs to prevent future problems, and find new ways to improve software performance.
Contact Percepio | Solution Overview | Free Trial
*Already worked with Percepio? Rate this Partner
*To review an APN Partner, you must be an AWS customer that has worked with them directly on a project.