AWS Cloud Financial Management
Calculating the Return on Investment (ROI) of AI
If every dollar invested in artificial intelligence (AI) generated a two-dollar return, rising costs would signal positive ROI rather than inefficiency. However, establishing a relationship between AI spend and business value can be complex, leaving you without clear metrics on when to scale or recalibrate initiatives. To calculate ROI (refer to Figure 1), you start by allocating your costs, then you align them to the business outcome they will support. This gives you a Cost per Outcome, the building block for ROI. Once you can measure what each outcome costs, calculating ROI is simply a matter of comparing that cost against the value it delivers.
This post outlines a practical methodology for aligning AI investments with business impact. We detail how to classify use cases, attribute costs, and identify the initiatives that drive measurable value.
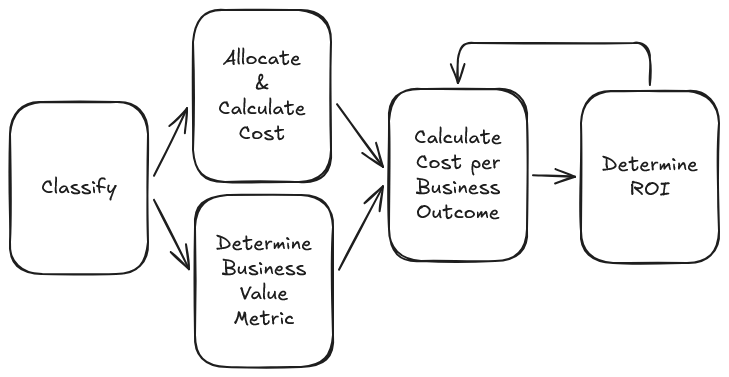
Figure 1: ROI Calculation Process
Classify your AI Use Cases
Before evaluating the value of an AI use case, you should name and classify your AI deployments by determining how they are being used within your business. The two categories, for this evaluation, are ‘internal’ and ‘external’.
External
External AI should directly map to revenue-producing activities where the cost can become part of the cost of goods sold. To understand this, think about the things that create revenue for your business. Then look at the direct and indirect ways that AI supports those functions.
Internal
Internal AI generally supports developer productivity (coding assistants, workflow automation) or broader employee efficiency. It enhances, automates, and streamlines business activities. Attributing Internal AI to ROI can be more difficult because these deployments often don’t tie directly to revenue-generating activities. This challenge is not unique to AI, but common to any investment in operational productivity. To measure returns, focus on quantifiable outcomes discussed in the ‘Determine the Business Value Metric’ section below.
Within these use cases, you should also distinguish between structured and unstructured interactions. Structured use refers to agents built with a defined goal, specific KPIs, and predictable execution patterns such as an assistant built to answer questions about a customer’s order history. Structured use is easier to allocate than unstructured. Unstructured use covers ad-hoc, general-purpose interactions like coding assistants or chat interfaces where the agent’s behavior is open-ended and extensible. While unstructured use is a major driver of developer productivity, it may require more granular allocation for it to align with business value metrics. Recognizing this distinction supports more accurate cost allocation.
Calculate the Cost
Increasing AI costs are an important catalyst for determining the ROI of your AI investments. Cost can sometimes be misattributed and understated. The first factor in determining cost is to verify that you have calculated the Total Cost of Ownership (TCO).
To determine your AI TCO, start by calculating direct costs from managed AI services such as Amazon Bedrock, Claude Platform on AWS, or Amazon Kiro. If your organization manages their own infrastructure, you will also want to calculate Amazon Elastic Compute Cloud (Amazon EC2) Accelerated Compute Instance and Amazon SageMaker AI costs.
Once you have quantified the direct costs, you will want to calculate the indirect/related costs. These costs typically fall into the following four categories:
- Storage – AI training can require large amounts of data. Verify that you include both storage and retrieval costs. AI inference may also rely on Retrieval-Augmented Generation (RAG) or reference data. These costs will show up as Vector Database costs and can, in some cases, be significant and proportionate to your AI inference.
- Data Transfer – If your AI solution needs to read or write data, that information may need to move across boundaries which could generate data transfer traffic. Some AI systems also need to communicate with additional services or external systems. These types of data flows may generate data transfer costs.
- Monitoring & Reporting – To understand AI utilization and tracking it is important to generate log and utilization data. This data may need to be reported or analyzed in a dashboard or reporting system. The monitoring, data, and dashboard user licensing should be factored into your total AI solution costs.
- Agentic AI – Agentic AI systems make decisions and perform tasks to complete objectives. To accomplish objectives, the system may interact with additional services or external systems using AWS Lambda functions or Amazon API Gateway. Agentic costs may be highly variable depending on the AI use case.
Granular Allocation
Visibility and allocation will help you connect your AI costs to business value. Without granular attribution, AI spend appears as a single line item, making it impossible to determine which team, application, or use case is generating the costs. With Amazon Bedrock you can access multiple cost attribution mechanisms, depending on which API endpoint your application uses.
bedrock-runtime
- IAM Principal-Based Cost Allocation – Automatically records the caller identity for every API call
- Request-Level Metadata – Tags individual inference calls with key-value pairs that land in your model invocation log
- Application Inference Profiles – You can create an ARN for a specific model and pass it in place of the model ID on bedrock-runtime calls
bedrock-mantle
- Projects – For OpenAI-compatible Responses and Chat Completions APIs
- Workspaces – For Anthropic-compatible Messages API
These mechanisms differentiate where the cost data surfaces. IAM Principal, Application Inference Profiles, Projects, and Workspaces all produce aggregated cost allocation data that appears in AWS Cost Explorer and AWS Cost and Usage Report (CUR), making them suitable for finance-driven chargeback and showback. Request-Level Metadata, by contrast, records per-prompt token counts in your model invocation logs rather than in cost data. This distinction matters when choosing your approach. If your goal is billing-native reporting for finance teams, use the cost-supported allocation methods; if you need per-request granularity, for engineering optimization, you will also want to enable Request-Level Metadata.
These approaches are complementary, not competing. A common pattern is to enable IAM principal attribution for automatic, always-on identity tracking (requiring no code changes). Use Projects/Workspaces or Application Inference Profiles for aggregate allocation, and Request-Level Metadata for per-prompt detail when needed. Start with the mechanism that addresses your immediate needs, then layer additional methods as your attribution requirements mature. Your goal is to attribute AI spend back to its use case, team, or application generating business value. This is the foundation for calculating Cost per Outcome in the next section.
Determine your Business Value Metric
A business value metric is a metric that helps determine business health or profitability. The first step in determining your business metric(s) is to verify that it is something that can be measured. It is important that the business metric cannot be manipulated.
Goodhart’s Law “When a measure becomes a target, it ceases to be a good measure.”
For example, if you chose a metric ‘lines of code produced by developers’, the developers could easily instruct the AI to add documentation lines in the code to inflate this metric. Instead, you will want to verify that your AI investment outcome aligns to a business value. Continuing the developer example, this could involve features launched or bugs remediated in support of software development.
Business value metrics can be classified into three categories:
- Business and Product Revenue: Measures direct top-line financial returns tied to an AI solution.
- Example Metrics: Product sales, subscriptions, risk/fraud avoided, credits billed
- Challenges: Direct attribution is difficult because top-line revenue is heavily influenced by non-AI variables like sales execution, marketing spend, and competitive dynamics. AI becomes a component of the cost of goods sold.
- Development Metrics: Tracks technical velocity and operational outputs that support revenue.
- Example Metrics: Deployment frequency, features delivered, bugs resolved.
- Challenges: Output requires normalization. Story points, features, and fixes vary significantly in complexity, scope, and actual business impact.
- Revenue Support Metrics: Measures downstream engagement and conversion indicators that indirectly support revenue.
- Example Metrics: Ad views, click-through rates, retention rates, trust and satisfaction scores
- Challenges: Like direct revenue, these metrics are susceptible to outside influence and non-AI factors like user experience updates and promotional campaigns.
Once you define a metric, establish a pre-AI baseline to track its progress alongside AI adoption. Re-evaluate this metric on a cadence and whenever major changes occur.
Calculate the ROI
With the above pre-requisites defined, you can begin calculating Cost per Outcome which will help you quantify ROI.
Cost per Outcome = AI Cost / Business Value Metric
Using developer productivity as an example, with a business value metric of software bugs remediated, you can perform the following analysis.
Note: This example assumes developers are a fixed cost that will not fluctuate over the course of the analysis. If AI is being used to augment developers, then the developer cost should be included in the total cost since it would fluctuate based on AI utilization. This example also assumes there is an immediate time-to-value. In many cases there is a ramp-up period between when AI is deployed and when your business value metric is influenced.
This example will start with a baseline of 5 bugs remediated per week. After providing your developers with AI, your first Cost per Outcome measurement may look like this:
15 bugs remediated per week with a total AI cost of $5000. Since 10 new bugs (15-5 baseline) are a result of AI, the calculation will be:
$500 per bug remediated = $5000 / 10 bugs remediated
This metric is a starting point to determine the current and future value of your AI investment. This tells you that each bug remediated with AI costs $500.
As you measure additional weeks, you will observe changes in two values:
1. Business Value Metric: The bugs remediated will increase as developers become more efficient, or it will decrease as the bugs get more complex to resolve (or there are fewer bugs to remediate). Assuming the Cost stays fixed:
- Bugs remediated increases. Cost per Outcome will decrease. You are getting more efficiency from your AI investment.
- Bugs remediated decreases. Cost per Outcome will increase. You are getting less efficiency for your AI investment.
When the Cost per Outcome metric increases, it doesn’t necessarily indicate that the ROI is decreasing. It is important to evaluate the importance of the bugs remediated to determine if AI is enabling more complex bug resolution. Advanced ROI analysis may include additional business value metrics, like bug complexity, to determine if using AI for bug remediation is resulting in a better user experience.
2. Cost: The AI costs may vary as developers use AI to work on different quantities of bug remediation, as variable context is included, or as new providers or models are used that have differing token costs.
- Costs increase. Cost per Outcome will increase. You are getting less efficiency from your AI investment.
- Costs decrease. Cost per Outcome will decrease. You are getting more efficiency from your AI investment.
The example above is simplified to illustrate how each variable influences your Cost per Outcome. In practice, both the numerator (cost) and the denominator (business value) will shift over time as models change, usage patterns evolve, and the work itself becomes more or less complex. Cost per Outcome is not ROI. It is the unit-level building block that will help you determine ROI.
Once you know what each successful outcome costs, you will relate that figure to the Business and Product Revenue item it supports. Following our example, bugs fixed may relate to a product or subscription that is sold to customers. These additional costs become part of the cost of goods sold in your net income and ROI calculations.
Tracking Cost per Outcome at regular intervals gives you the data to evaluate ROI impact, scale what works, pivot what doesn’t, and spot when spend outpaces value. Following this method will help you calculate ROI as a repeatable, defensible metric rather than a one-time estimate.
Conclusion
Calculating the ROI of AI answers one question: “What does each successful AI-driven outcome cost, and what is that outcome worth to your business?”
The Cost per Outcome calculation gives you the foundation. Associating it with the business revenue it supports gives you the ROI. However, this calculation should not be the sole factor in your AI strategy. Innovation requires room to experiment. While short-term ROI may look weak for some initiatives, the long-term payoff and competitive edge could generate new revenue streams. Use ROI to gain visibility into your agentic workloads, to set thresholds, and to make keep-or-stop decisions, while maintaining the flexibility to nurture high-potential projects that don’t yet fit standard metrics.
To get started, tag your top three AI workloads using the cost allocation mechanisms outlined above, identify one business value metric for each, and calculate your first Cost per Outcome this quarter. By shifting from reactive cost tracking to proactive value management, you transform AI from a line item into a strategic engine for your business.