AWS Cloud Financial Management
GlobalFoundries’s journey to building a FinOps operating model on AWS
Introduction
GlobalFoundries (GF) set out to transform cloud cost management by building a FinOps operating model with AWS native tools, a strategic decision driven by the growing complexity of their multi-account environment. As cloud adoption scaled, so did the need for a disciplined approach to cost management. Cloud spend was growing, but there was no visibility into what was driving costs or where optimization potential existed.
At the macro level, leadership lacked actionable visibility to cloud spend. Cloud spend was tracked only at a high level, without unit-cost metrics tied to business outcomes. There was no way to measure whether cost per CPU hour was improving month over month, or whether the overall compute efficiency posture was trending in the right direction
At the micro level, small but recurring inefficiencies such as invisible waste spread across services, accounts, and regions went unnoticed and unaddressed.
The Challenge
- Visibility – Spending was tracked at a high level, but without unit-cost metrics leadership couldn’t determine whether efficiency was improving or degrading month over month as cloud workload sizes grew.
- Commitment waste – Without efficient discount sharing across accounts, the bursty nature of workloads created coverage gaps and left spend at on-demand rates.
- Reactive posture – Cost overruns surfaced during monthly billing reviews — too late to prevent impact. There was no early warning system for unexpected spend.
- Over-provisioned infrastructure – Resources were over provisioned across the organization, but without impact-ranked actionable views, gaining visibility to the scope was a challenge.
- Team empowerment – Teams lacked self-service access to cost information.
GF needed more than tools. They needed an operating model — the processes, governance, and tools to make cost excellence the default, not the exception.
Solution
GF partnered with their AWS Technical Account Manager through AWS Unified Operations to design and implement a FinOps operating model around five capabilities, each powered by an AWS native service. Together, these form a continuous loop (see Figure 1):
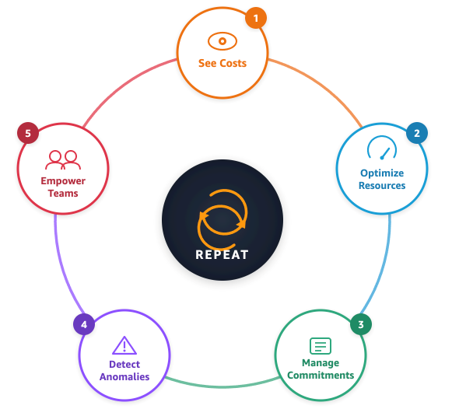
Figure 1: GF Finops Operating Model
1. See Costs: Are we running the Cloud more efficiently, even as workloads grow?
Workloads in GlobalFoundries accounts were growing rapidly, so volumetric numbers alone didn’t provide insight into how well waste being reduced and rates were being optimized
To address the visibility gap, GF used the AWS Cost and Usage Report (CUR) as the single data source feeding into Amazon QuickSight. GlobalFoundries extended the CUDOS dashboard framework to define unit-cost KPIs aligned to their business. These metrics covered executive level views, IT focused views, and business area specific views.
At the infrastructure level, GF tracks cost per Amazon Elastic Compute Cloud (Amazon EC2) virtual CPU (vCPU) hour, month over month. A rising unit cost triggers investigation into commitment coverage, modernization, and optimization. When the team meets its Savings Plans and Spot Instance targets, unit cost improves even as overall usage increases. GF enriched this foundation by combining CUDOS with high-performance compute (HPC) job scheduler log data, including job submission times, core-hour consumption, and project tags, to produce KPIs that revealed compute cost per Electronic Design Automation (EDA) project and highlighted efficiency opportunities.
Beyond infrastructure, GF connects cloud spend to business outcomes by tracking the percentage of compute hours used on EDA jobs. This gives leadership a direct line of sight from cloud efficiency to business value, answering not just “are we spending less per vCPU?” but “what percent of all CPU hours are used on a design engineering or tapeout deliverable?”
All metrics are calculated from AWS Cost and Usage Report (CUR) data and surfaced through Amazon QuickSight dashboards, giving leadership visibility into unit-cost trends and month-over-month trajectories at both the infrastructure and business level.
Creating visibility to unit costs drove urgency to take advantage of opportunities to reduce – GF saw a 9%-unit cost reduction (see Figure 2) in a 4-month time period, as measured by unit cost dashboard KPIs.
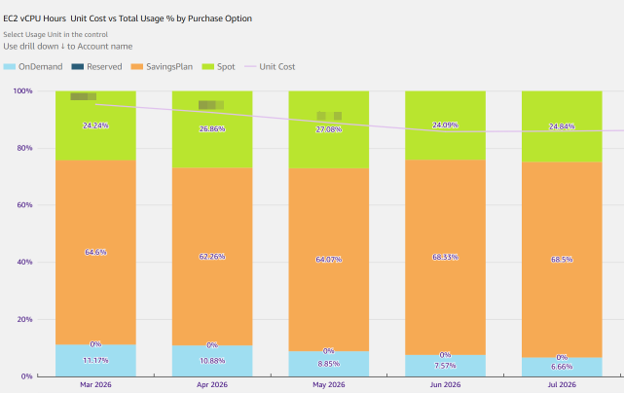
Figure 2: EC2 vCPU Hours Purchase Option Mix and Unit Cost Trend
In one other case, GF saw an 86% improvement in compute efficiency on a large EDA project compared to benchmarks. This improvement was surfaced in the compute cost per EDA project analytics. This allowed the team to forecast compute costs with accuracy and continue to prioritize optimization opportunities.
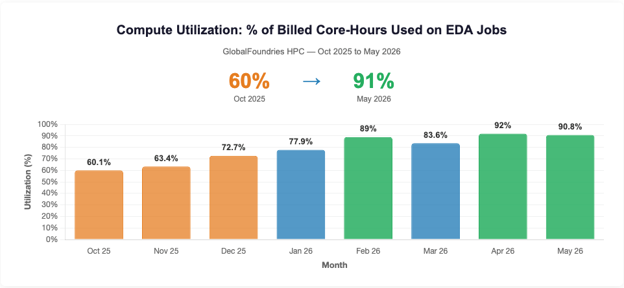
Figure 3: Efficiency metrics – Percentage of Billed Compute Hours Used on EDA Jobs
Figure 3, shows how GlobalFoundries compute utilization improved from 60% to 91% over eight months, measuring the percentage of billed core-hours that went toward actual EDA jobs. The steady upward trend indicates that optimization efforts significantly reduced wasted compute capacity.
2. Optimize Resources: Where are we overprovisioned and can reduce waste?
With visibility established, GF tackled their most immediate savings opportunity. Over-provisioned EC2 instances, identified by AWS Compute Optimizer
Realizing this opportunity required several technologies working together.
- AWS Compute Optimizer continuously analyzed EC2 instances across the organization, comparing actual utilization against instance capacity to flag right-sizing opportunities. Each recommendation included the target instance type, estimated monthly savings, and a performance risk rating.
- Custom Amazon QuickSight dashboards ingested these recommendations and grouped them by the responsible IT leader and business area. This gave each leader a prioritized view of their team’s right-sizing opportunities ranked by potential savings, rather than a single org-wide list that no one owned.
- Kiro skills used the AWS Command Line Interface (AWS CLI) and custom analytics to present IT leaders with only the right-sizing opportunities they were responsible for reviewing and actioning. This removed the noise of unrelated recommendations and made it clear what each leader needed to act on.
- Additional Kiro skills helped standardize and operationalize the multi-step engineering workflow required whenever an instance is changed, including creating snapshots, scheduling maintenance windows, modifying the instance type, and validating application performance post-change.
GF identified savings opportunities totaling 4.5% of their total compute spend, delivered them to the accountable leaders, and put the right operational workflow in place to see those savings realized.
3. Manage Commitment: How do I share savings plans, while respecting internal financial boundaries?
To verify that financial commitments (Savings Plans) and costs were correctly flowing to the right business area, GF purchased Savings Plans at the account level rather than the management account. However, this created a challenge with sharing Savings Plans to maximize utilization within each business area.
The bursty nature of HPC workloads, where compute demand spikes unpredictably during design tape-outs and simulations, makes commitment planning at the individual account level challenging. Usage that qualified for discounts in one account would go uncovered while another account’s reservations sat partially unused.
GF restructured how commitment-based discounts flow across their organization using Reserved Instance and Savings Plans sharing preferences. Within the AWS Billing Console, the team organized linked accounts into sharing groups aligned to each business area
By activating group sharing across their linked accounts, discounts are pooled within a group of accounts shared by a business area and applied wherever eligible usage occurs, regardless of which account generates it. This turns a fragmented discount strategy into a centralized, organization-wide benefit.
GF improved Savings Plans utilization on average from 80% to 100% in Q1 by utilizing the fine-grained controls of Reserved Instance and Savings Plans.
The result is that discount coverage becomes an organization-wide benefit, maximizing savings without requiring each team to independently forecast and purchase commitments.
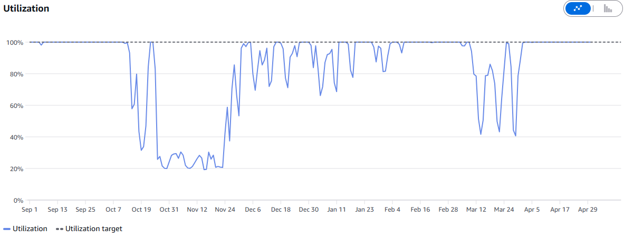
Figure 4: Savings Plans Utilization Over Time
4. Detect Anomalies: How do I get early warning if consumption is changing at an unexpected rate?
In a usage-based environment, any one of thousands of resources can see cost and usage spikes with no early warning for cloud teams. This creates a management challenge, ensuring that those are caught and evaluated quickly across a vast cloud landscape.
To address this need, GF deployed AWS Cost Anomaly Detection with percent-based and dollar-based warning thresholds that send alarms when an anomaly is detected for a service in the environment. When an anomaly is detected, the team investigates the root cause and determine whether it represents an expected rise in usage or an issue requiring remediation.
In one case, a mis-configured cloud service resulted in millions of AWS Key Management Service (AWS KMS) key calls. Even though the service appeared to be functioning from a technical perspective, it triggered a cost anomaly. The team investigated and not only corrected the service configuration, but caught and fixed the issue in days, rather than months, reducing the service’s cloud spend.
The result is that cost anomalies are surfaced in hours rather than discovered at month-end, giving teams time to act before small issues become large bills.
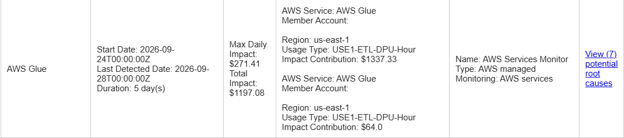
Figure 5: AWS Cost Anomaly Detection Identifying Unexpected AWS Glue Spend
5. Empower Teams: How do I build accurate cloud cost estimates into my engineering process?
A common IT challenge arises when a cloud project proposal comes to the design review board with sparse cost details, only for the team to discover later in the project that the estimates were inaccurate.
To build accurate costing into the engineering workflow and deliver cost estimates more quickly than before, GF rolled out the final pillar of their operating model; the AWS Billing and Cost Management MCP server.
GF’s cloud engineering team delivers multiple cloud cost estimates a day, ranging from simple requests to complex project analysis. Using the AWS Billing and Cost Management MCP server, you can generate AI-powered cost estimates. The engineering team paired the AWS Billing and Cost Management MCP servers with Kiro to generate AI-powered cost estimates with rapid turnaround times.
Using this workflow, GF can generate initial cloud cost estimates in approximately 15 minutes in cases that previously required up to four hours of manual research and analysis.
Engineers can now lead thorough pricing discussions, and investigate billing or cost questions using AI-powered tools available directly in their IDE.
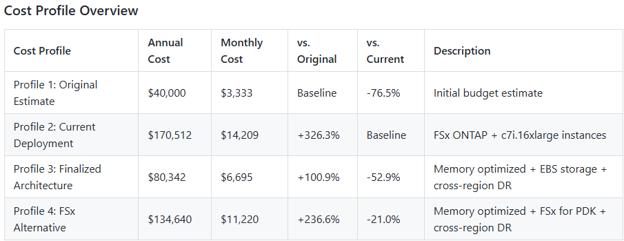
Figure 6: Example Cost Profile Overview
Results
By building a FinOps operating model on AWS native tools, GlobalFoundries transformed cloud cost management from a periodic manual exercise into a continuous, data-driven discipline. The five-pillar framework (See Costs, Optimize Resources, Manage Commitments, Detect Anomalies, Empower Teams) gives GF organization-wide visibility, automated waste detection, and maximized discount coverage. It also provides proactive anomaly alerting and engineering self-service for cost and pricing data.
Take the Next Step
Build FinOps operating model with these resources:
- Cloud Intelligence Dashboards (CUDOS): Deploy in your environment
- AWS Compute Optimizer: Enable organization-wide recommendations
- RI and SP Sharing Configuration: Manage discount sharing preferences
- AWS Cost Anomaly Detection: Set up automated monitoring
- Billing and Cost Management MCP Server: Get started on Billing and Cost Management MCP Server
- AWS FinOps Guide: Cloud Financial Management with AWS