AWS Cloud Financial Management
Transforming FinOps with the Latest Amazon Q Cost Capabilities
The latest Amazon Q cost capabilities are transforming how FinOps teams navigate cloud spend. By the time a FinOps team flags an expensive configuration, it may already be running in production. The fix can be more disruptive to deploy, the discussions can be more challenging, and the savings are often smaller than they could have been.
Amazon Q is accelerating your ability to get answers and make decisions. Over the past year, AWS has expanded Amazon Q’s cost capabilities, from answering pricing questions in natural language to surfacing optimization recommendations directly inside developer workflows. The result is a fundamentally different way for you to engage with cloud costs: not as a monthly review exercise, but as a continuous, conversational part of how you build and operate.
Getting Started and Prerequisites
Amazon Q Developer is available directly in the AWS Console with no additional setup required. To begin, locate the Amazon Q chat interface icon in the top left corner of your AWS Console.
To use the capabilities covered in this post, ensure you have AWS Cost Explorer enabled and an AWS Identity and Access Management (IAM) permissions for both Amazon Q and billing data. For access to the full range of features, it is also recommended to enable the AWS Cost Optimization Hub and AWS Budgets. Review the following IAM policies to allow users to access features of Amazon Q Developer on AWS apps and websites, including the AWS Management Console, AWS Console Mobile Application, and AWS Documentation site.
Amazon Q Developer offers a Free Tier of 50 queries per month, which covers most ad-hoc cost investigations and periodic reviews. Teams requiring higher usage can upgrade to the Pro Tier at $19 per user per month. All features discussed here are included in both the Free and Pro subscriptions. For full details, see Amazon Q Developer Pricing.
Faster and Smarter Cost Analysis
The core capability of the new feature is speed and depth. FinOps analysts often spend hours researching multiple datasets to answer questions like “Why did my compute spend go up last week?”. Amazon Q now automates getting answers that would have otherwise required a manual review of dashboards or cost data. You can ask complex questions involving calculations such as “How has my EC2 cost per hour trended over the last 3 months?” (see Figure 1 and Figure 2).
When you submit a question to Amazon Q, it retrieves granular data from multiple sources, performs custom calculations (like dividing costs by usage quantity), and delivers the data you need without you having to figure out where to find it. It also supports hourly and resource level granularity, allowing for investigations into scaling and other dynamic activities.
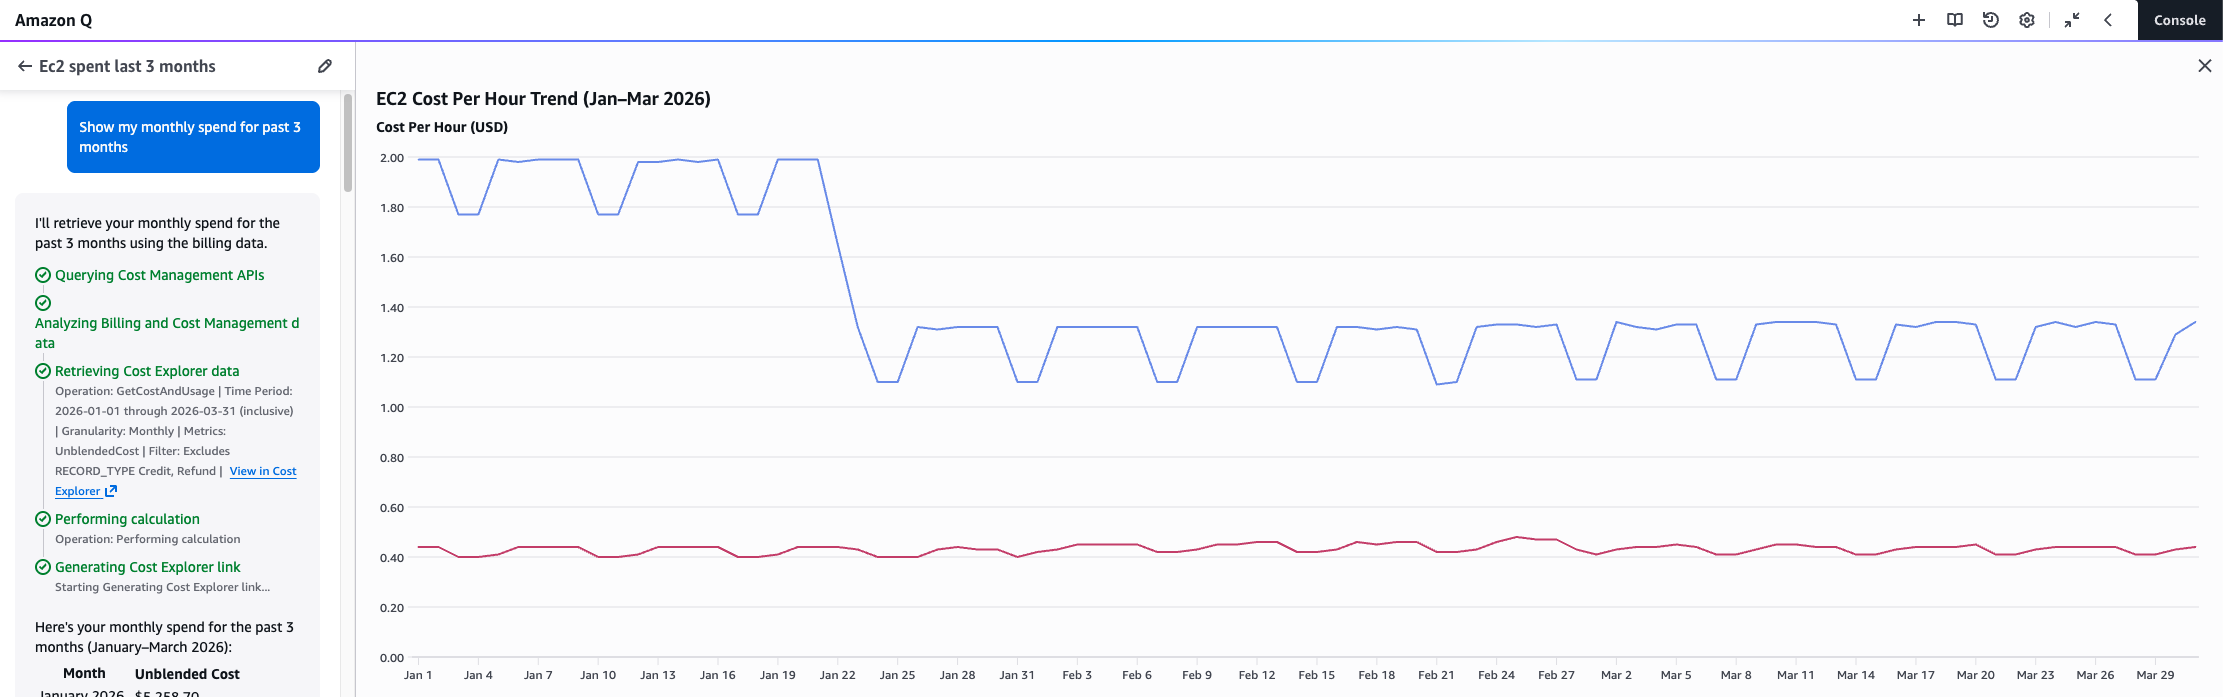
Figure 1 – Amazon Q chat showing steps and ‘View in Cost Explorer’ links
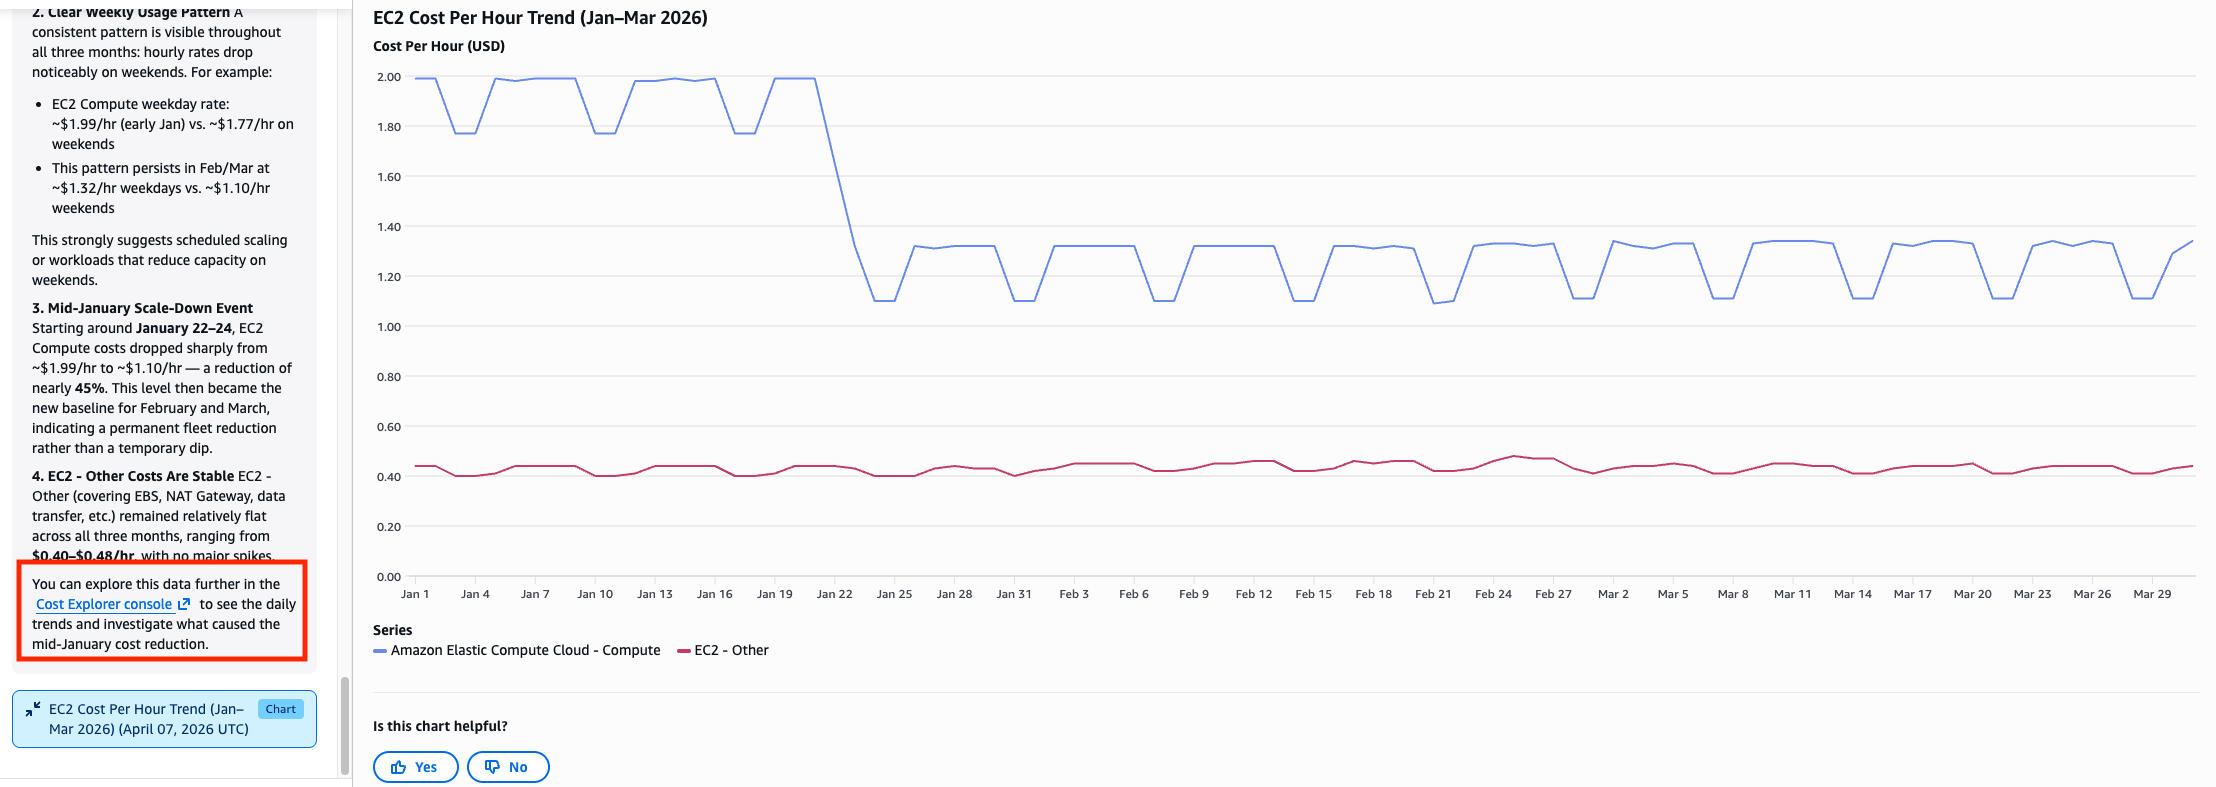
Figure 2 – Amazon Q chat showing output and analysis
Each response includes transparency into the API calls made and ‘View in Cost Explorer’ links so you can audit the underlying data directly (see Figure 3).
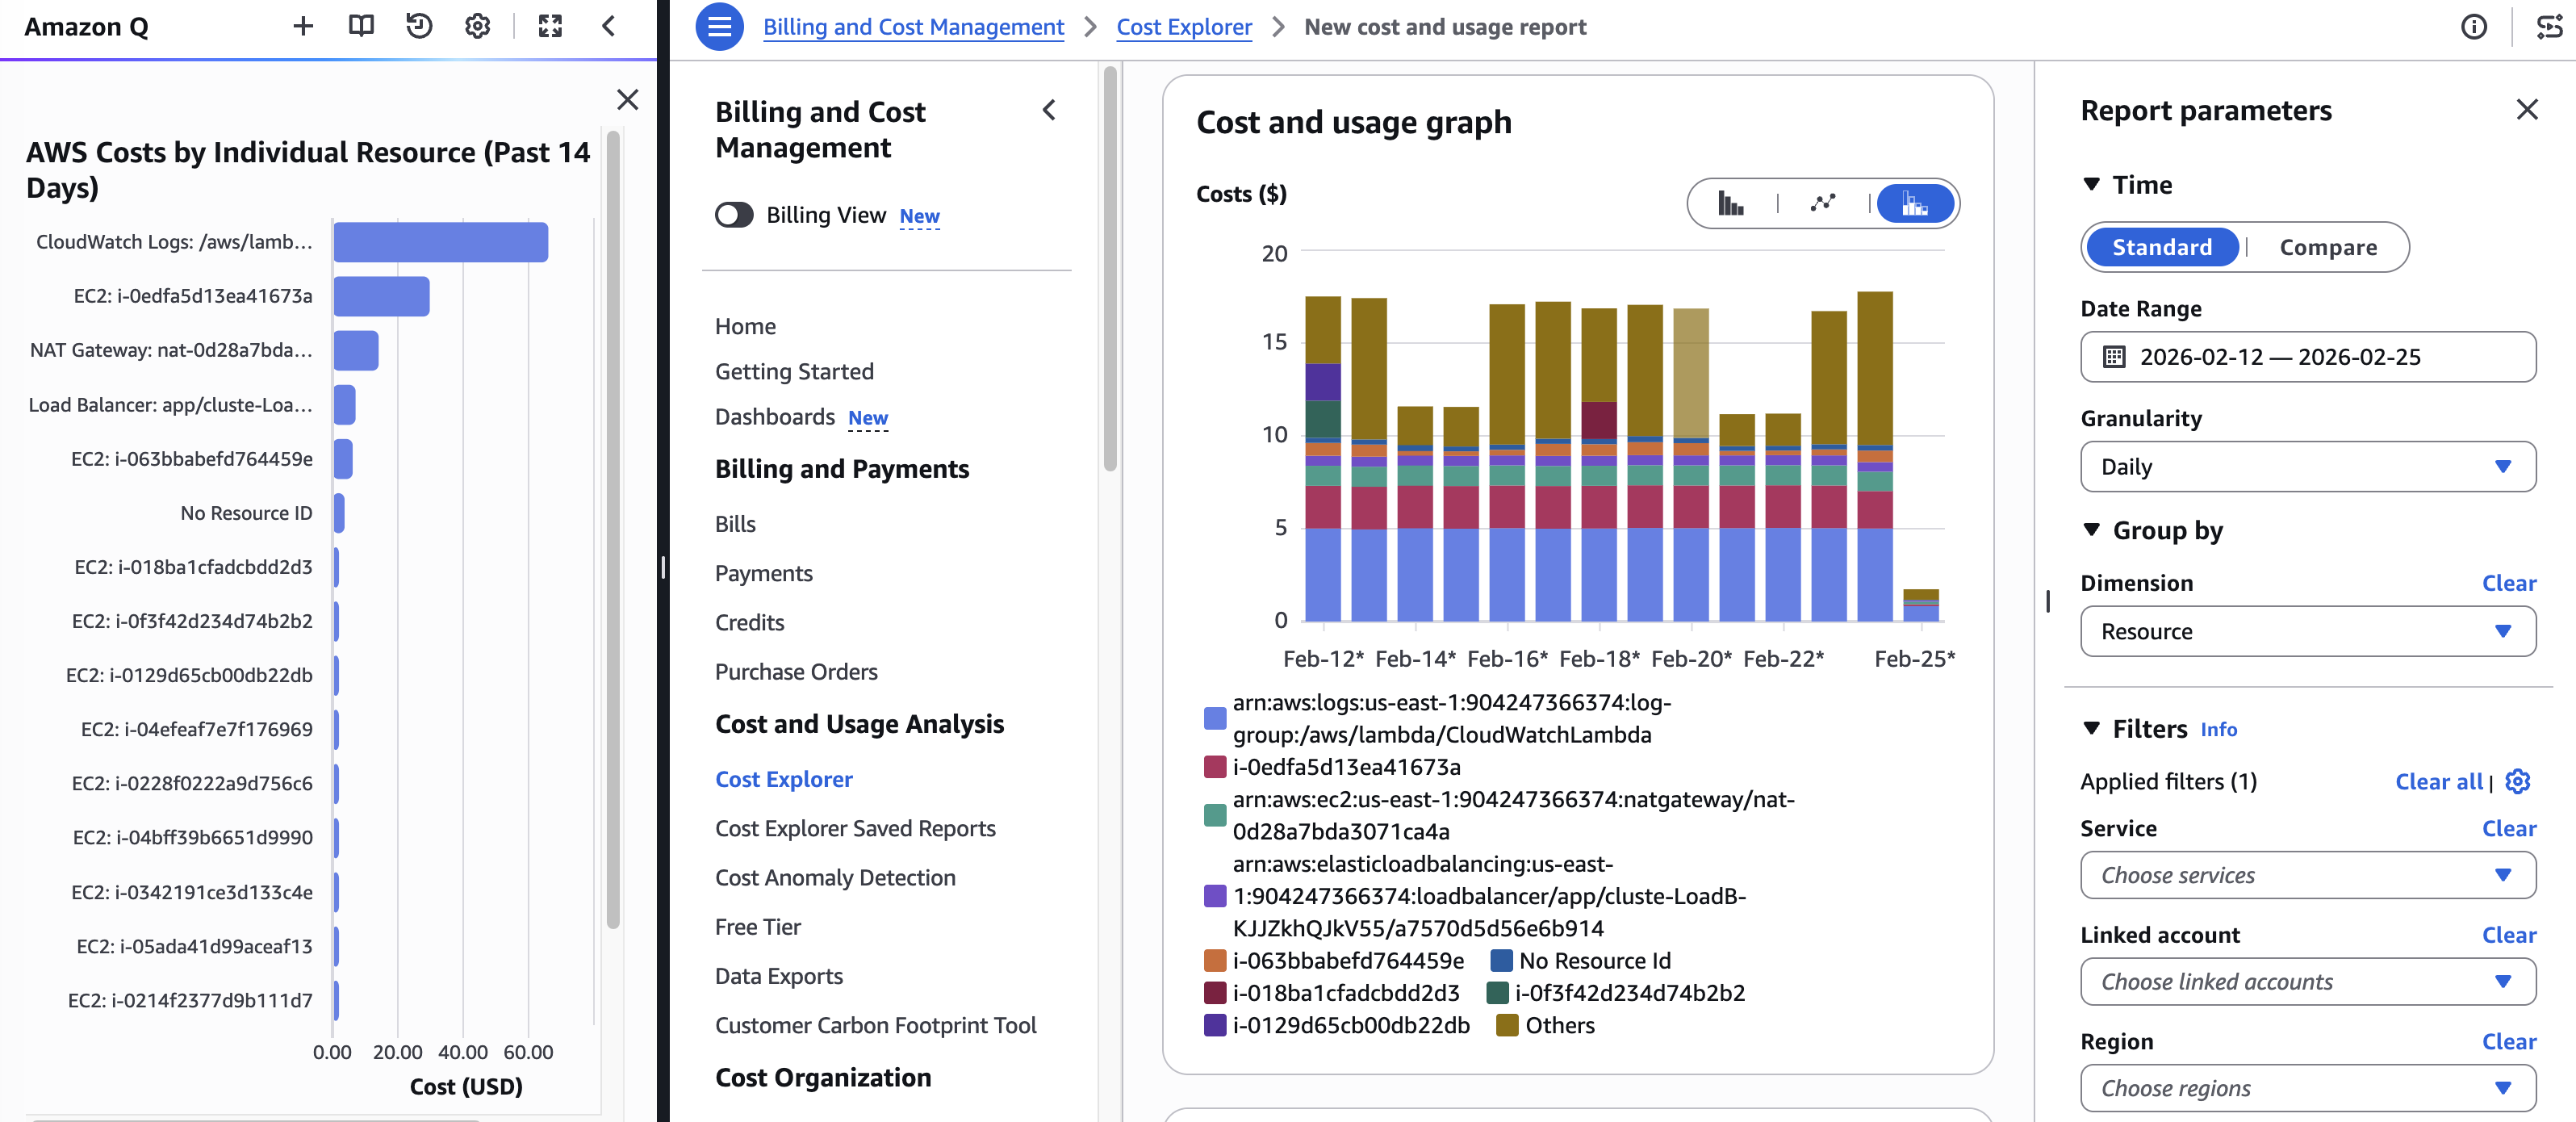
Figure 3 – Example of clicking the ‘View in Cost Explorer’ link
Bringing Cost Awareness to Developers
Addressing cost optimization before resources are even deployed, often called shifting left in FinOps, is one of the most effective ways to manage spend. The new Amazon Q capabilities meet you where work happens. You can log in to the console and use the native Amazon Q features to estimate pricing or ask questions about potential workloads without any configuration or setup. Imagine working on a technical design document and asking Amazon Q to “create an estimated cost based on my current infrastructure.” Amazon Q reads your current architecture, retrieves pricing for services like Amazon Elastic Compute Cloud (Amazon EC2) or Amazon Simple Storage Service (Amazon S3), and provides a detailed cost estimate.
As shown in Figure 4, Amazon Q can also generate a daily spend breakdown by service, giving you a clear picture of where your money is actually going and helping surface patterns you might otherwise miss. For a deeper look, Figure 5 shows how Amazon Q can break down Amazon EC2 costs by instance type by day, making it easy to see exactly which instance families are driving your compute spend over time. You can also use this to perform a what-if analysis. If you want to estimate the cost of moving your workload to Graviton or to serverless, just ask Amazon Q.
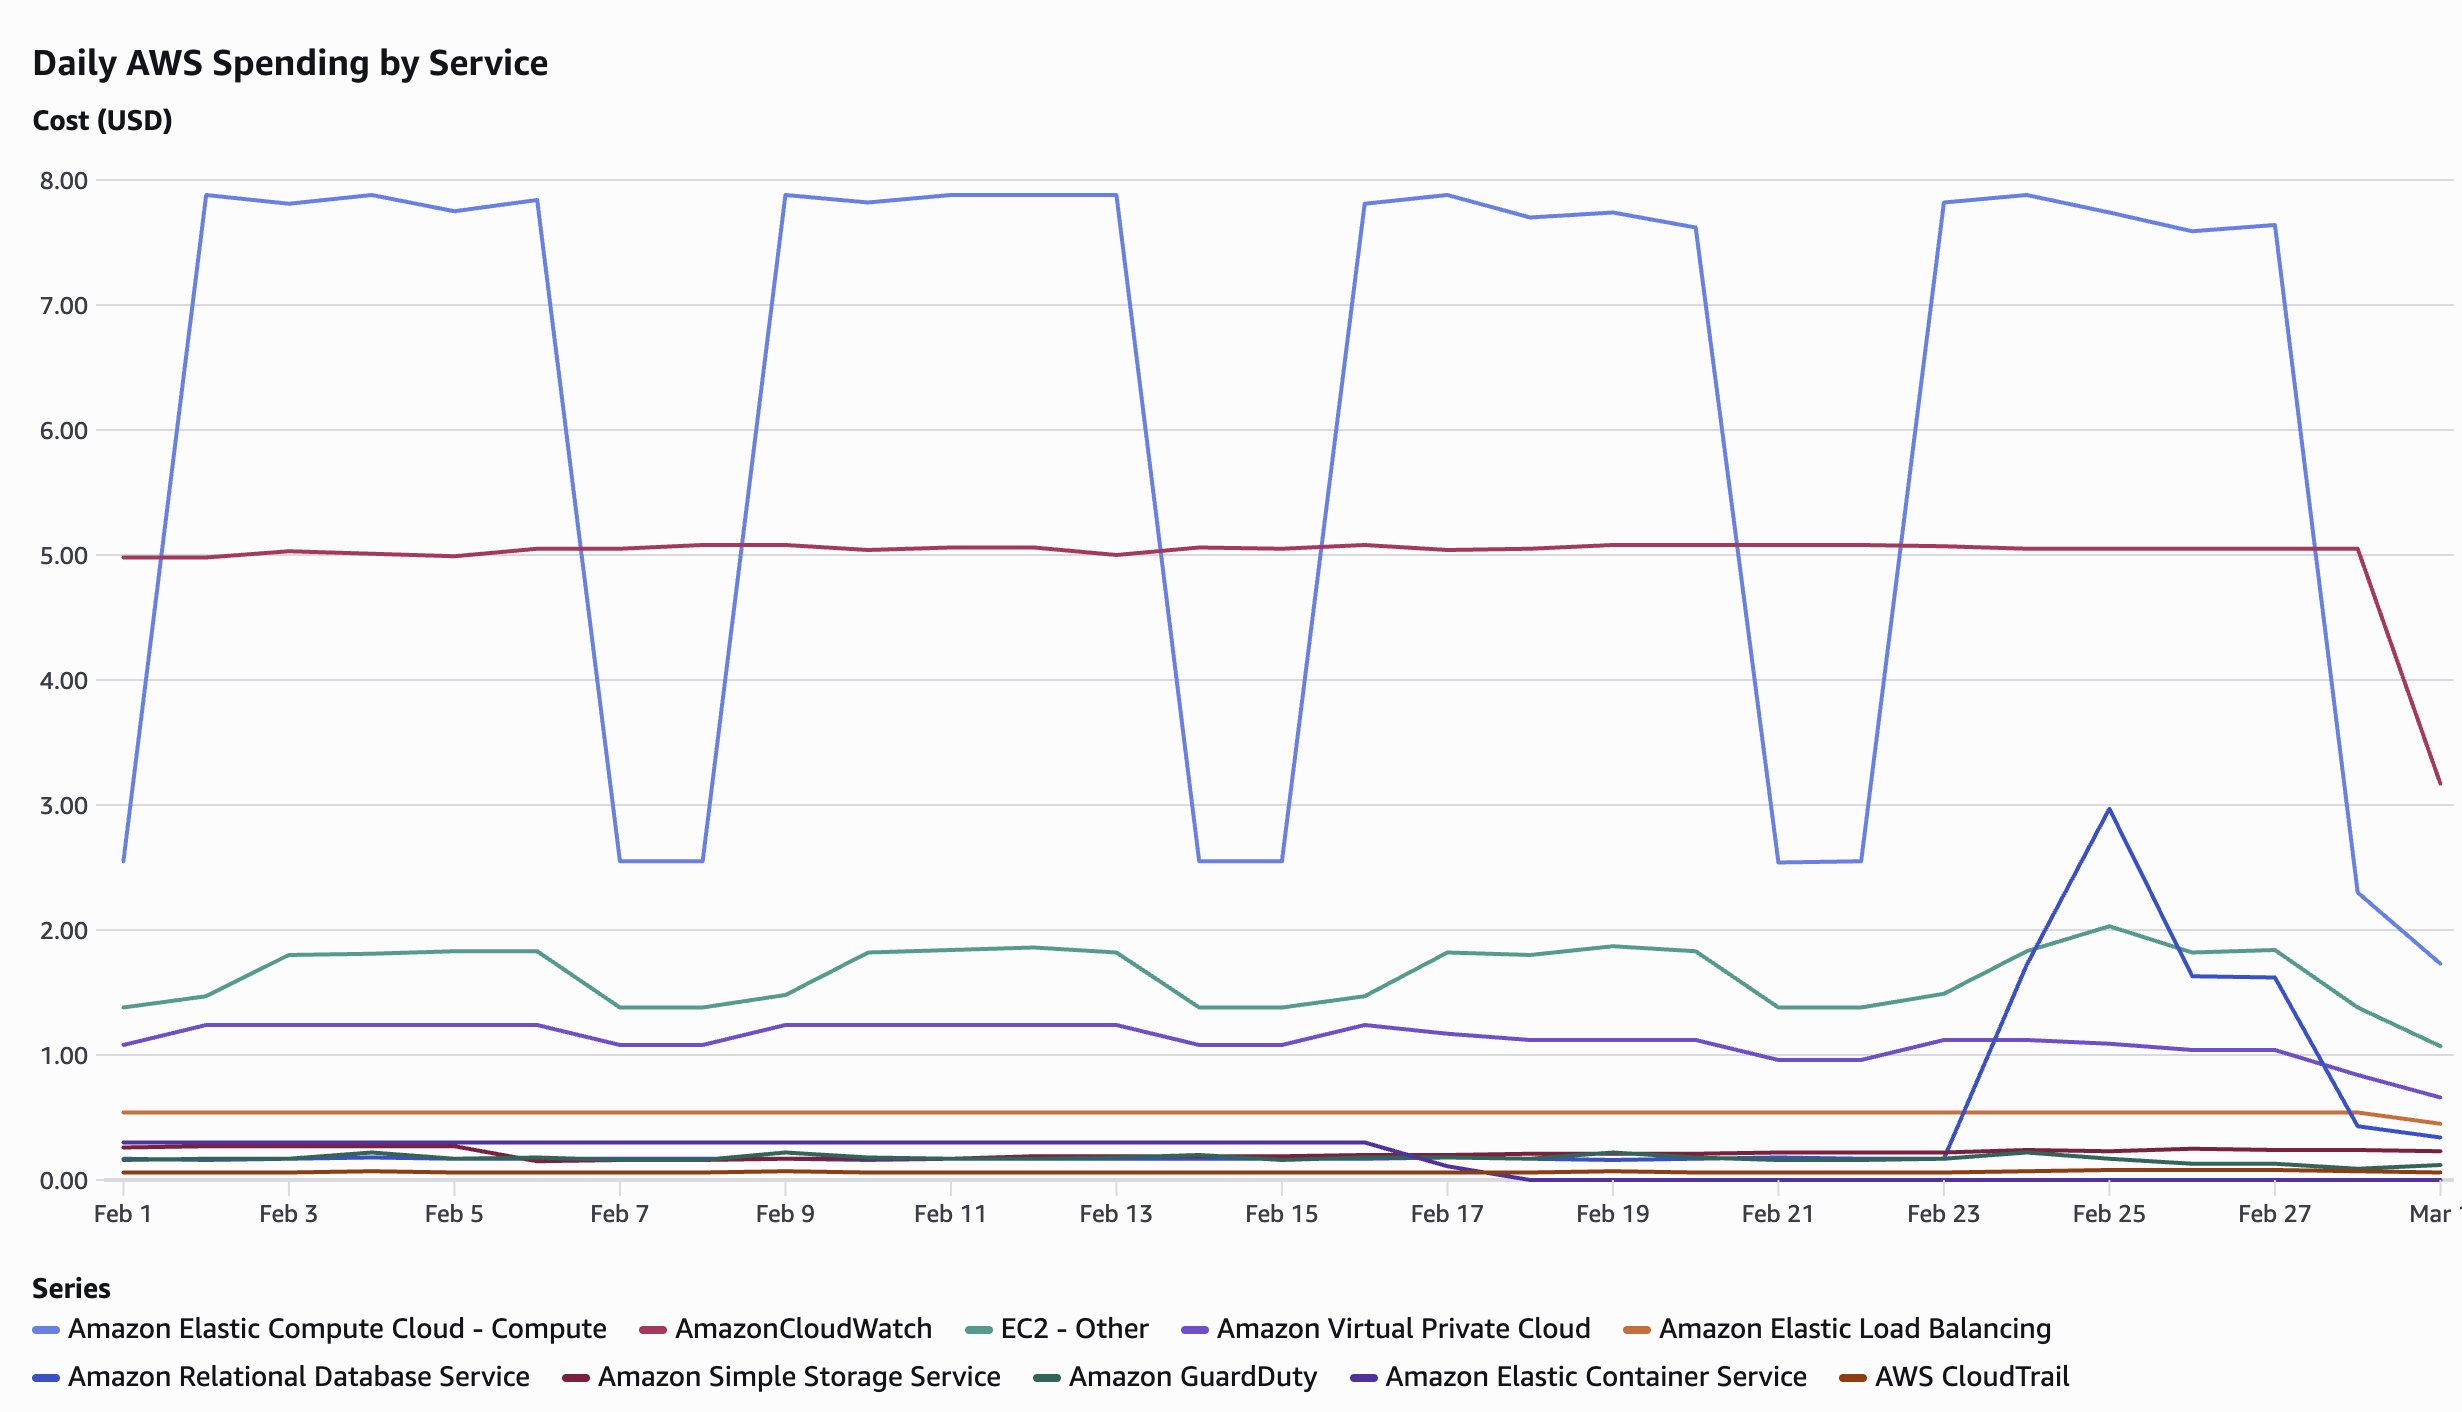
Figure 4 – Amazon Q daily breakdown by service for February 2026. Amazon EC2 Compute averaging $7.88/day on weekdays with a notable drop on weekends, alongside consistent Amazon CloudWatch monitoring costs at $5/day and an RDS spike on February 24–25
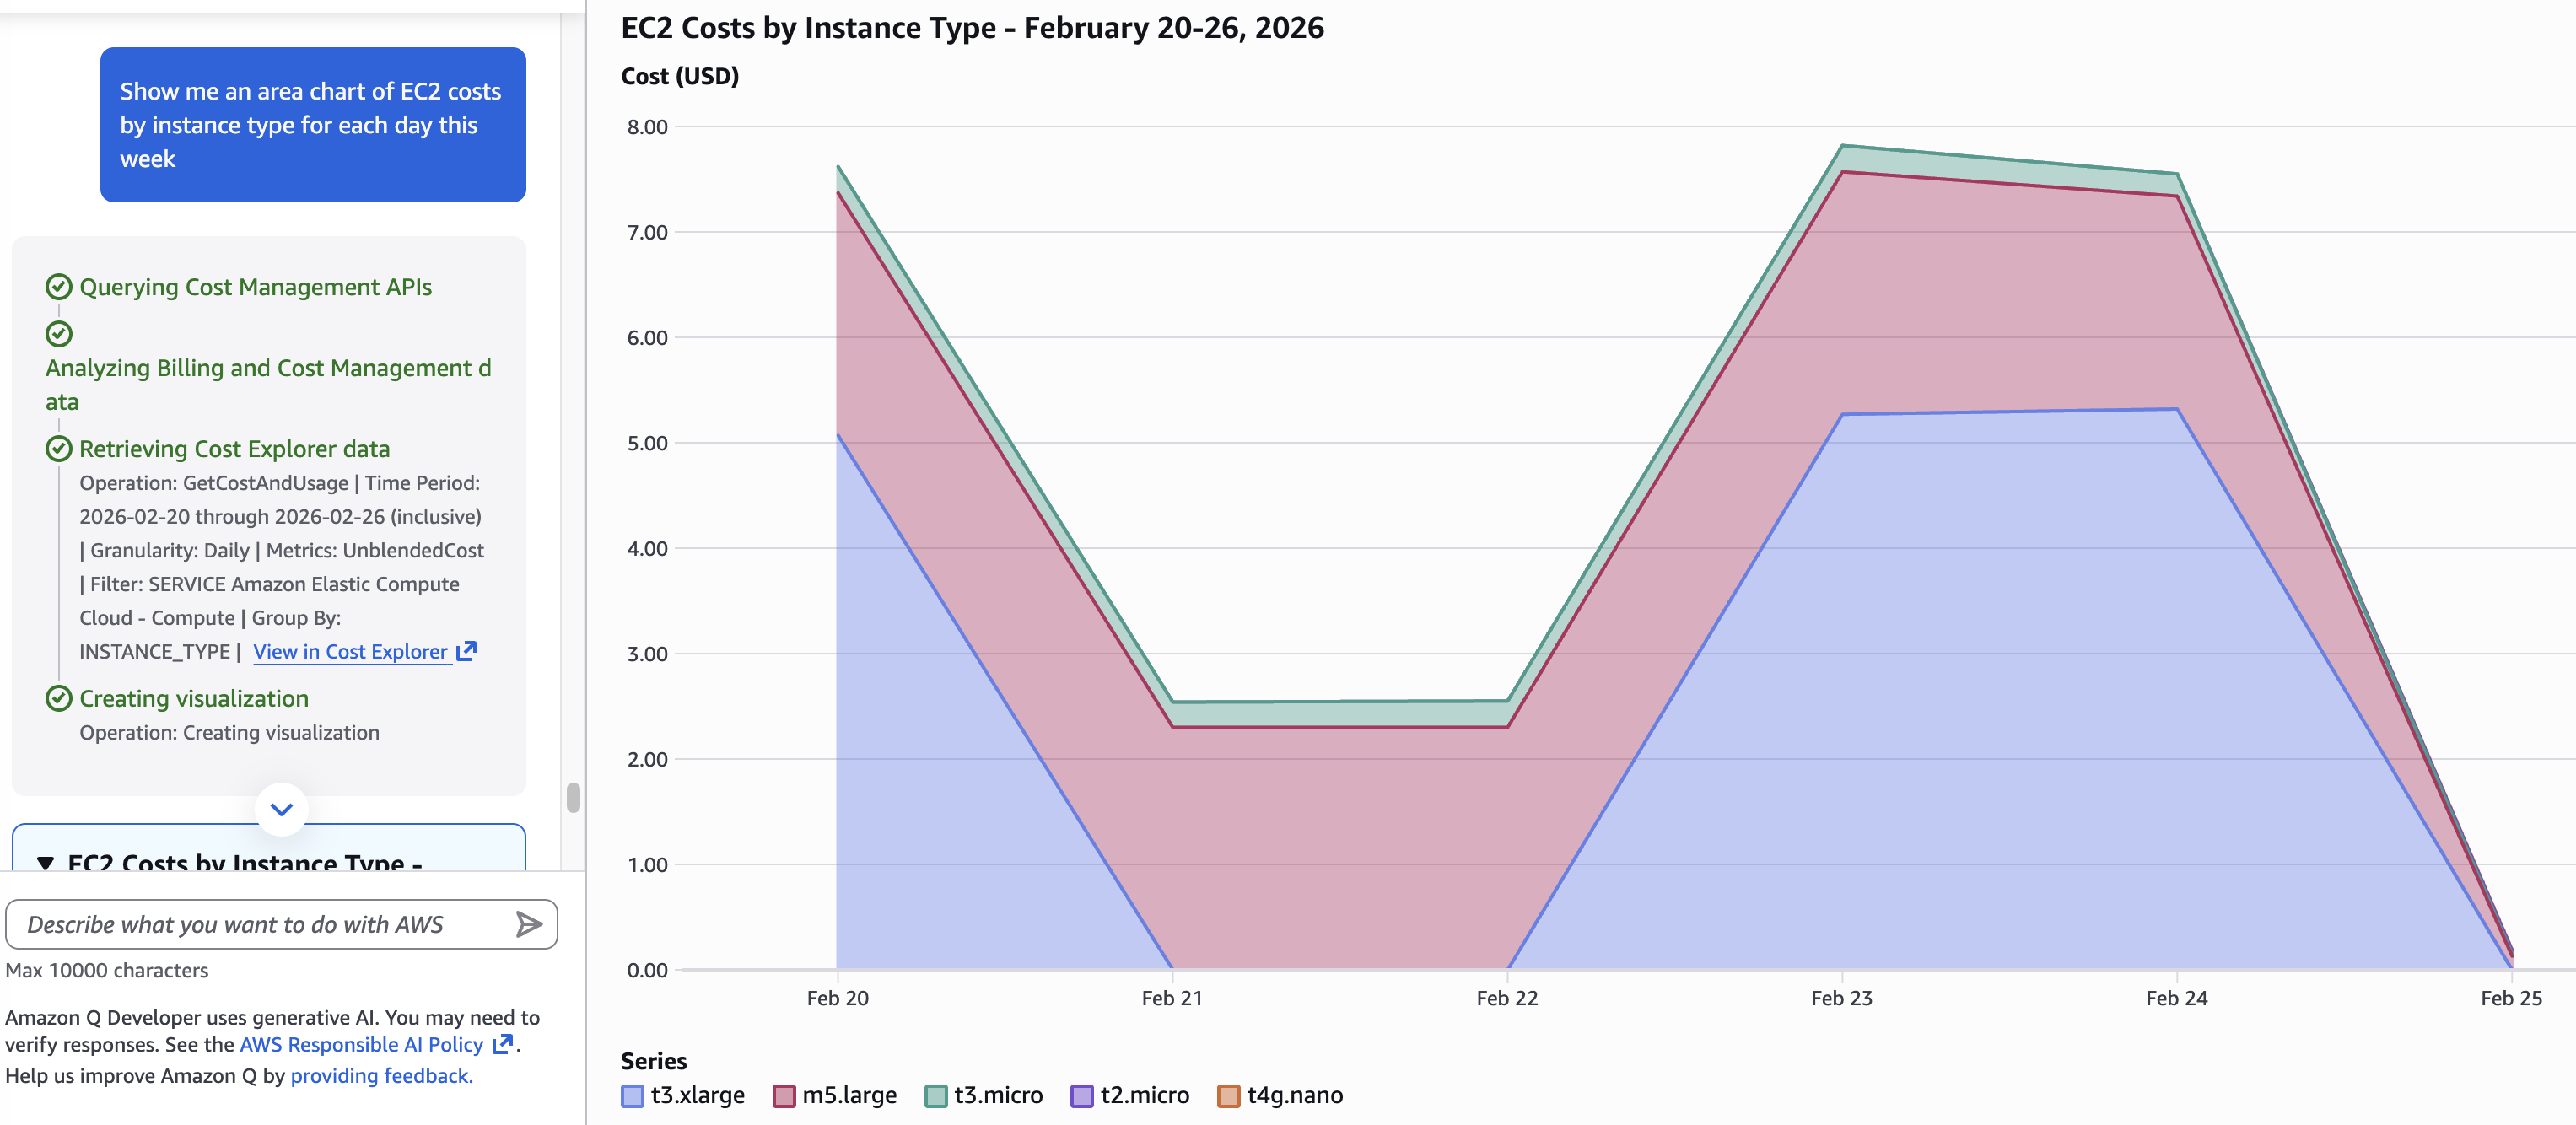
Figure 5 – Amazon Q generating an area chart of EC2 costs broken down by instance type by day for the current month.
A New Visual Experience: Amazon Q Artifacts
Alongside the cost intelligence improvements, Amazon Q now delivers responses enriched with table and chart visualizations called Amazon Q artifacts. The entire console experience has been refreshed.
First, the Amazon Q icon moved to the Unified Navigation bar which is accessible from any page in the console (see Figure 6).

Figure 6 – Q in the Unified Navigation Bar
After clicking the Amazon Q icon, the chat panel will open on the left. The artifact panel will automatically open on the right when a visualization is generated (see Figure 7).
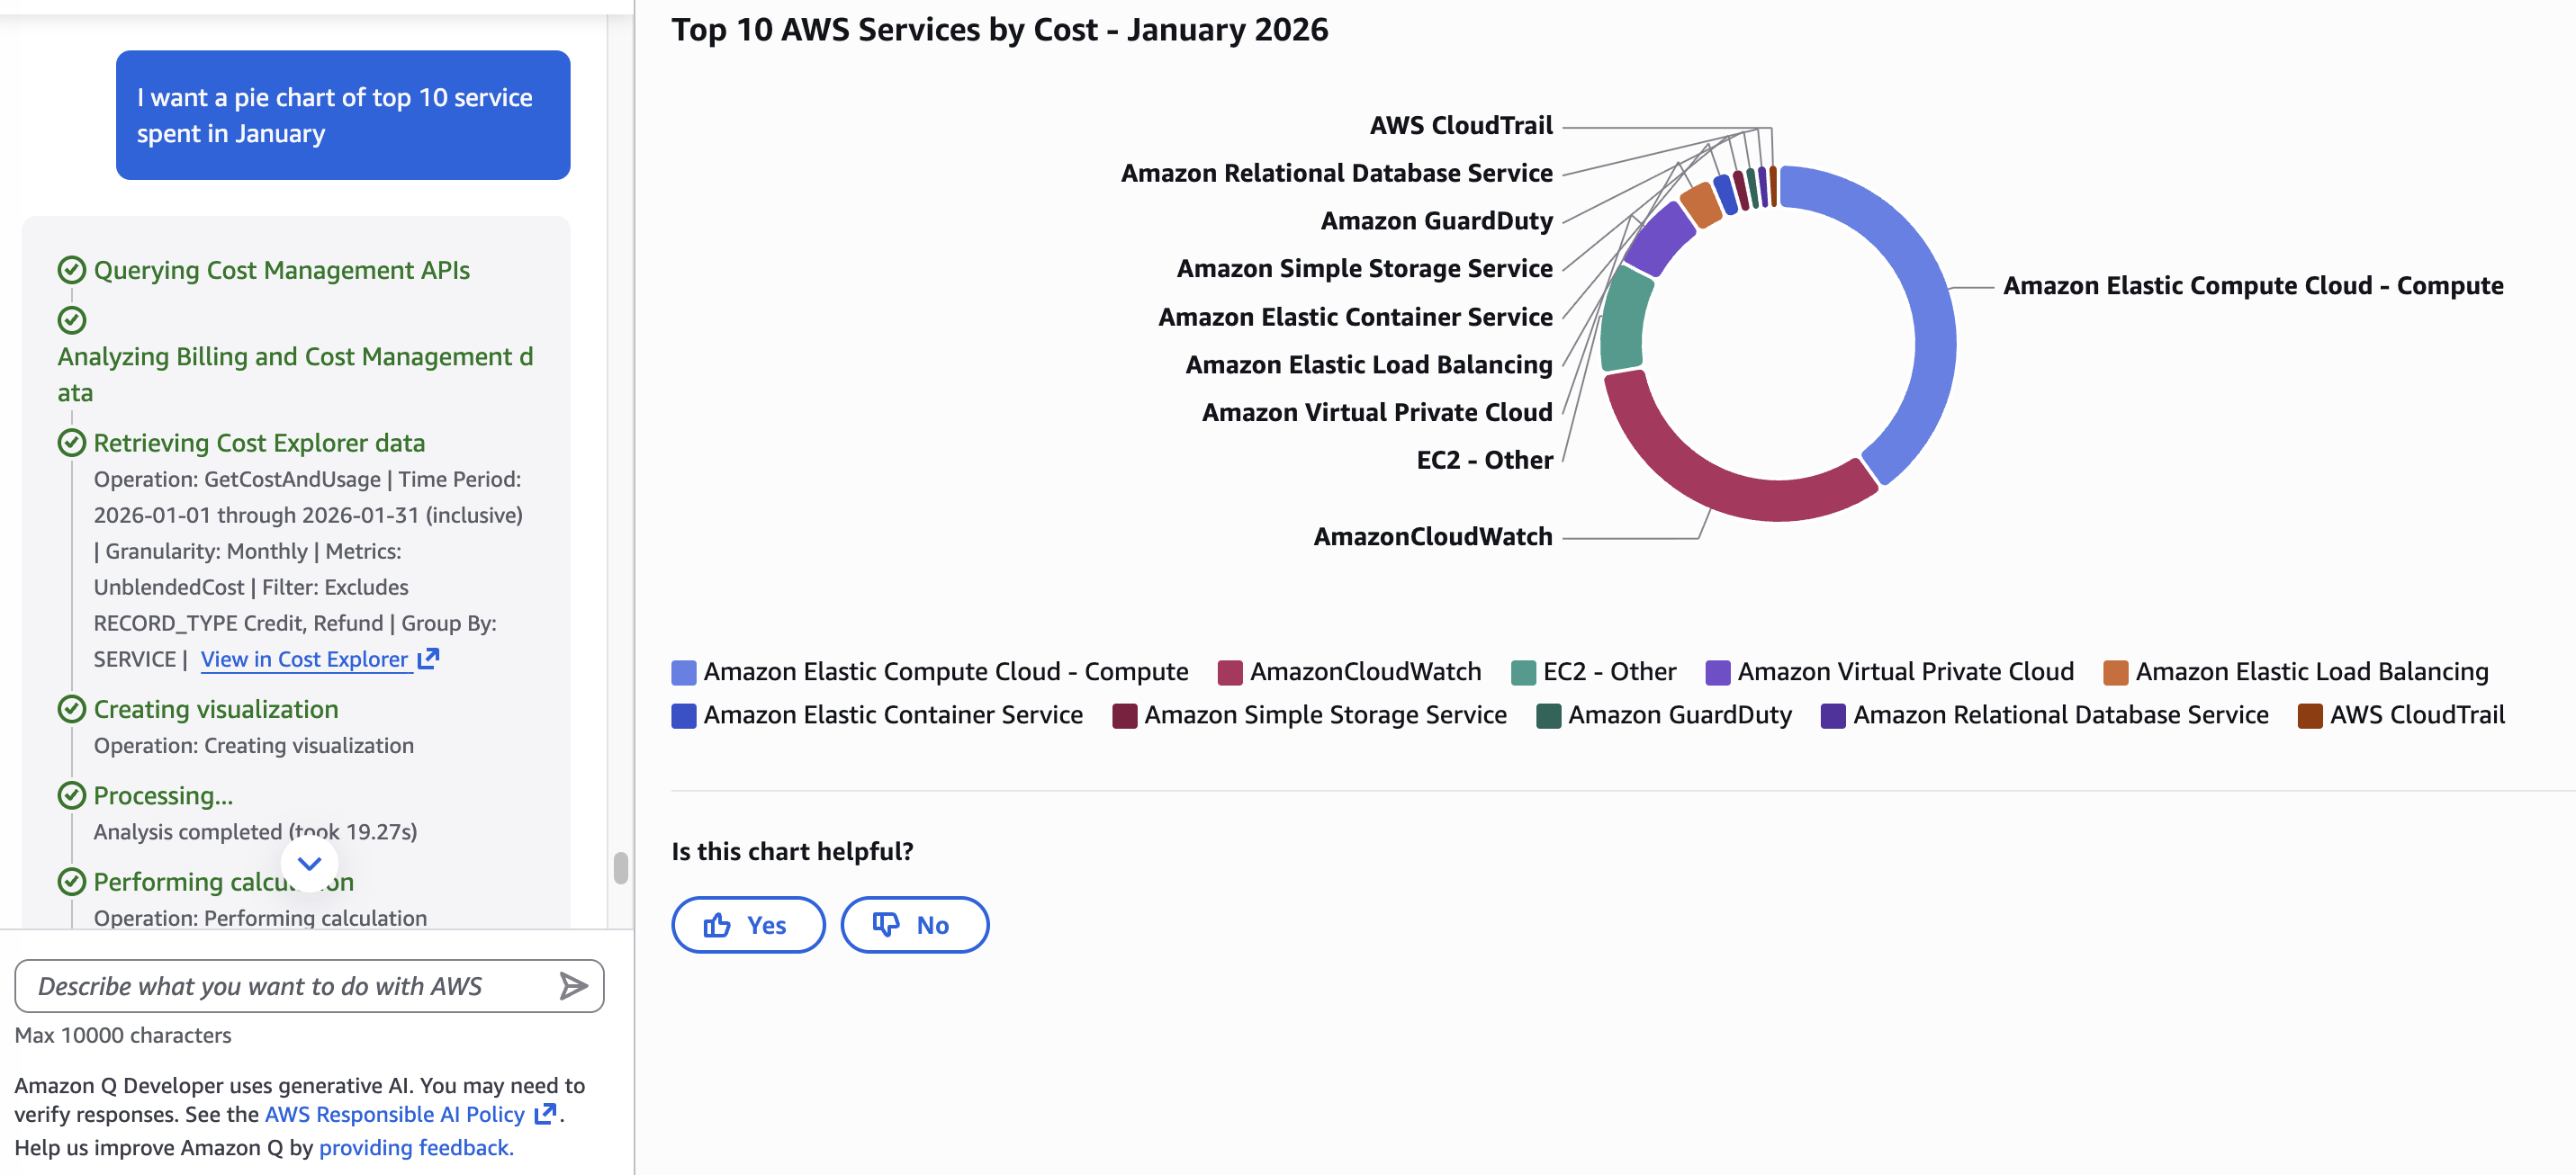
Figure 7 – Amazon Q chat with Artifact Panel
Lastly, you’ll want to focus on the Amazon Q menu bar (see Figure 8).
- Full-screen mode for a dedicated focus experience during cost reviews
- A Prompt Library (book icon, top right) with curated prompts filtered by response type

Figure 8 – Amazon Q menu bar
Resource tables include deep links that take you directly to the resource in its service console so you don’t have to copy resource IDs and navigate manually.
Amazon Q pulls from multiple data sources simultaneously:
- AWS Cost Explorer – historical spending, trends, forecasts
- AWS Cost Optimization Hub – actionable savings recommendations
- AWS Compute Optimizer – over-provisioned resource identification
- Savings Plans & Reserved Instance data – coverage and utilization
- AWS Pricing APIs – real-time public pricing across all services and regions
Going Further: More Ways to Visualize Your Costs
The examples in this post are just a starting point. Amazon Q supports a wide range of cost visualizations, and the best way to discover what’s possible is to start asking questions. Whether you’re investigating a spike, planning a budget conversation, or tracking the impact of a recent optimization, there’s likely a chart that can help.
Here are some example prompts for FinOps functions:
Forecasting and budget planning
- “Show cost forecast for next billing period” – get a forward-looking view to support budget conversations before the month closes (Figure 9)
- “Graph my projected total spend for the next 90 days” – visualize the spend trajectory and spot potential overruns early
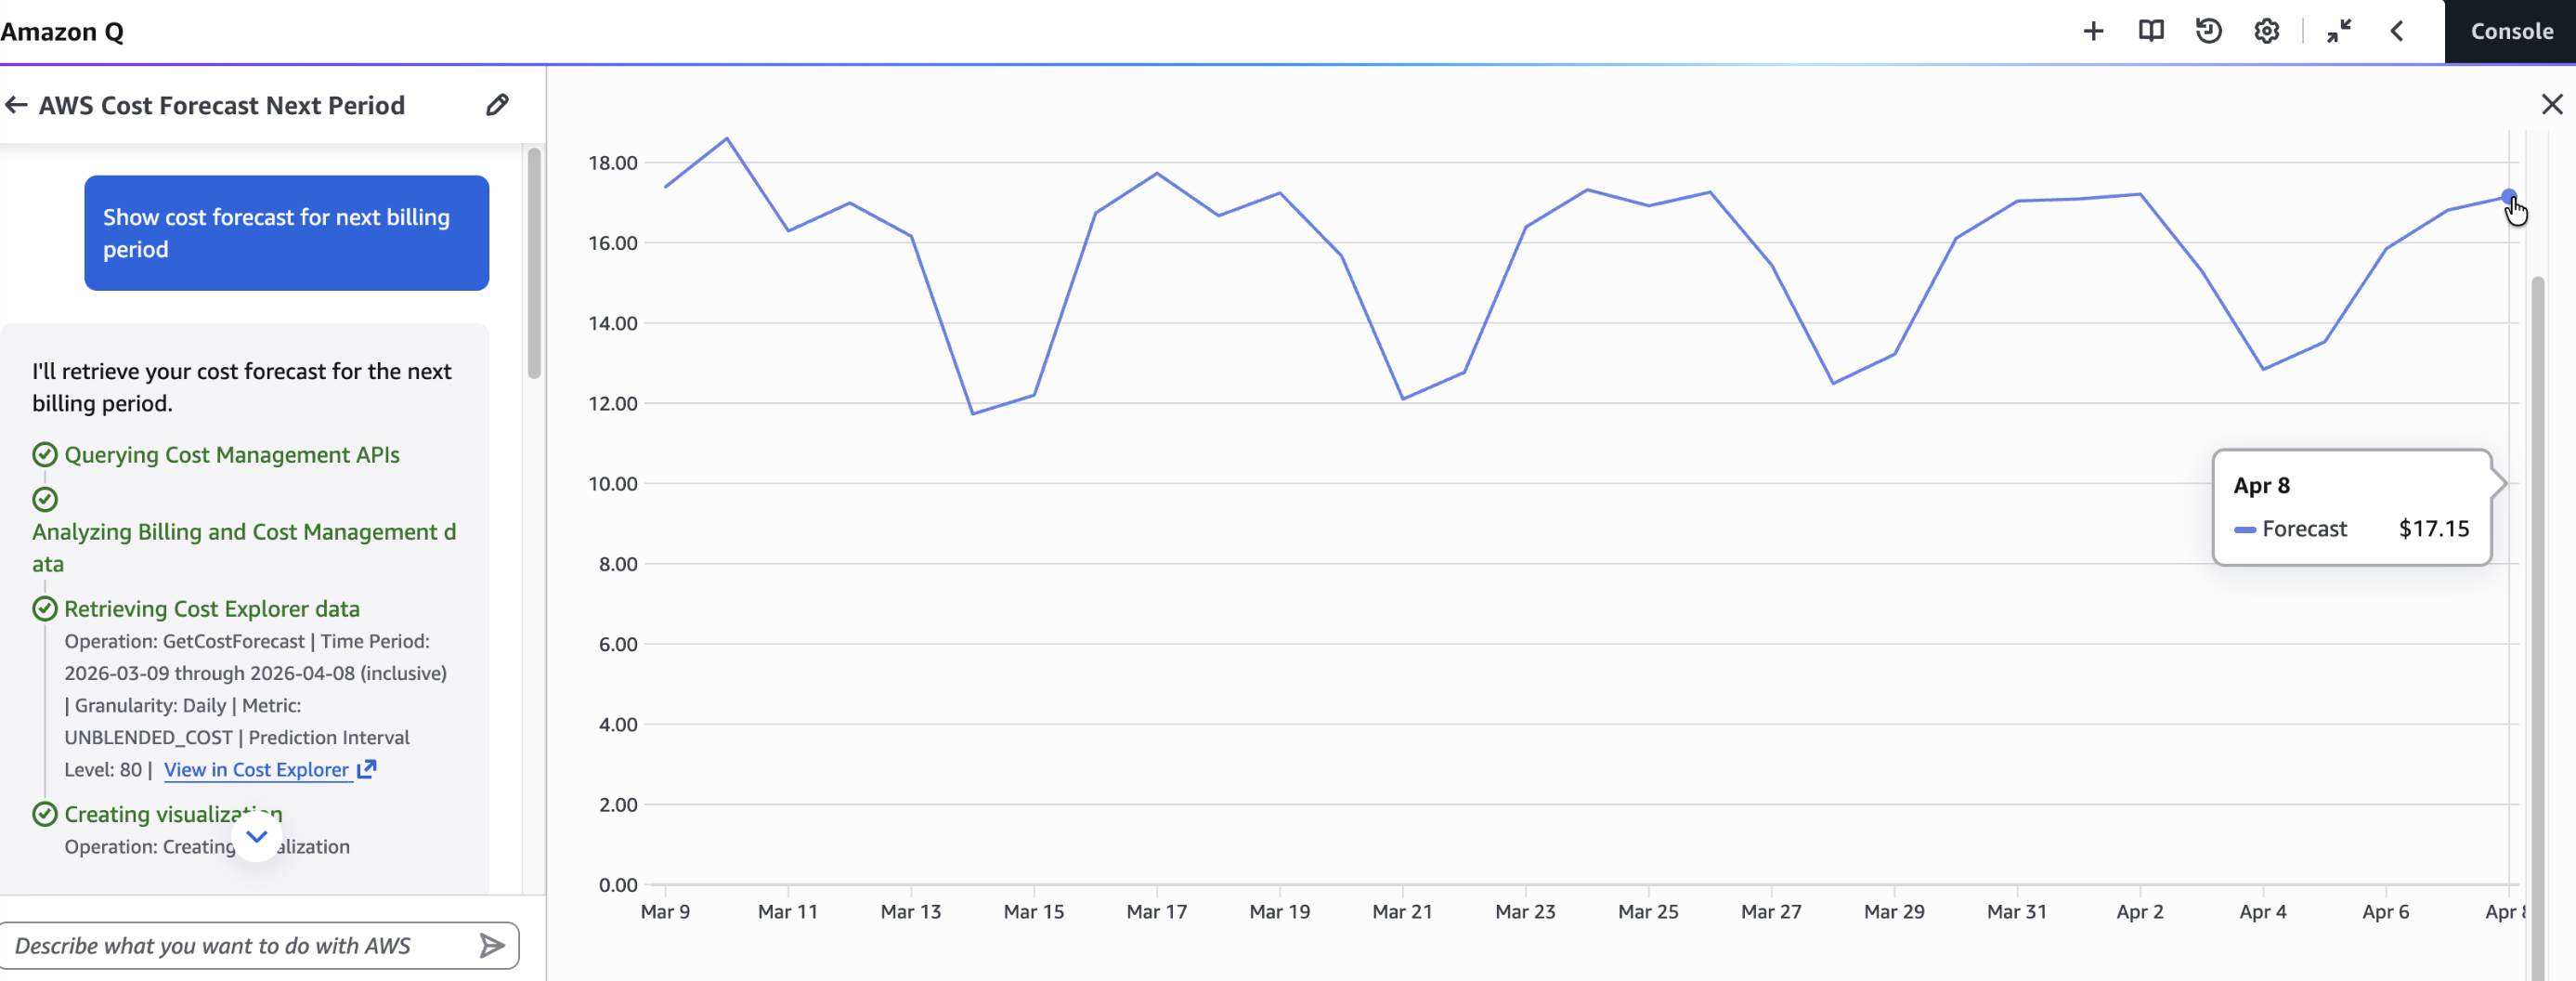
Figure 9 – Show cost forecast for next billing period
Commitment coverage
- “Line chart of Savings Plans coverage in blue and utilization rate in red over the last 3 months” – track whether your commitments are working as expected and assign a color to your KPI (see Figure 10)
- “Graph my Reserved Instance utilization by service for the last 6 months” – identify underused reservations before they expire
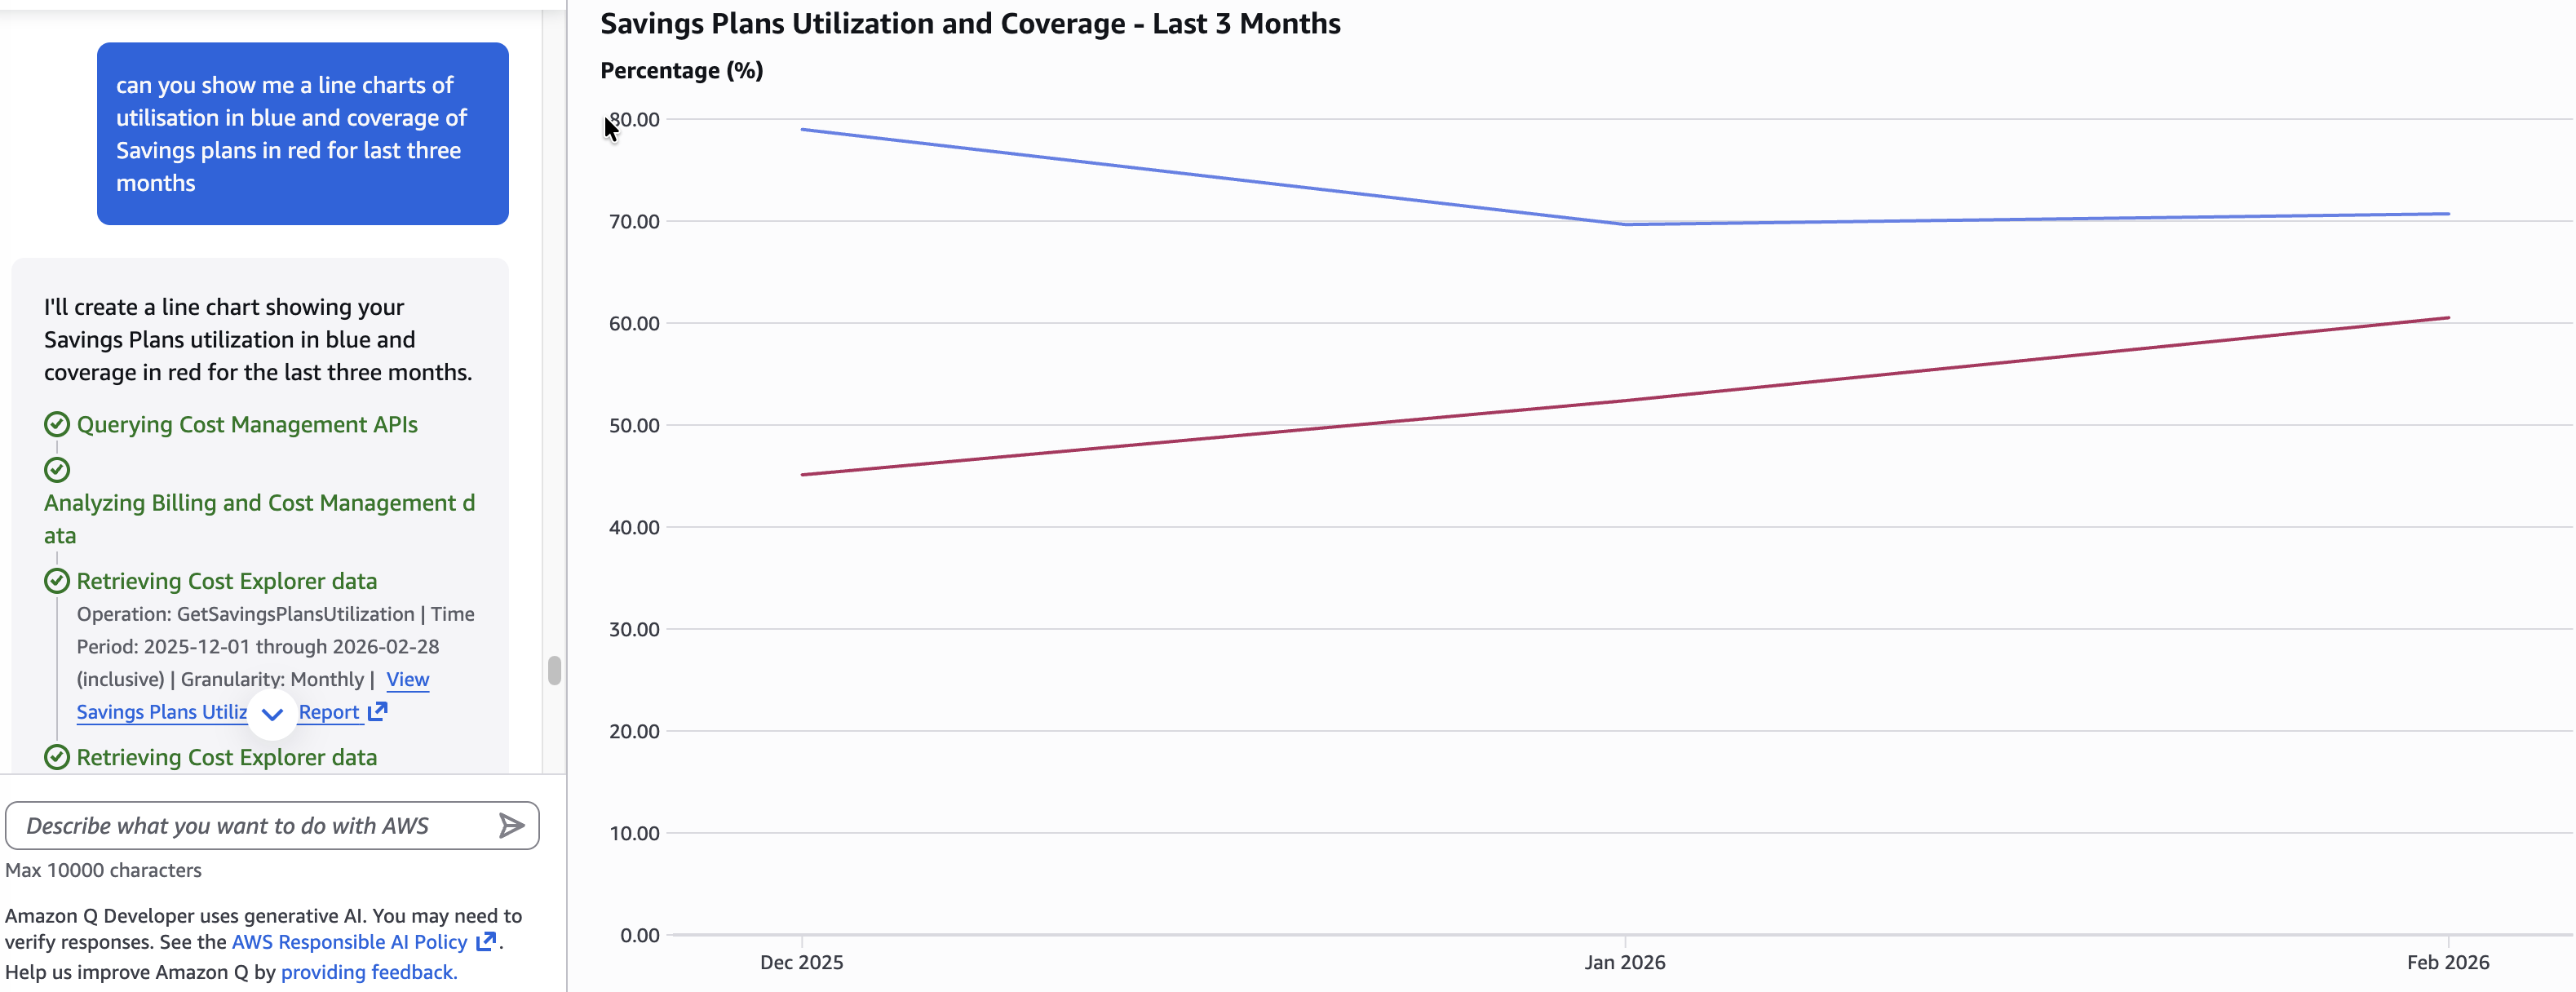
Figure 10 – Utilization and Coverage Rate of Savings Plans in the last three months
Service and resource deep dives
- “Graph RDS costs by instance type by month for the last 6 months” – understand database spend patterns across instance families
- “Graph my DynamoDB costs by region by day for the last 30 days” – surface regional DynamoDB spend trends
- “Pie chart of EC2-Other costs last month” – break down ancillary compute charges like EBS, data transfer, and Elastic IPs
- “Visualize last month’s data transfer costs” – find egress charges that are often hidden in aggregate views
You don’t need to start from scratch. The Amazon Q Prompt Library, accessible via the book icon in the Amazon Q panel, includes 23 curated prompts in the Cloud Financial Management category covering Q&A, Visualization, and Workflow response types. Filter by category, pick a prompt, and adapt it to your context. It’s the fastest way to go from a blank chat to a meaningful cost insight (see Figure 11).
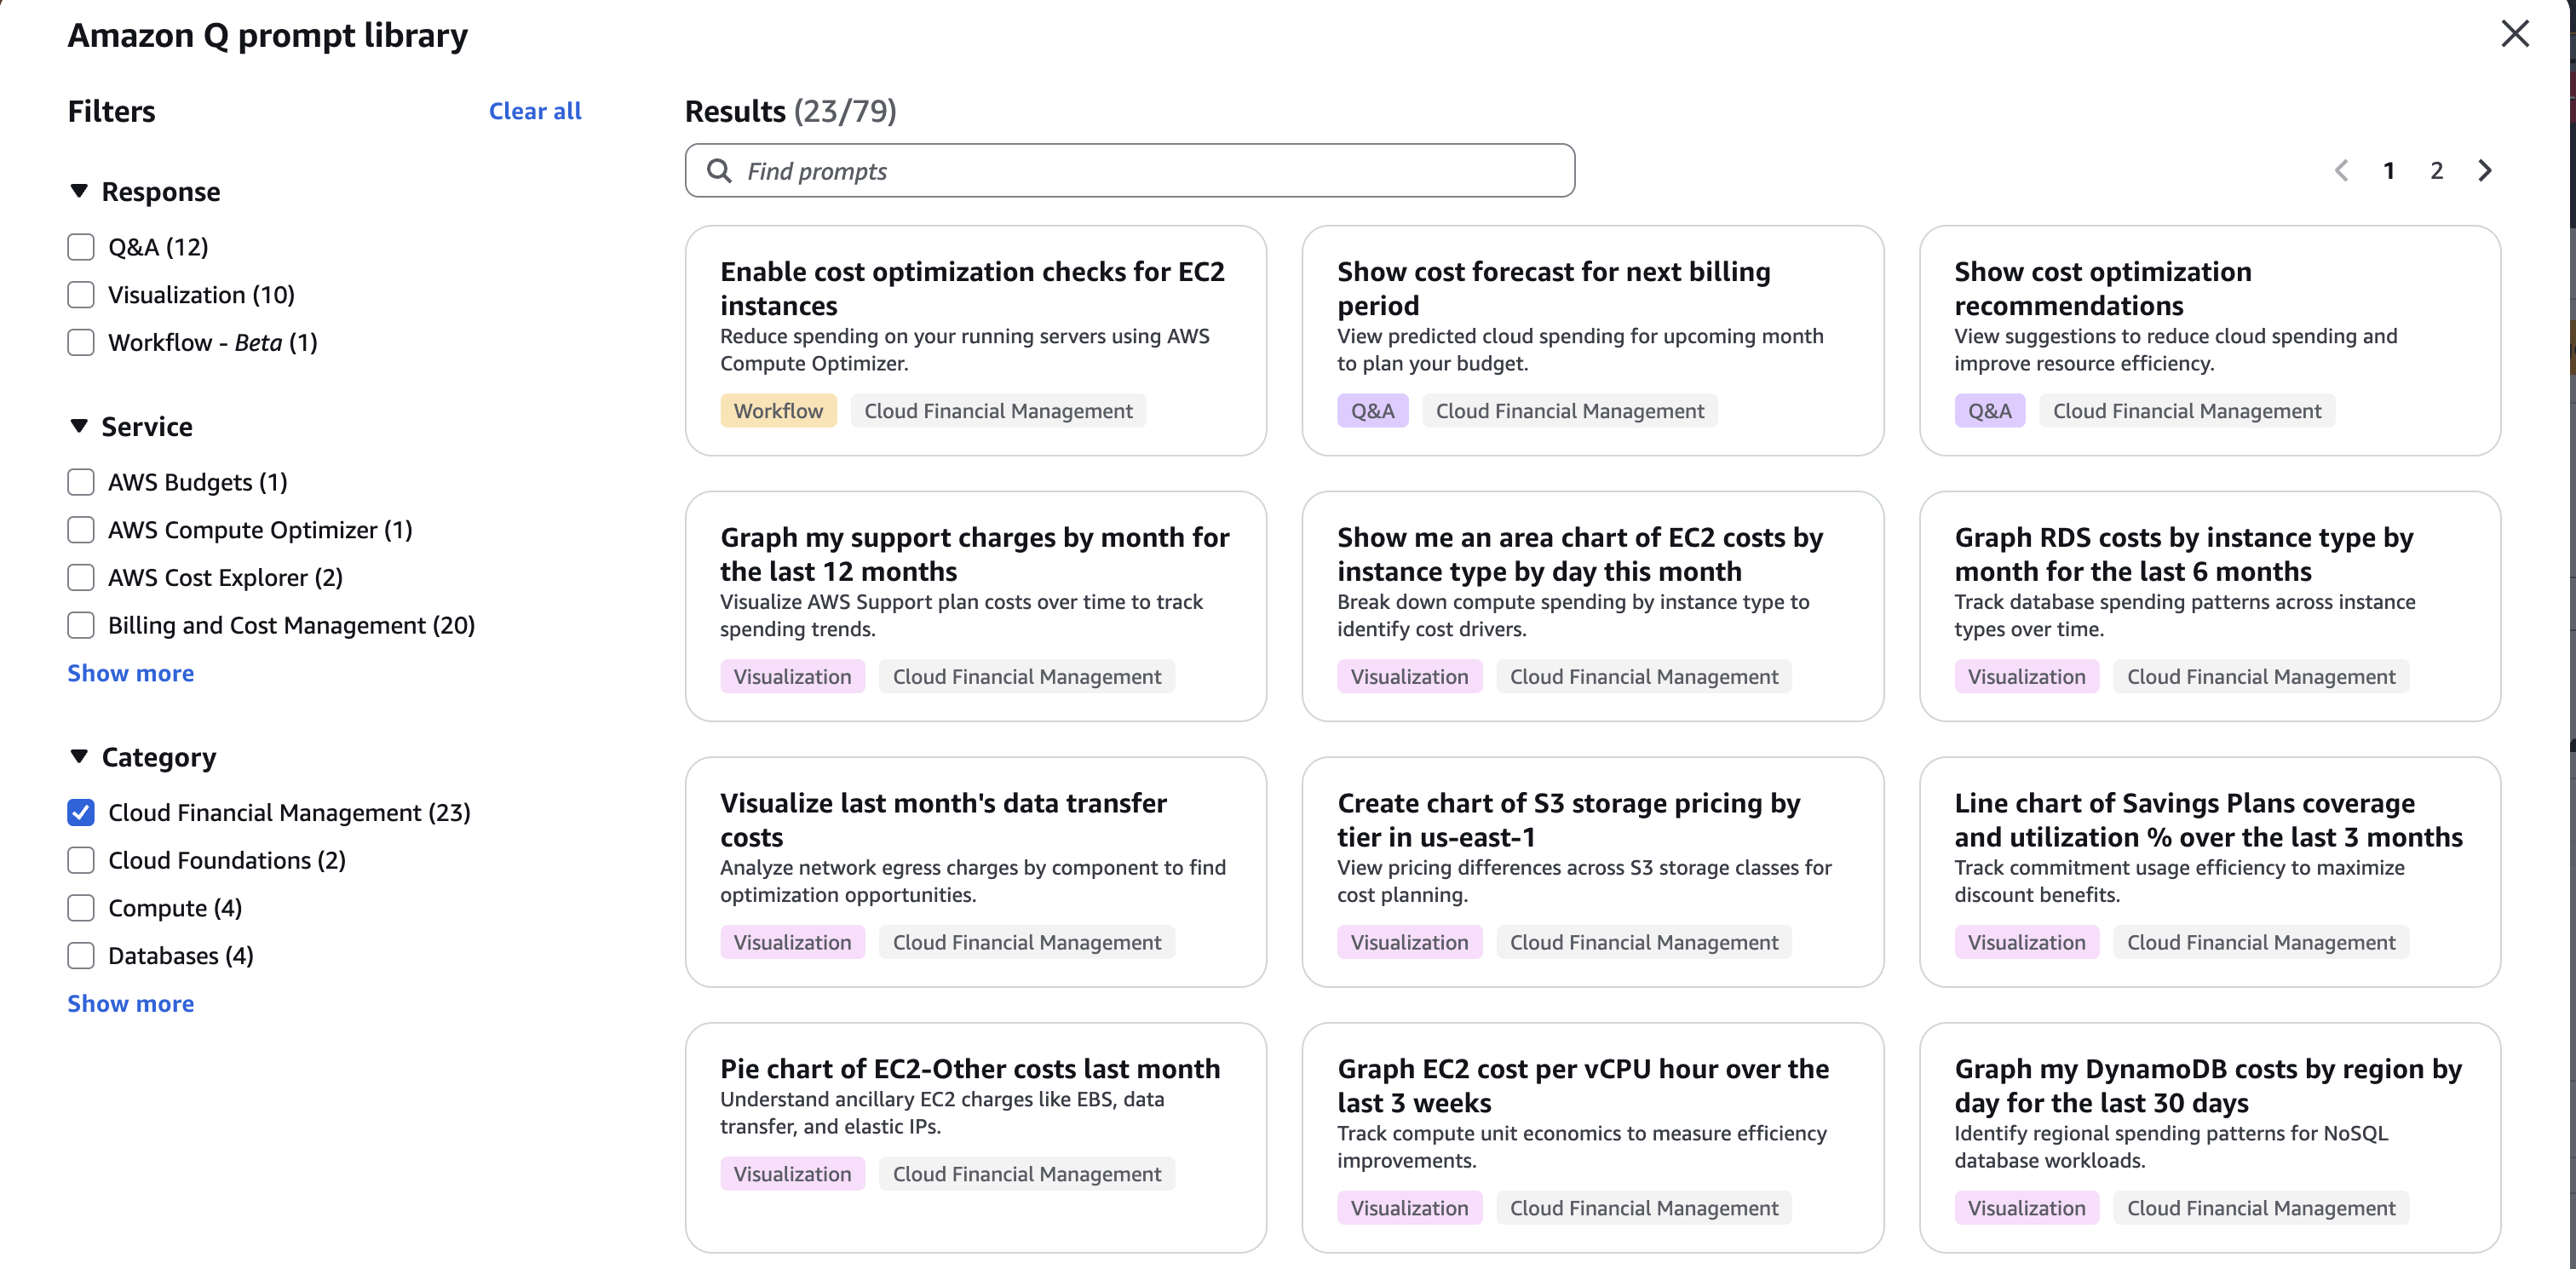
Figure 11 – Amazon Q prompt library
Conclusion
The goal of these new features is simple: spend less time managing data and more time driving business value. With Amazon Q now embedded directly in the AWS Console, cost management becomes a seamless part of your daily operations.
Whether you’re investigating your EC2 cost per hour, generating a daily spend breakdown by service, breaking down EC2 costs by instance type, or estimating what a migration to Graviton would save, Amazon Q gives you the answers you need without the overhead.
FinOps has always been about making better decisions with financial data. Amazon Q doesn’t change that goal, it makes it easier and more accessible. Data and answers are just one question away, get started with Amazon Q today.