AWS News Blog
Amazon CloudWatch introduces unified data management and analytics for operations, security, and compliance

|
Today we’re expanding Amazon CloudWatch capabilities to unify and manage log data across operational, security, and compliance use cases with flexible and powerful analytics in one place and with reduced data duplication and costs.
This enhancement means that CloudWatch can automatically normalize and process data to offer consistency across sources with built-in support for Open Cybersecurity Schema Framework (OCSF) and Open Telemetry (OTel) formats, so you can focus on analytics and insights. CloudWatch also introduces Apache Iceberg compatible access to your data through Amazon Simple Storage Service (Amazon S3) Tables, so that you can run analytics, not only locally but also using Amazon Athena, Amazon SageMaker Unified Studio, or any other Iceberg-compatible tool.
You can also correlate your operational data in CloudWatch with other business data from your preferred tools to correlate with other data. This unified approach streamlines management and provides comprehensive correlation across security, operational, and business use cases.
Here are the detailed enhancements:
- Streamline data ingestion and normalization – CloudWatch automatically collects AWS vended logs across accounts and AWS Regions, integrating with AWS Organizations from AWS services including AWS CloudTrail, Amazon Virtual Private Cloud (Amazon VPC) Flow Logs, AWS WAF access logs, Amazon Route 53 resolver logs, and pre-built connectors for third-party sources such as endpoint (CrowdStrike, SentinelOne), identity (Okta, Entra ID), cloud security (Wiz), network security (Zscaler, Palo Alto Networks), productivity and collaboration (Microsoft Office 365, Windows Event Logs, and GitHub), along with IT service manager with ServiceNow CMDB. To normalize and process your data as they are being ingested, CloudWatch offers managed OCSF conversion for various AWS and third-party data sources and other processors such as Grok for custom parsing, field-level operations, and string manipulations.
- Reduce costly log data management – CloudWatch consolidates log management into a single service with built-in governance capabilities without storing and maintaining multiple copies of the same data across different tools and data stores. The unified data store of CloudWatch eliminates the need for complex ETL pipelines and reduces your operational costs and management overhead needed to maintain multiple separate data stores and tools.
- Discover business insights from log data – You can run queries in CloudWatch using natural language queries and popular query languages such as LogsQL, PPL, and SQL through a single interface, or query your data using your preferred analytics tools through Apache Iceberg-compatible tables. The new Facets interface gives you intuitive filtering by source, application, account, region, and log type, which you can use to run queries across log groups of multiple AWS accounts and Regions with intelligent parameter inference.
In the next sections we explore the new log management and analytics features of the CloudWatch Logs!
1. Data discovery and management by data sources and types
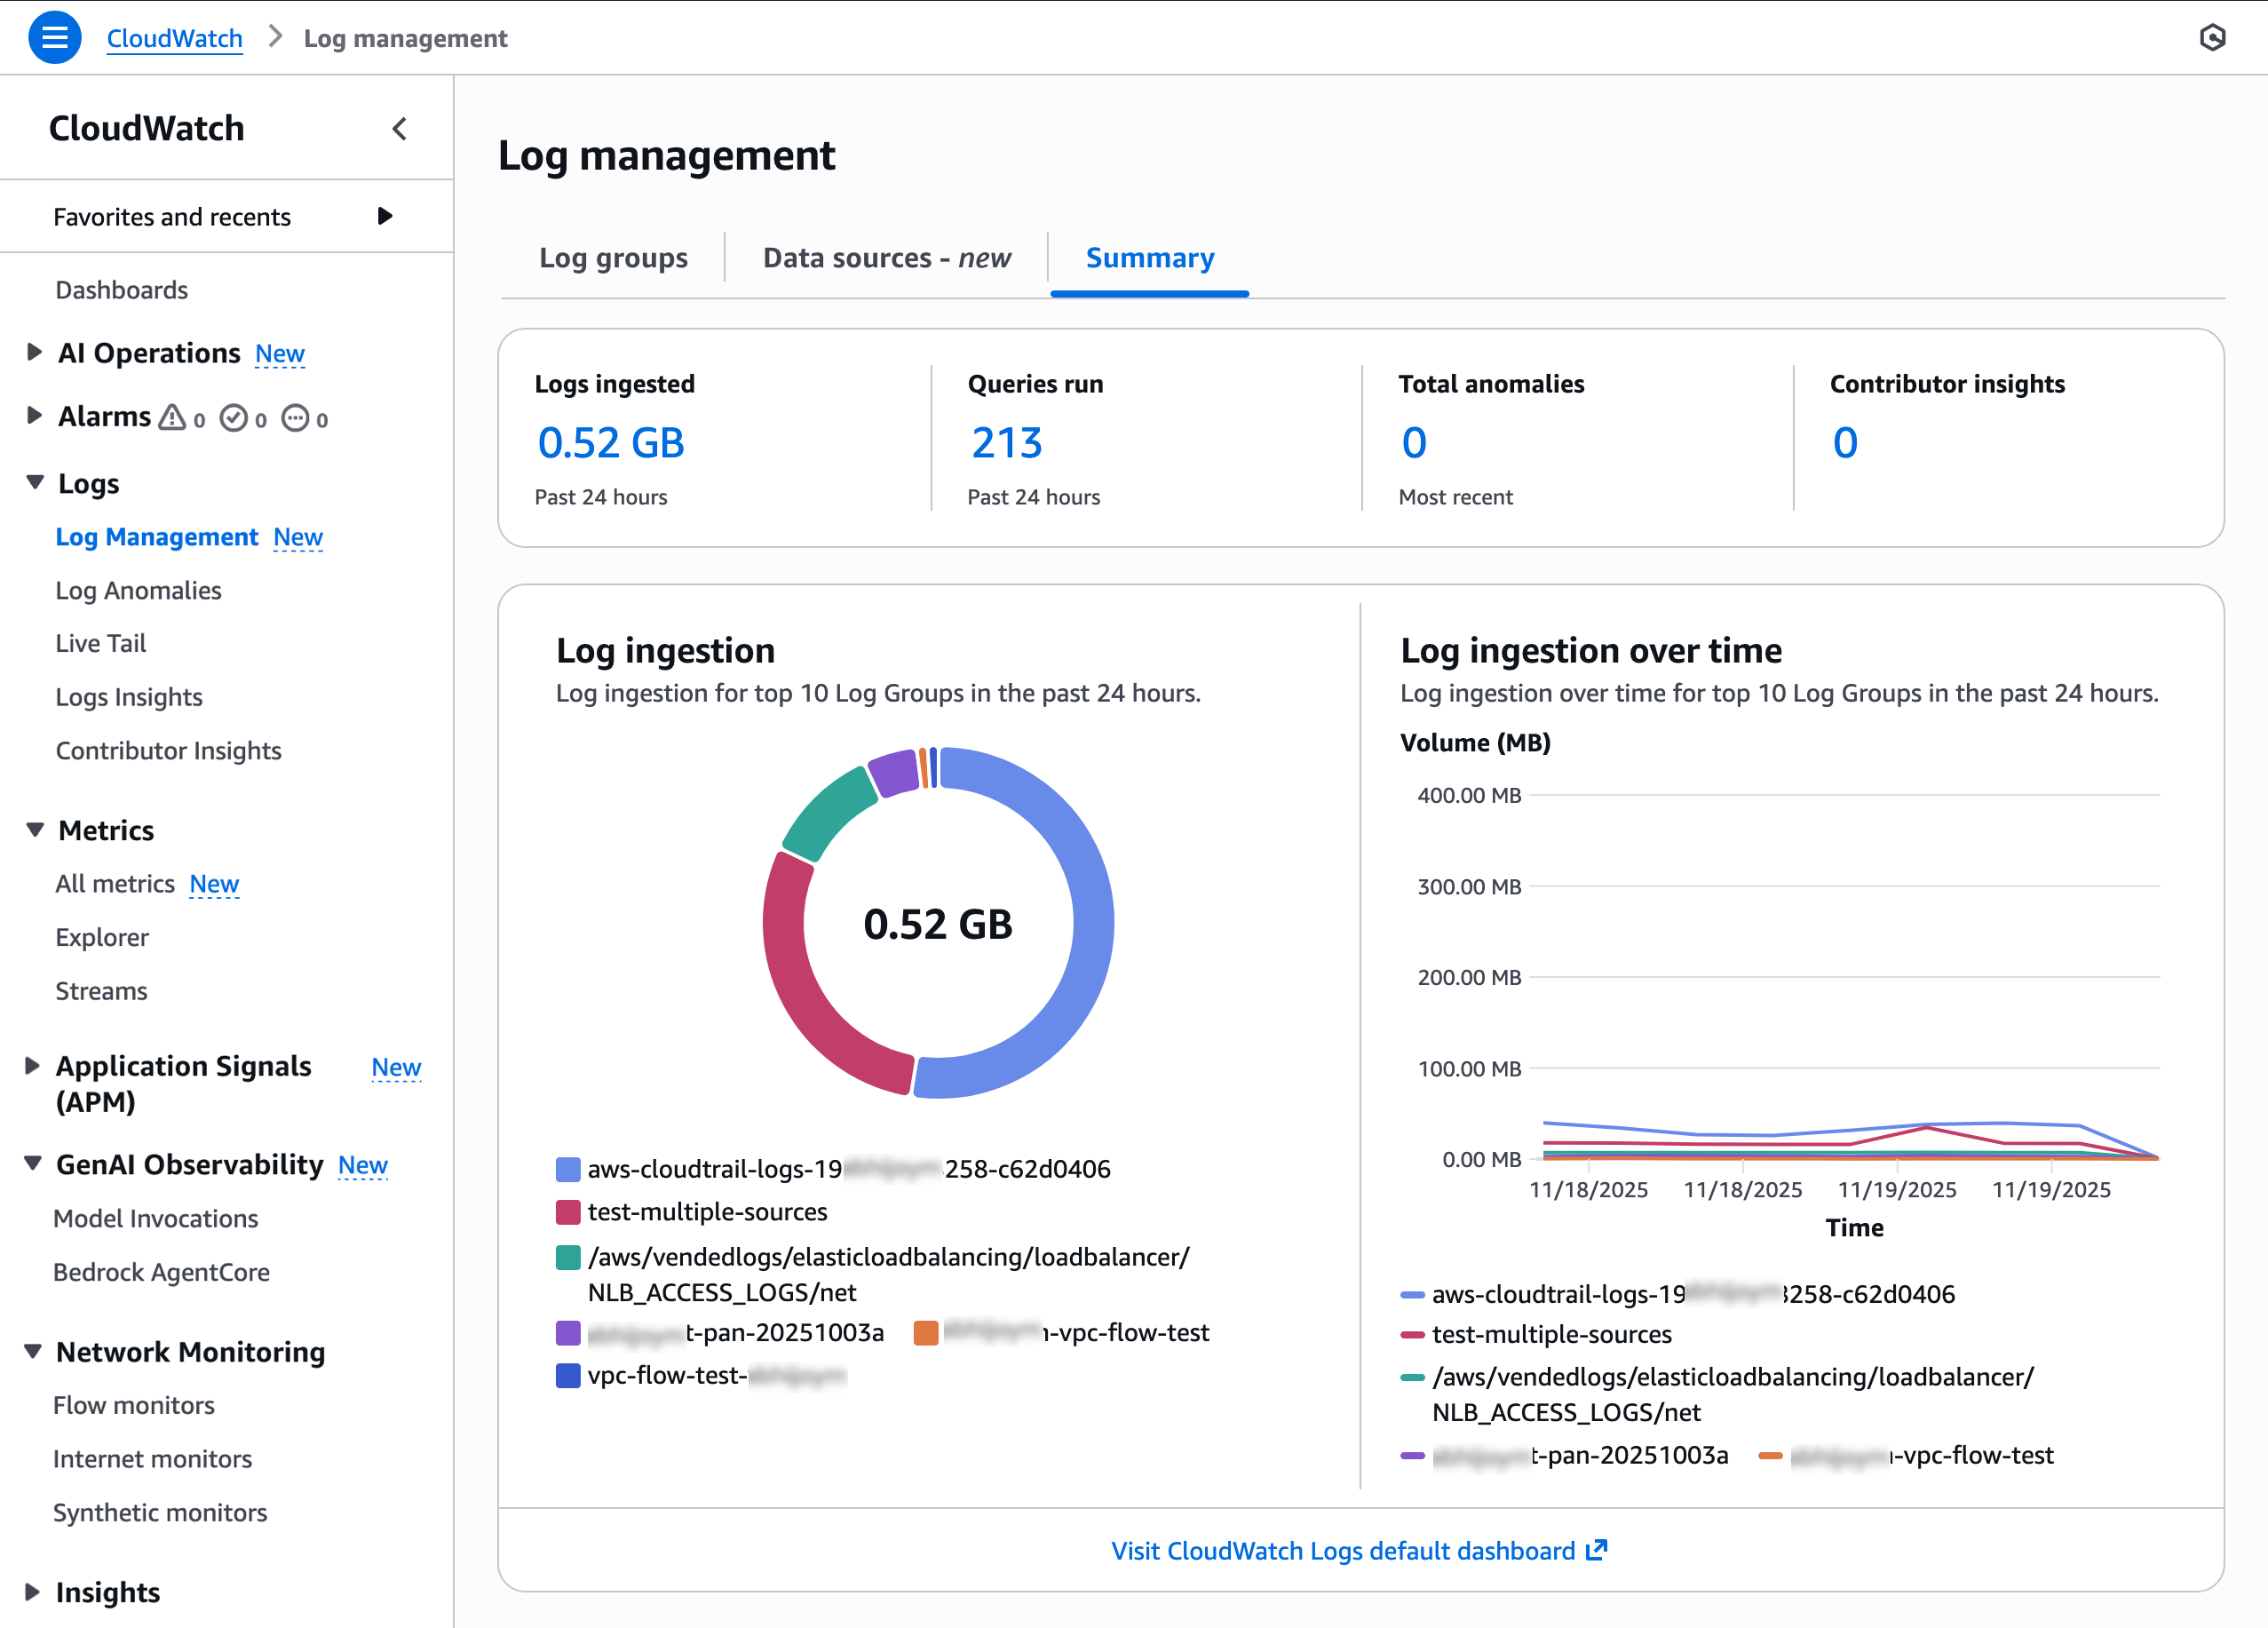
You can see a high-level overview of logs and all data sources with a new Logs Management View in the CloudWatch console. To get started, go to the CloudWatch console and choose Log Management under the Logs menu in the left navigation pane. In the Summary tab, you can observe your logs data sources and types, insights into how your log groups are doing across ingestion, and anomalies.
Choose the Data sources tab to find and manage your log data by data sources, types, and fields. CloudWatch ingests and automatically categorizes data sources by AWS services, third-party, or custom sources such as application logs.
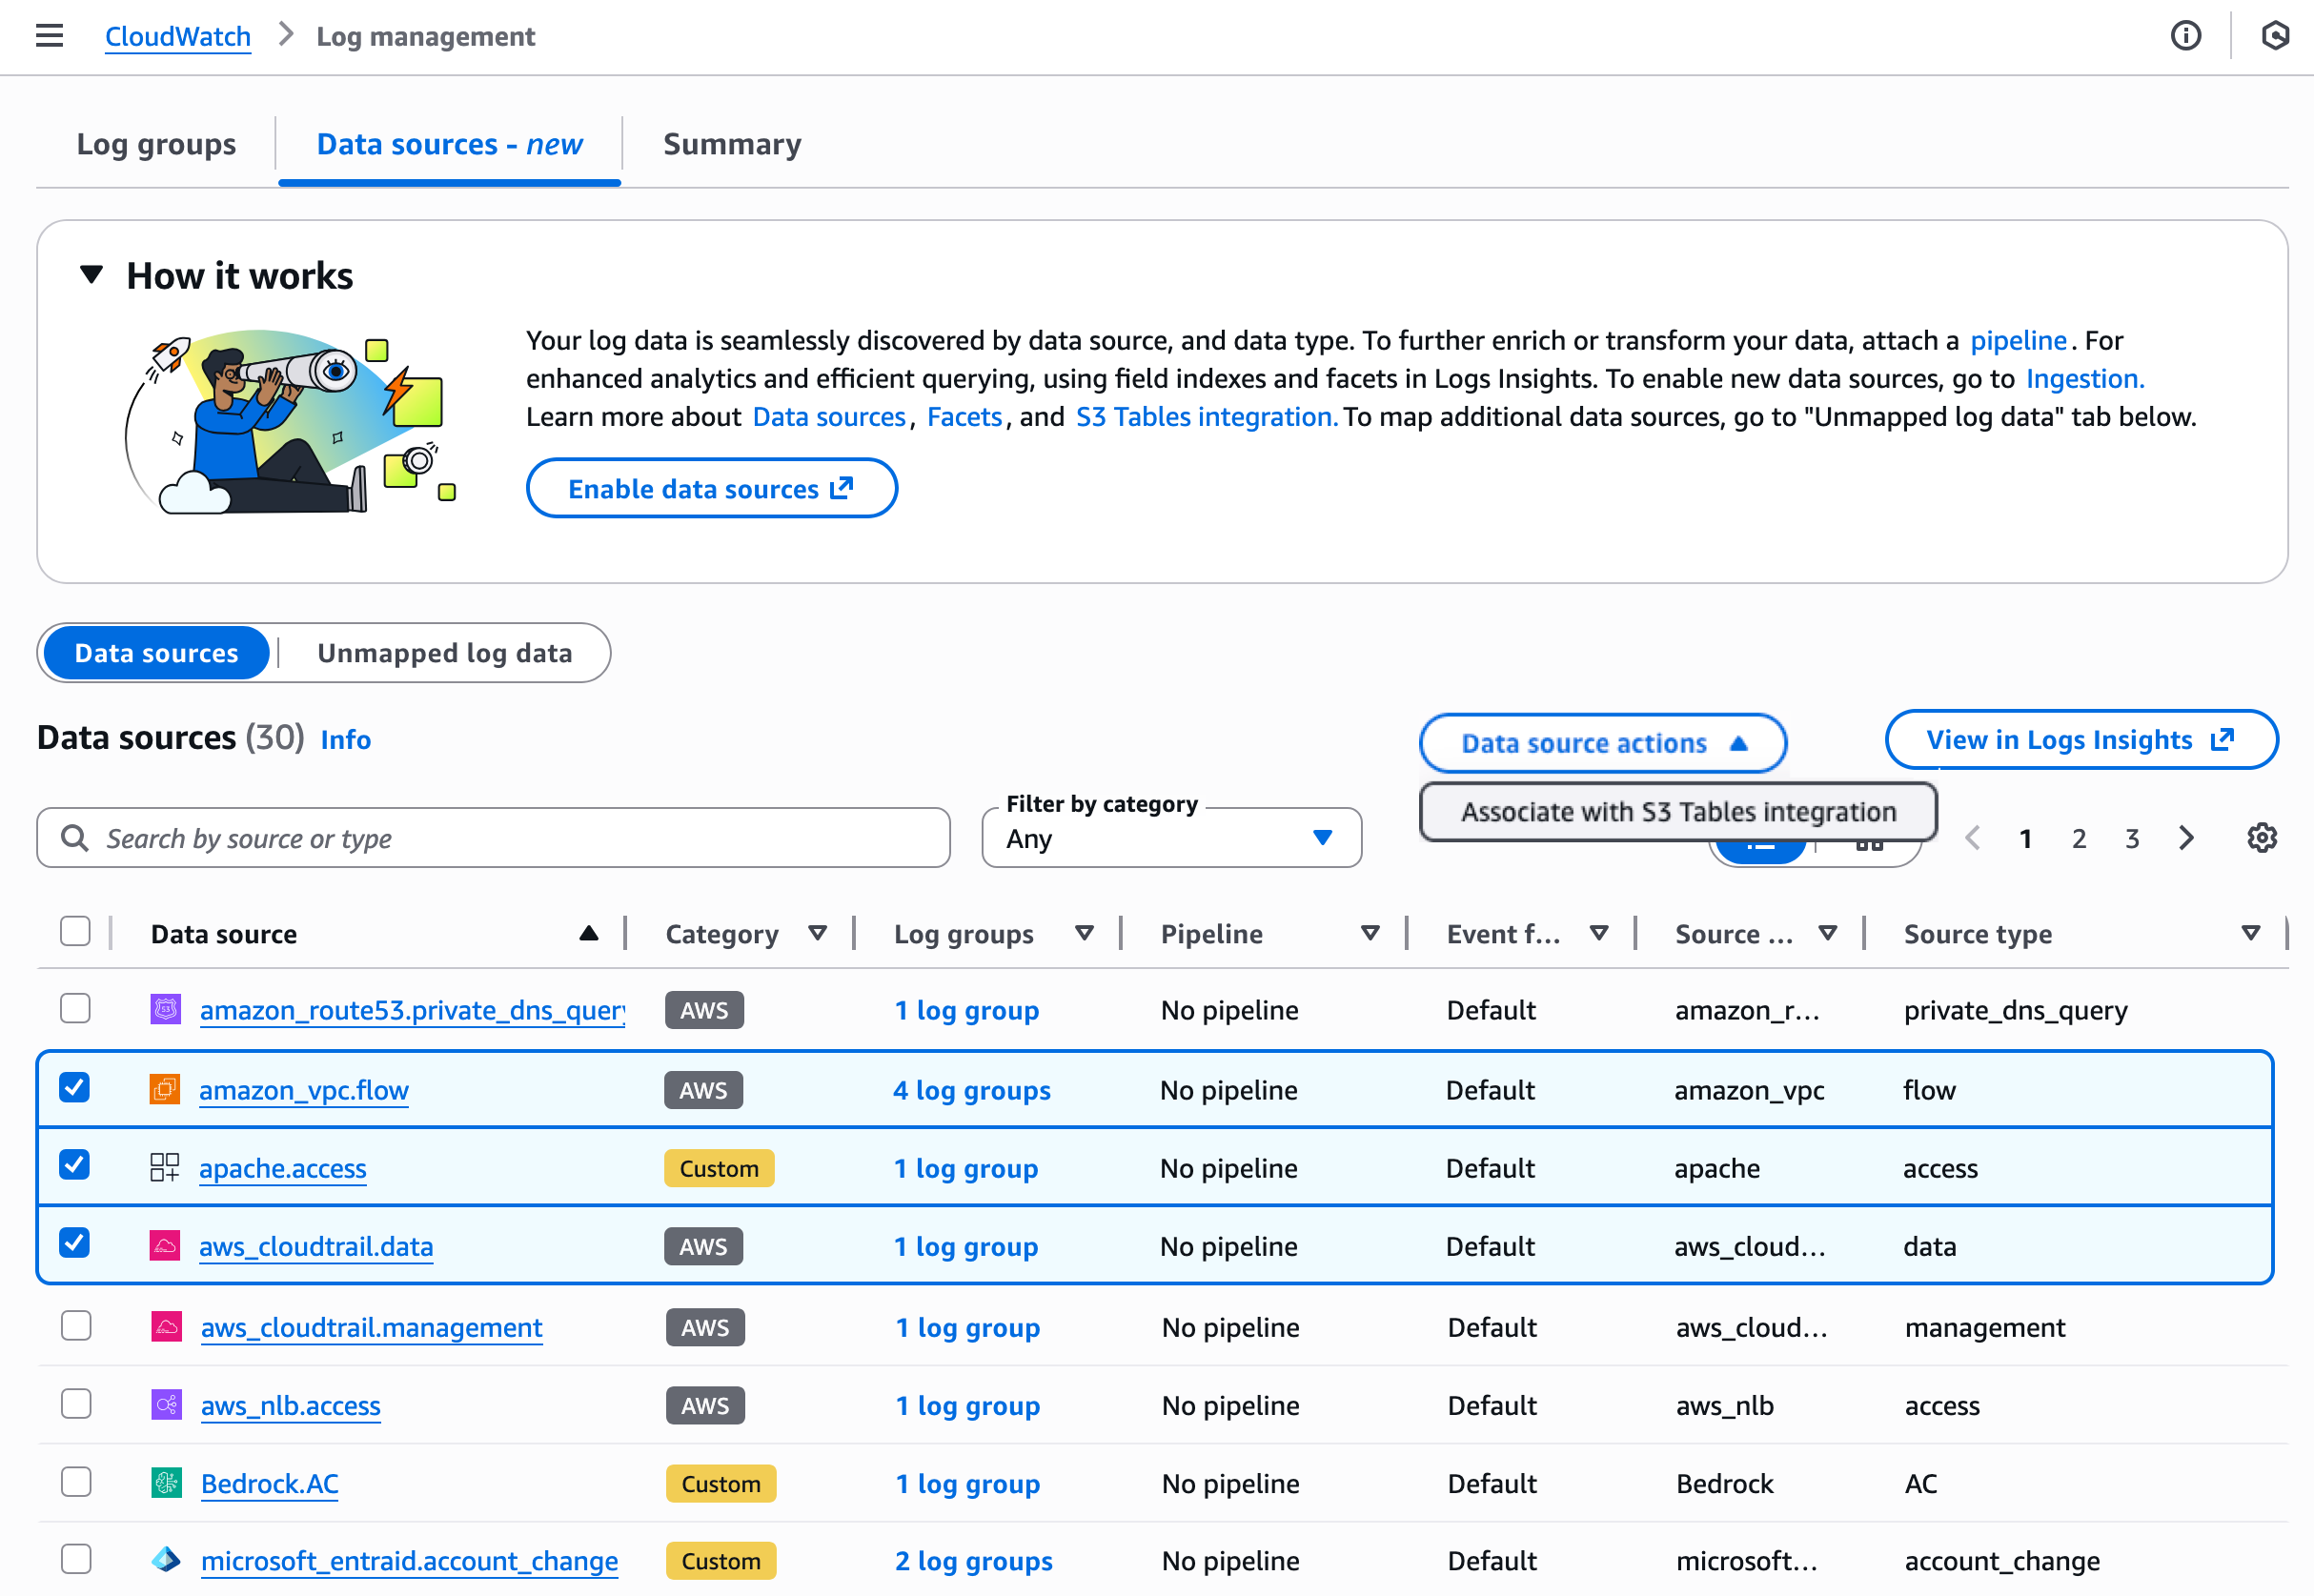
Choose the Data source actions to integrate S3 Tables to make future logs for selected data sources. You have the flexibility to analyze the logs through Athena and Amazon Redshift and other query engines such as Spark using Iceberg compatible access patterns. With this integration, logs from CloudWatch are available in a read-only aws-cloudwatch S3 Tables bucket.
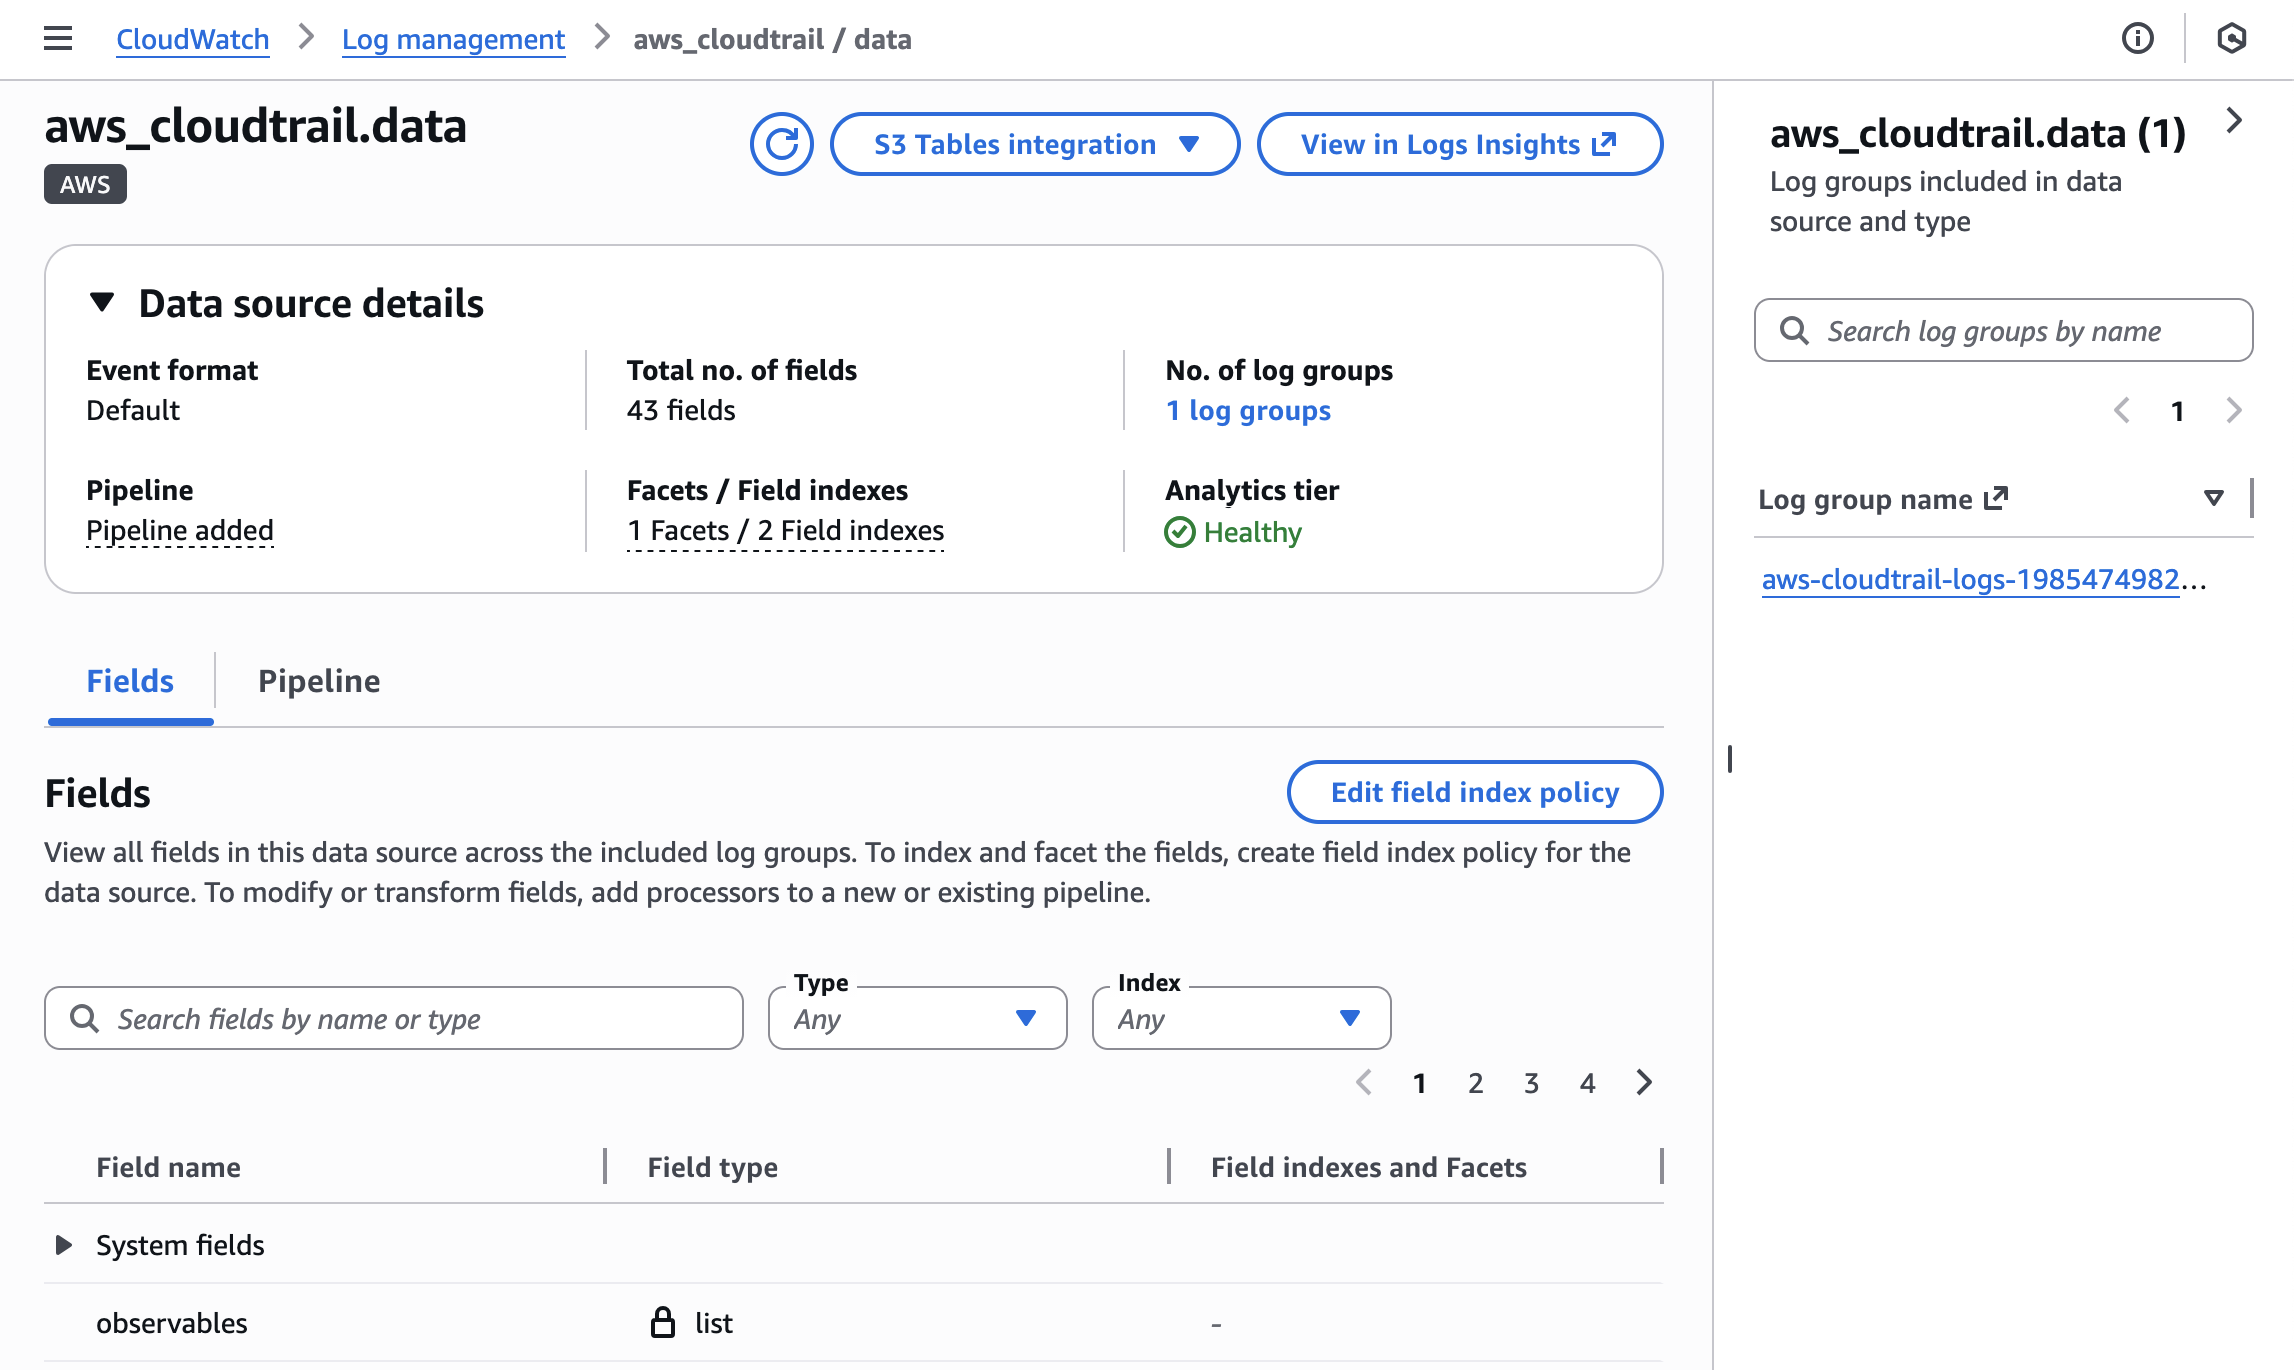
When you choose a specific data source such as CloudTrail data, you can view the details of the data source that includes information regarding data format, pipeline, facets/field indexes, S3 Tables association, and the number of logs with that data source. You can observe all log groups included in this data source and type and edit a source/type field index policy using the new schema support.
To learn more about how to manage your data sources and index policy, visit Data sources in the Amazon CloudWatch Logs User Guide.
2. Ingestion and transformation using CloudWatch pipelines
You can create pipelines to streamline collecting, transforming, and routing telemetry and security data while standardizing data formats to optimize observability and security data management. The new pipeline feature of CloudWatch connects data from a catalogue of data sources, so that you can add and configure pipeline processors from a library to parse, enrich, and standardize data.
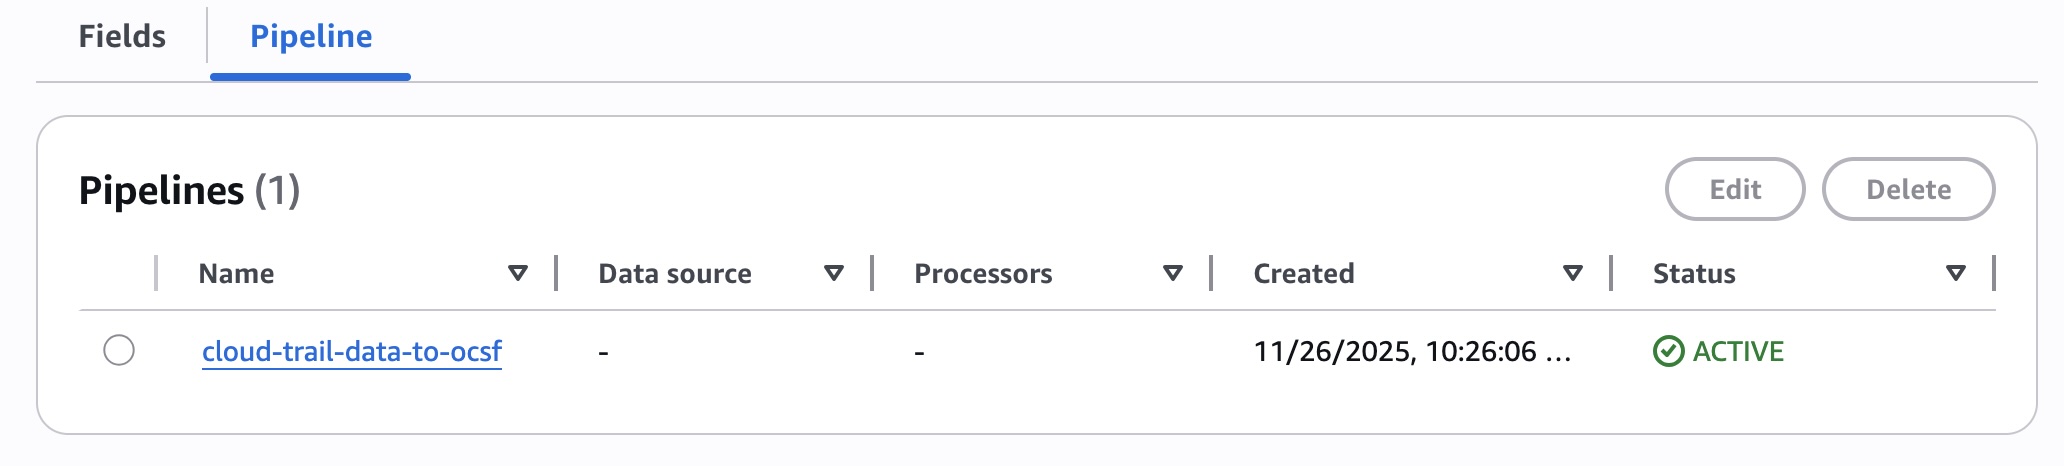
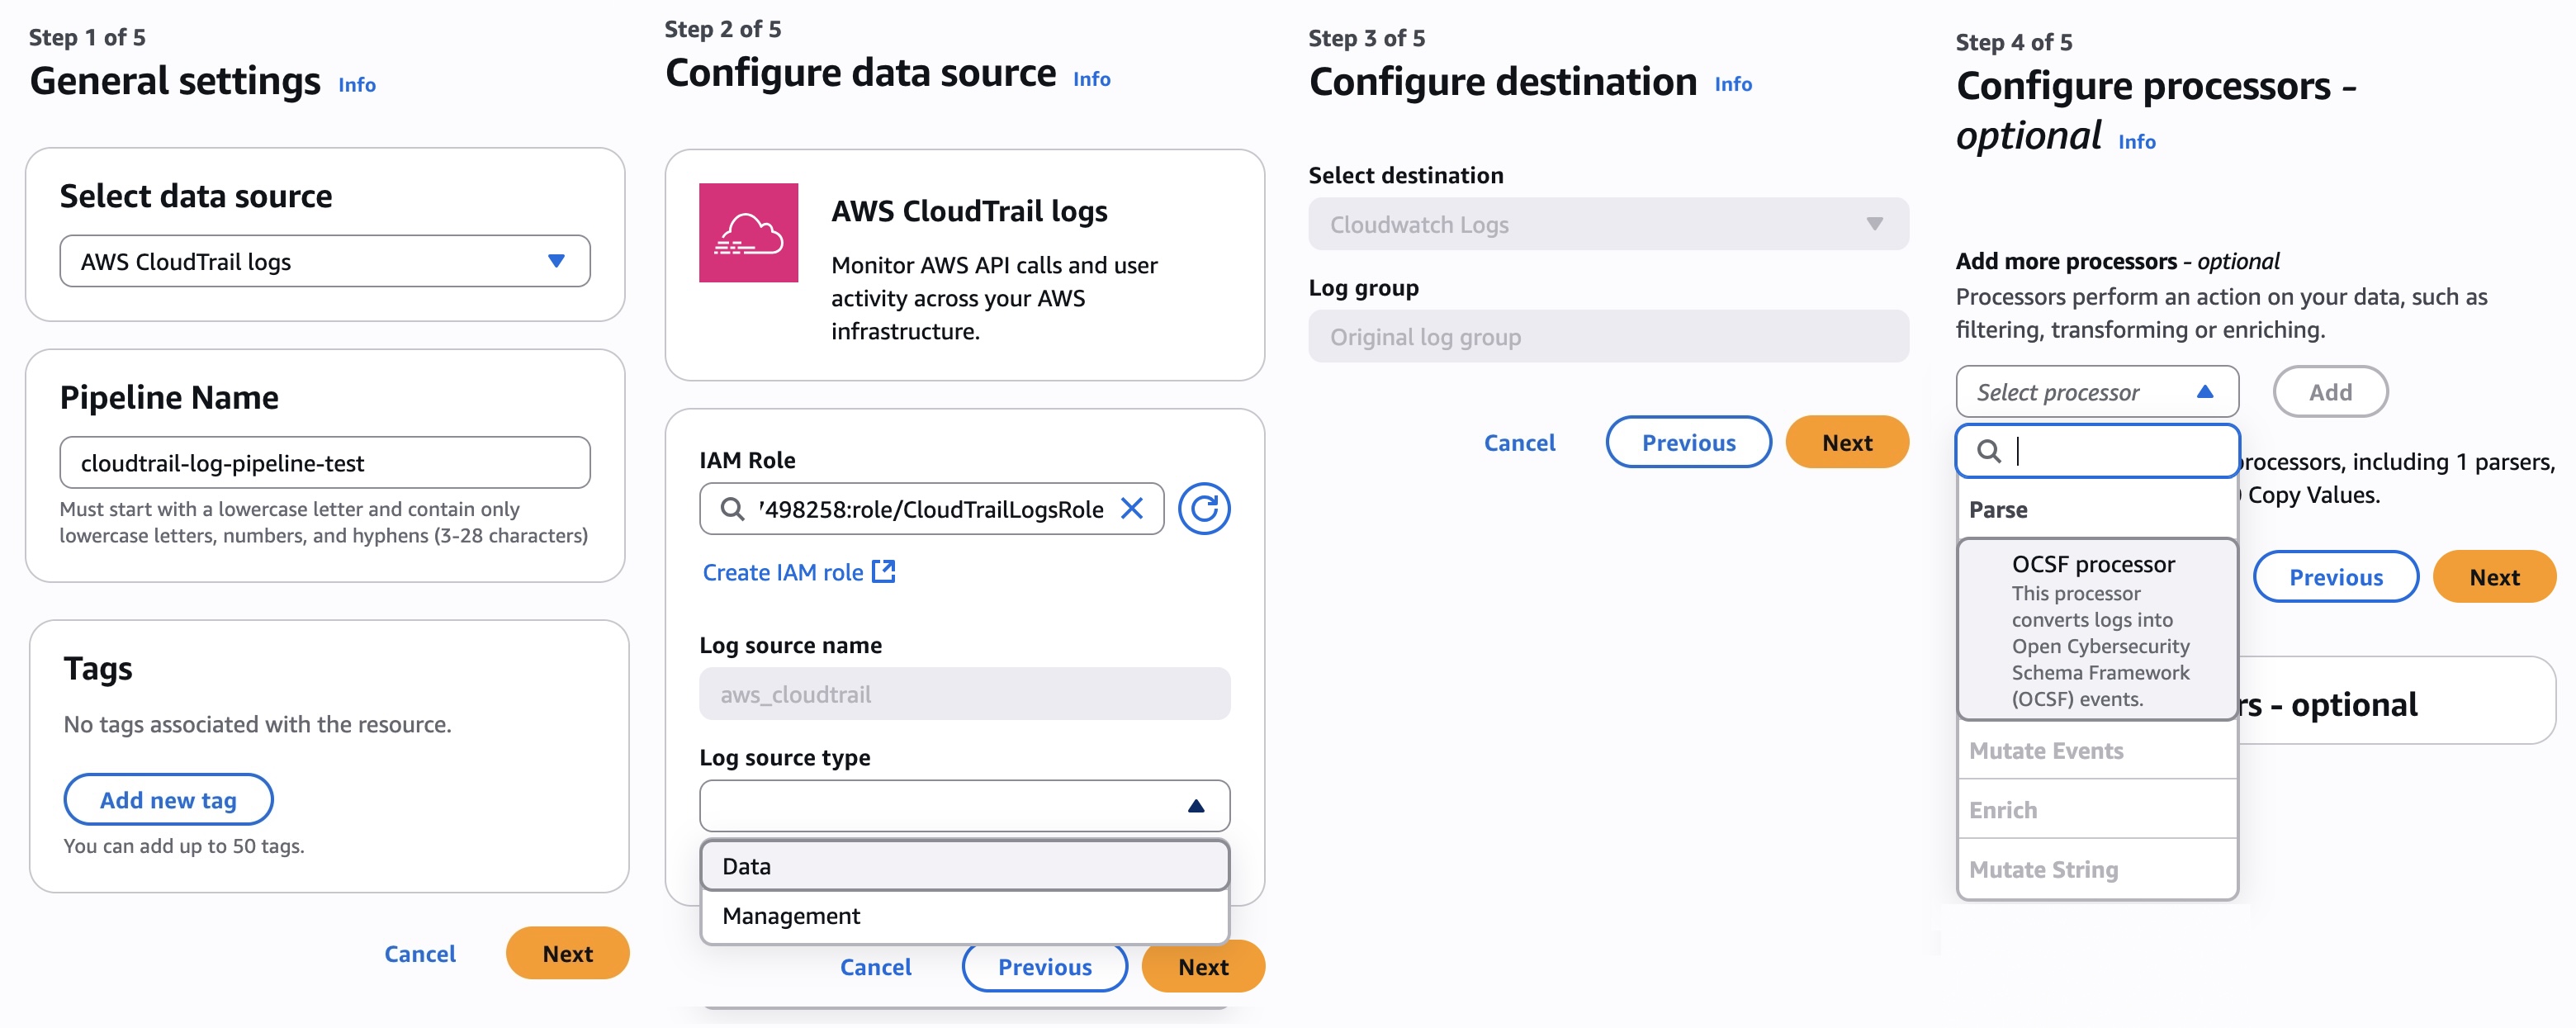
In the Pipeline tab, choose Add pipeline. It shows you the pipeline configuration wizard. This wizard guides you through five steps where you can choose the data source and other source details such as log source types, configure destination, configure up to 19 processors to perform an action on your data (such as filtering, transforming, or enriching), and finally review and deploy the pipeline.
You also have the option to create pipelines through the new Ingestion experience in CloudWatch. To learn more about how to set up and manage the pipelines, visit Pipelines in the Amazon CloudWatch Logs User Guide.
3. Enhanced analytics and querying based on data sources
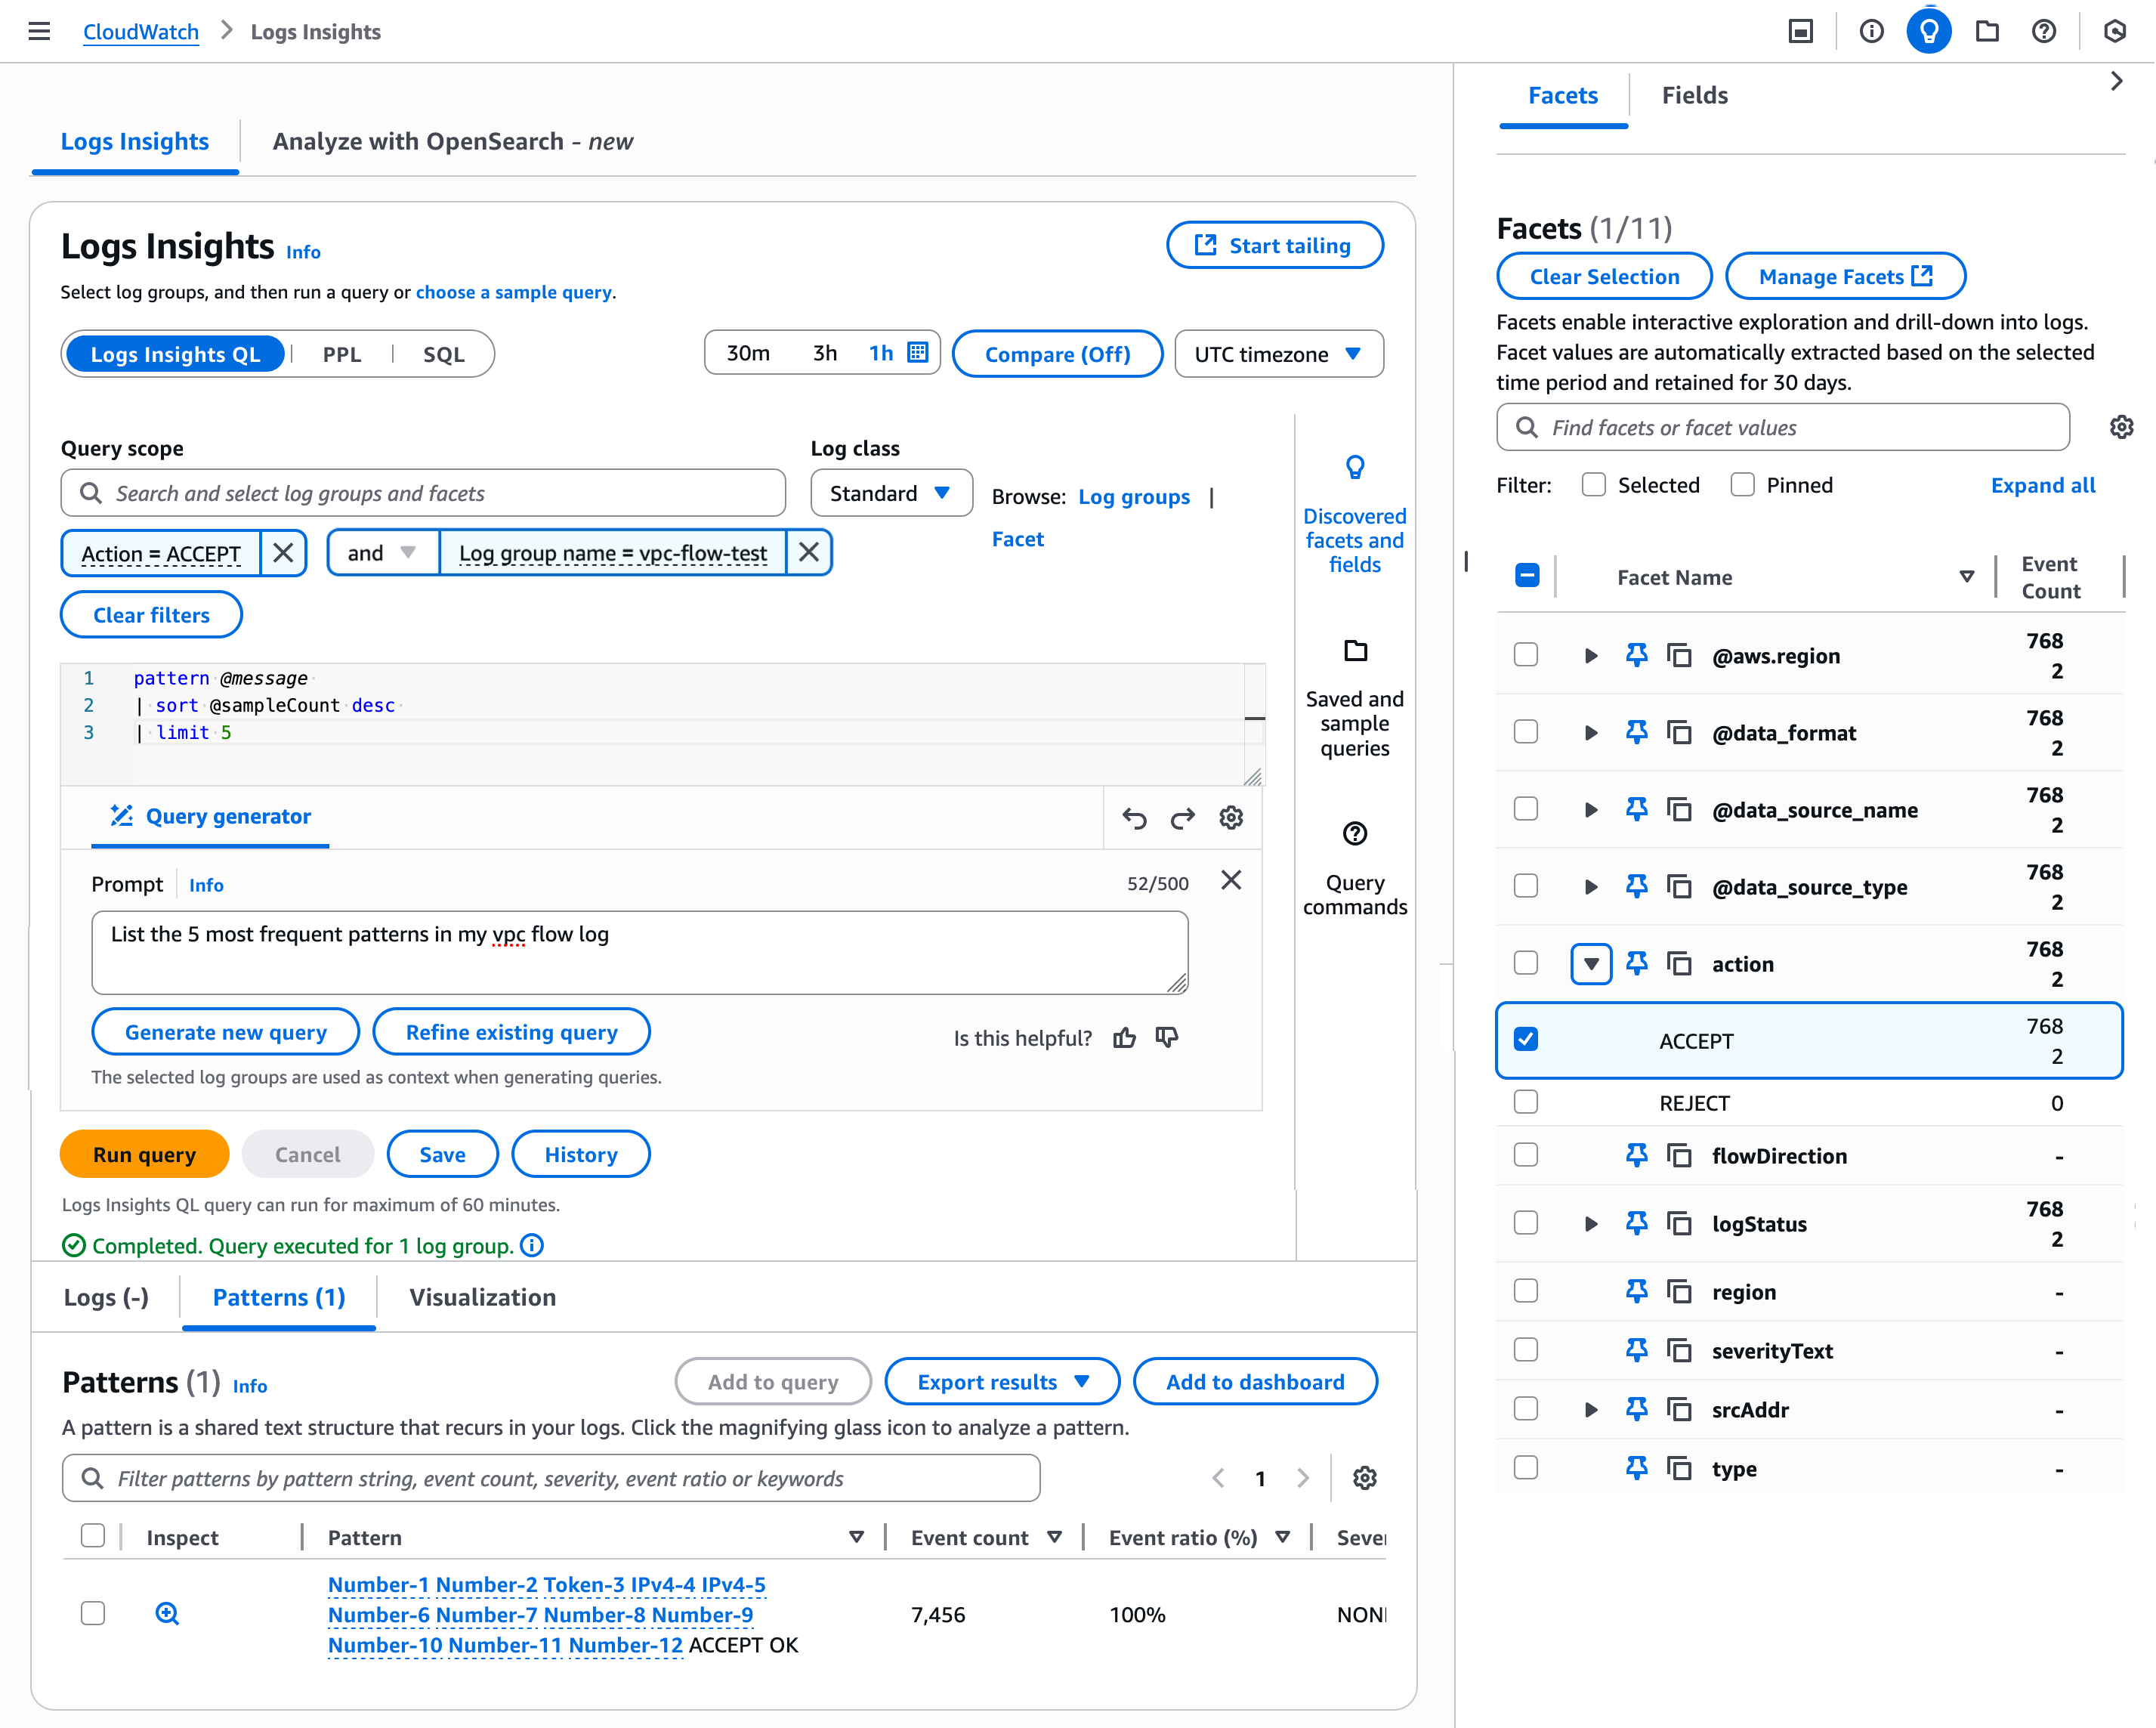
You can enhance analytics with support for Facets and querying based on data sources. Facets enable interactive exploration and drill-down into logs and their values are automatically extracted based on the selected time period.
Choose the Facets tab in the Log Insights under the Logs menu in the left navigation pane. You can view available facets and values that appear in the panel. Choose one or more facets and values to interactively explore your data. I choose Facets regarding a VPC Flow Logs group and action, query to list the five most frequent patterns in my VPC Flow Logs through the AI query generator, and get the result patterns.
You can save your query with the selected Facets and values that you have specified. When you next choose your saved query, the logs to be queried have the pre-specified facets and values. To learn more about Facet management, visit Facets in the CloudWatch Logs User Guide.
As I previously noted, you can integrate data sources into S3 Tables and query together. For example, using a Query Editor in Athena, you can query correlates network traffic with AWS API activity from a specific IP range (174.163.137.*) by joining VPC Flow Logs with CloudTrail logs based on matching source IP addresses.
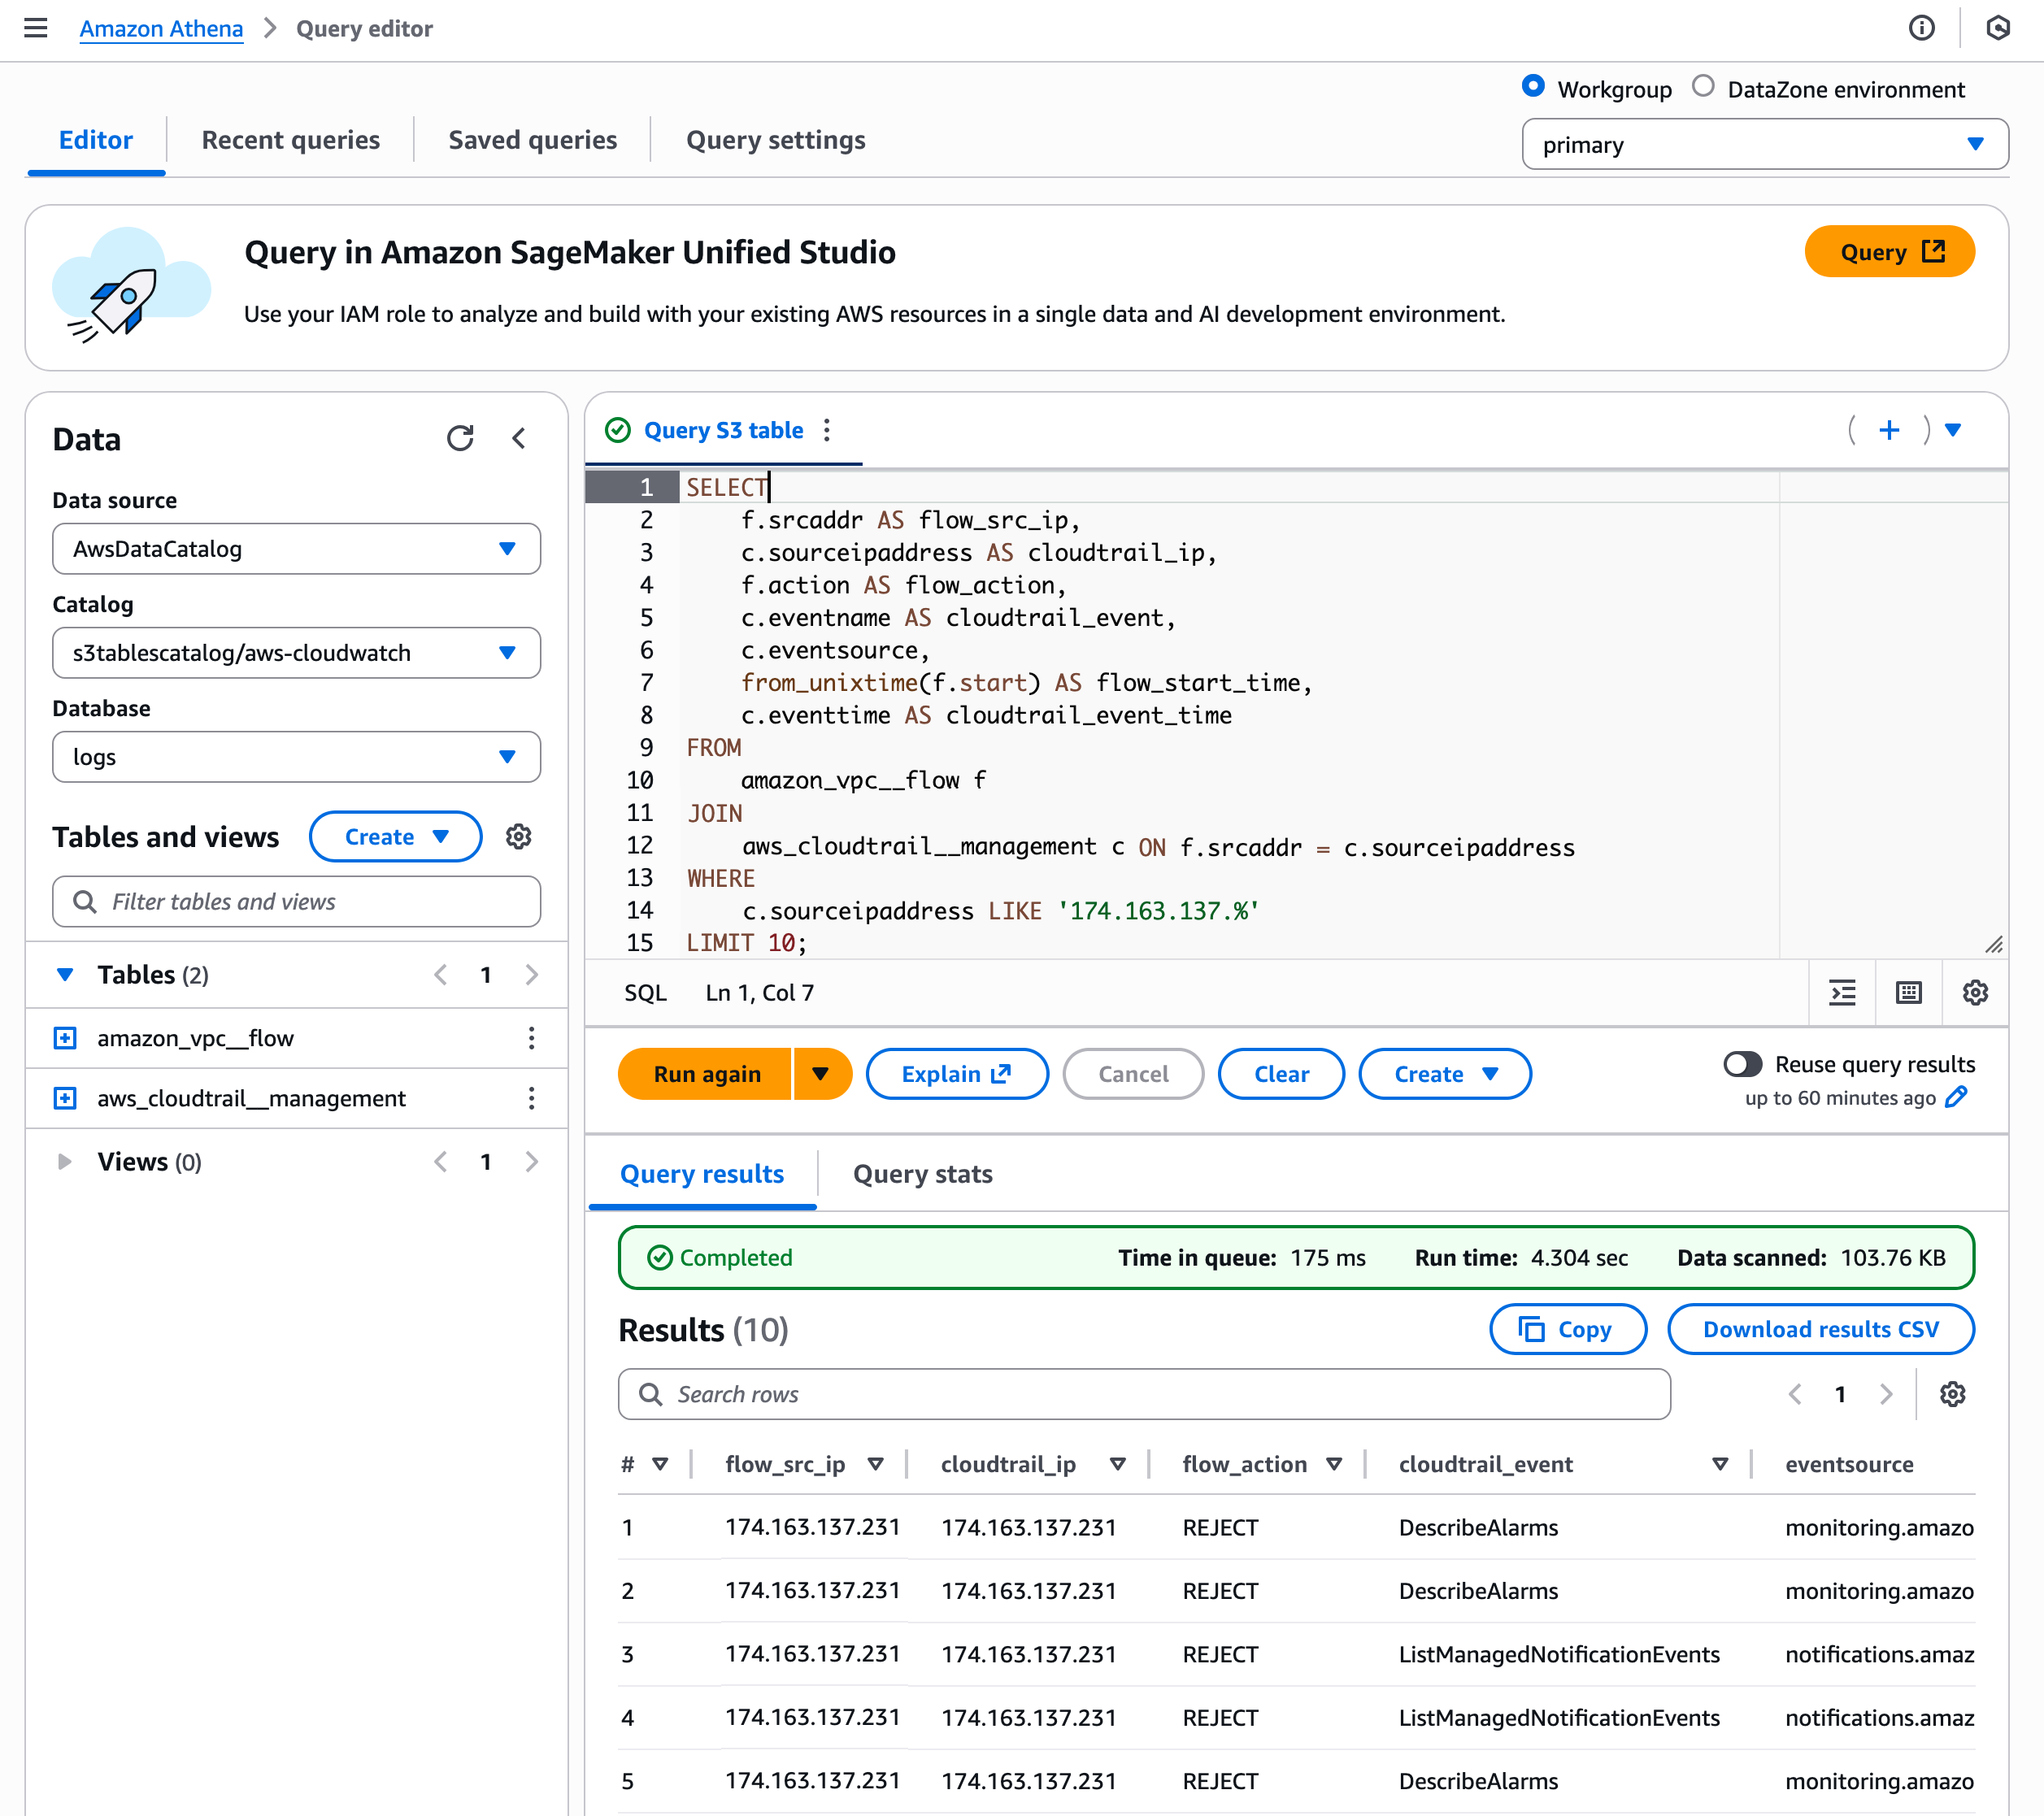
This type of integrated search is particularly valuable for security monitoring, incident investigation, and suspicious behavior detection. You can view if an IP that’s making network connections is also performing sensitive AWS operations such as creating users, modifying security groups, or accessing data.
To learn more, visit S3 Tables integration with CloudWatch in the CloudWatch Logs User Guide.
Now available
New log management features of Amazon CloudWatch are available today in all AWS Regions except the AWS GovCloud (US) Regions and China Regions. For Regional availability and future roadmap, visit the AWS Capabilities by Region. There are no upfront commitments or minimum fees, and you pay for the usage of existing CloudWatch Logs for data ingestion, storage, and queries. To learn more, visit the CloudWatch pricing page.
Give it a try in the CloudWatch console. To learn more, visit the CloudWatch product page and send feedback to AWS re:Post for CloudWatch Logs or through your usual AWS Support contacts.
— Channy