AWS News Blog
AWS Cost Explorer Update – Better Filtering & Grouping, Report Management, RI Reports
Our customers use Cost Explorer to better understand and manage their AWS spending, making heavy use of the reporting, analytics, and visualization tools that it provides. We launched Cost Explorer in 2014 with a focus on simplicity – single click signup, preconfigured default views, and a clean user interface (take a look back at The New AWS Cost Explorer to see where we started). The Cost Explorer has been very popular and we’ve received a lot of great feedback from our customers.
Last week we launched a major upgrade to Cost Explorer. We’ve redesigned the user interface to optimize many common workflows including filtering, report management, selection of date ranges, and grouping of data. We have also included some default reports to make it easier for you to explore the costs related to your use of Reserved Instances.
Looking at Cost Explorer
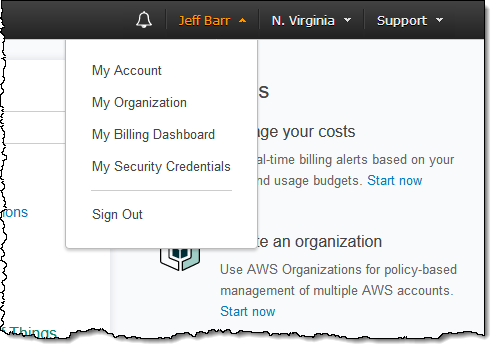
Since pictures are reportedly worth 1000 words, let’s take a closer look! Cost Explorer is part of the Billing Dashboard so I can start there:
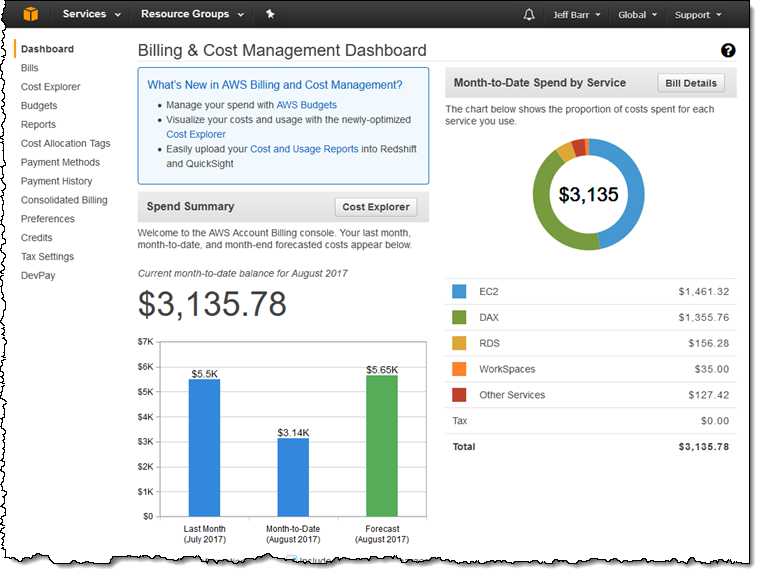
Here’s the Billing Dashboard. I click on Cost Explorer to move ahead:
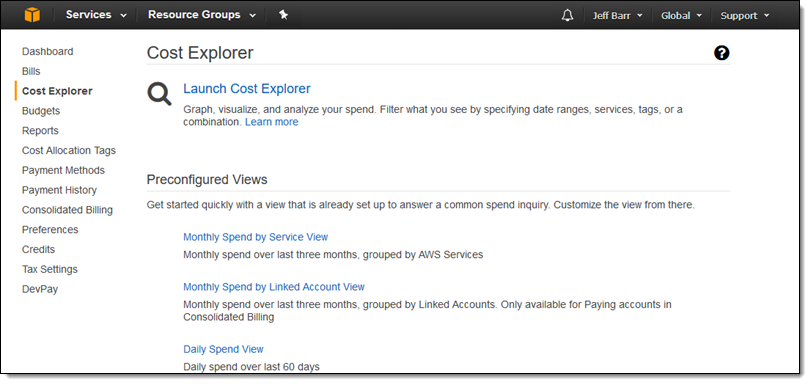
I can open up Cost Explorer or access one of three preconfigured views. I’ll go for the first option:
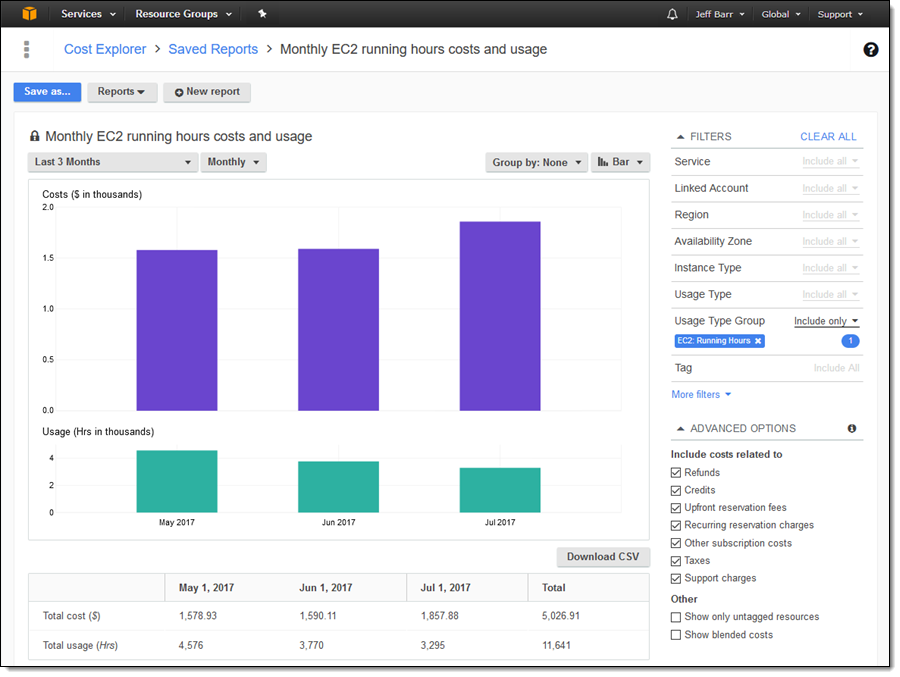
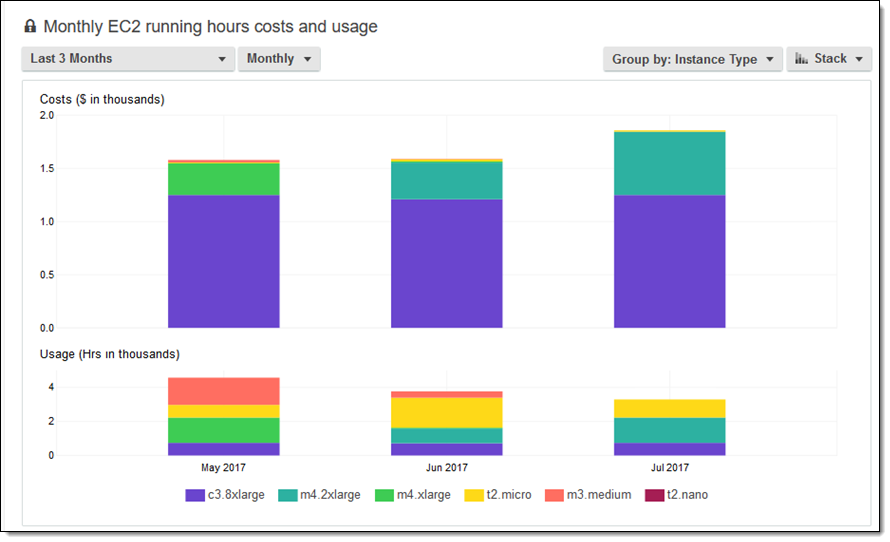
The default report shows my EC2 costs and usage (running hours) for the past 3 months:
I can use the Group By menu to break the costs down by EC2 instance type:
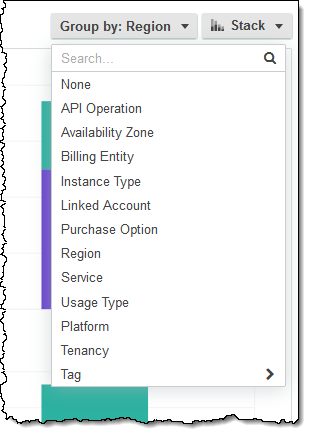
I have many other grouping options:
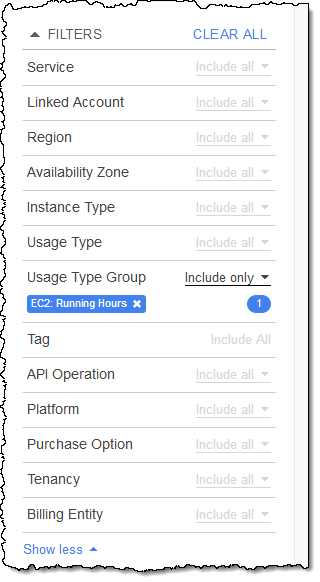
The filtering options are now easier to access and to edit. Here’s the full set:
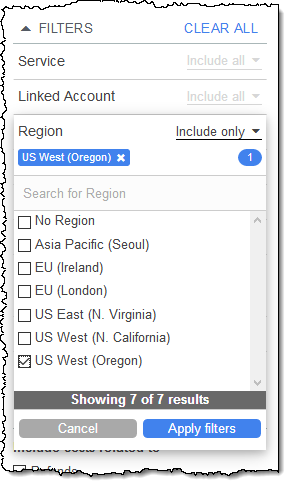
I can explore my EC2 costs in any set of desired regions:
I can filter and then group by instance type to see how my spending breaks down:
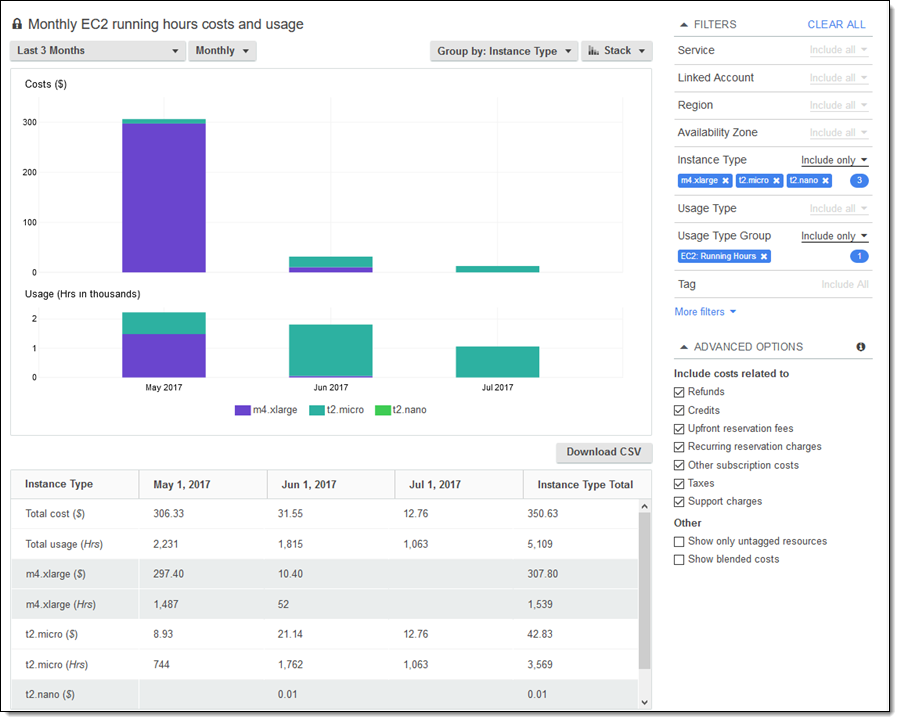
I can click on Download CSV and then process the data locally:

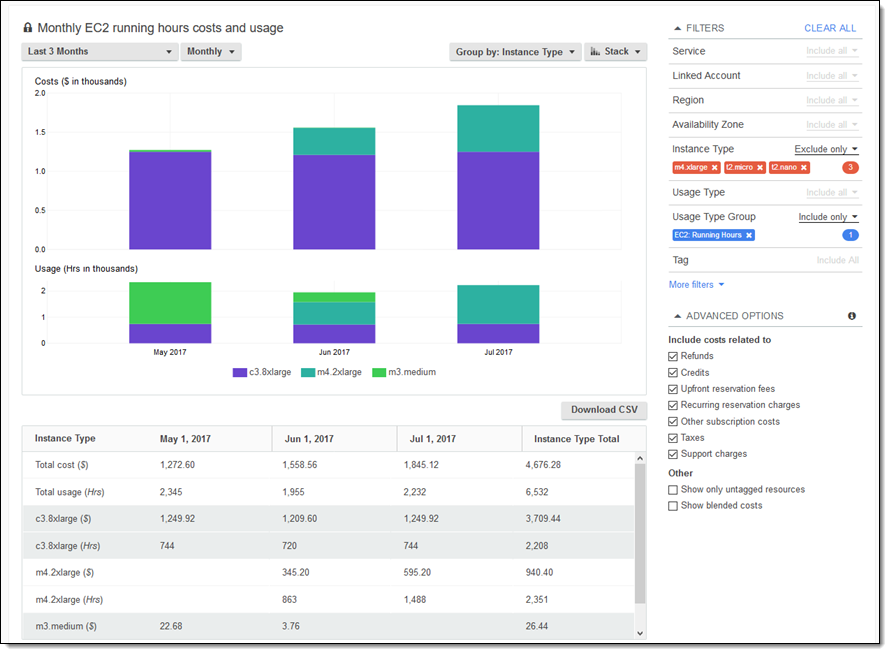
I can also exclude certain instance types from the report. Here’s how I exclude my m4.xlarge, t2.micro, and t2.nano usage:
Report Management
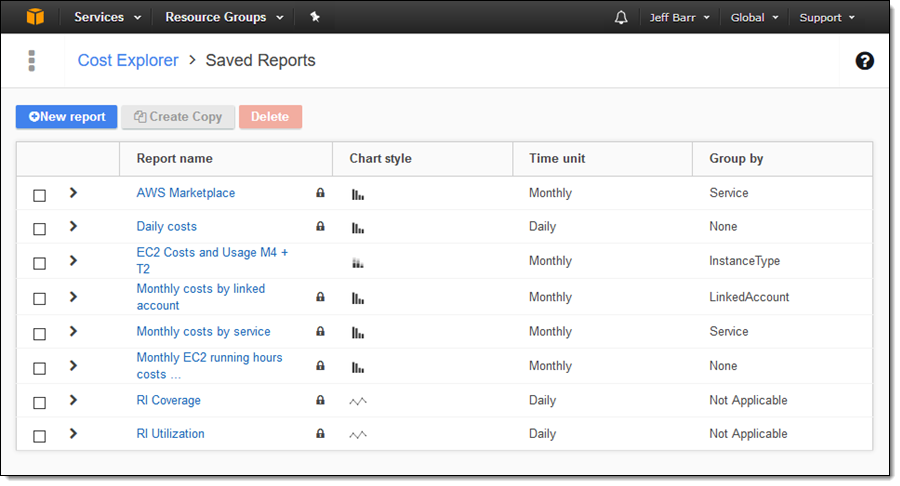
Cost Explorer allows me to customize my existing reports and to create new reports from scratch. I can click on Save As to save my customized report with a new name:

I can see and manage all of my reports on the Saved Reports page (The padlock denotes a default report that cannot be edited and then overwritten):
When I click on New report I can start from a template:
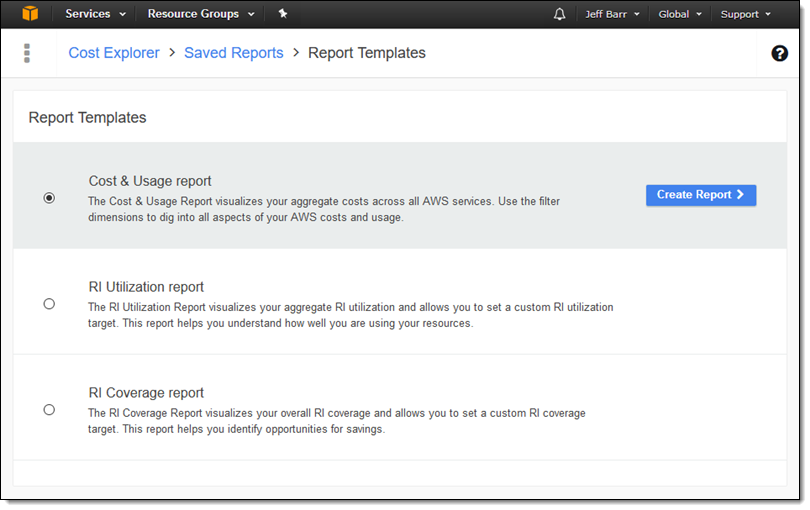
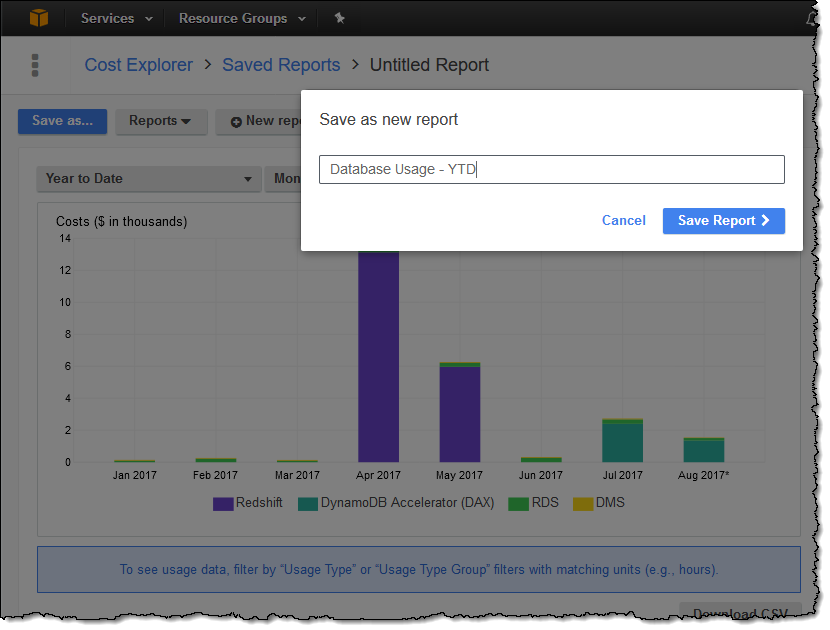
After I click on Create Report, I set up my date range and filters as desired, and click on Save As. I created a report that displays my year-to-date usage of several AWS database services (Amazon Redshift, DynamoDB Accelerator (DAX), Amazon Relational Database Service (Amazon RDS), and AWS Database Migration Service (AWS DMS)):
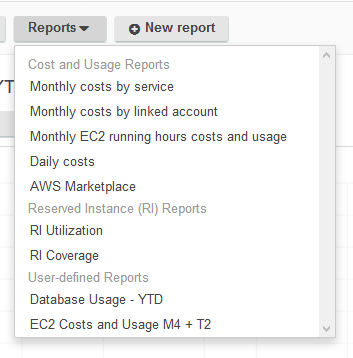
All of my reports are accessible from the Reports menu so I can check on my costs with a click:
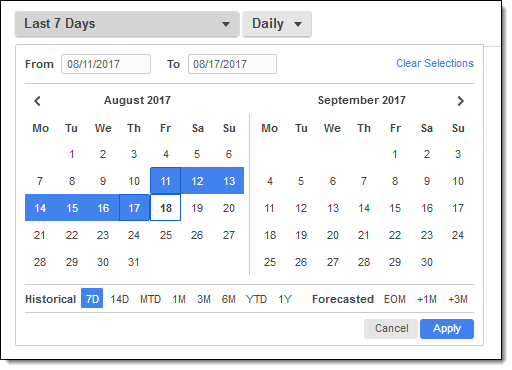
We also simplified the process of selecting a range of dates for a report, including options to select common date ranges:
Reserved Instance Reports
Cost Explorer also includes a pair of reports that will help you to understand and optimize your usage of Reserved Instances. I don’t own an RI’s so I used screen shots supplied by the team.
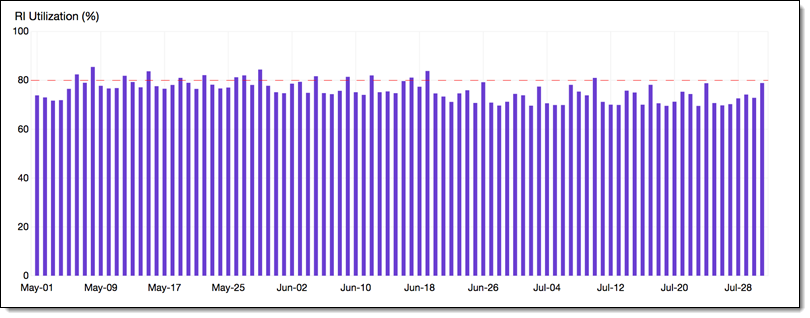
The RI Utilization report allows you to see how much of your purchased RI capacity is being put to use (the dashed red line represents a utilization target that you can specify):
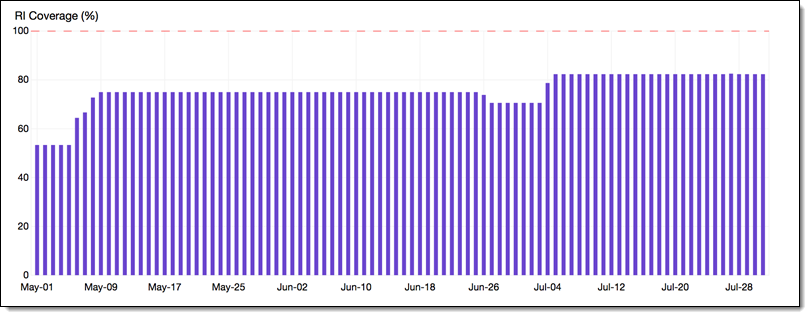
The RI Coverage report tells you how much of your EC2 usage is being handled by Reserved Instances (this time, the dashed red line represents the desired amount of coverage):
I hope you have enjoyed this tour of the updated Cost Explorer. It is available now and you can start using it today!
— Jeff;