AWS Big Data Blog
Amazon Redshift delivers faster performance for BI dashboards and real-time analytics
Business intelligence (BI) dashboards and real-time analytics have become essential tools for making informed decisions quickly. Modern data warehouses must excel at complex, long-running analytical queries and also deliver sub-second response times for the short, ad hoc queries that power interactive and real-time experiences. This matters even more as agents explore and derive new insights from massive amounts of data. From executives monitoring key performance indicators on their morning dashboards to data analysts using agents to explore datasets interactively, the expectation is clear: queries should return results fast and predictably.
Amazon Redshift has long been optimized for these use cases. Over the years, we’ve introduced numerous features designed to improve query performance for BI and real-time analytics workloads, including result caching, materialized views, and automatic workload management (AutoWLM). These capabilities have helped thousands of customers build responsive dashboards and real-time applications on Amazon Redshift. However, we know that when it comes to interactive analytics, every millisecond matters. That’s why we keep focusing on making dashboards load faster and helping exploratory queries return results more quickly.
Today, we’re excited to announce a new performance optimization in Amazon Redshift that improves the response times of low-latency SQL queries, such as those used in real-time analytics applications or generated by BI dashboards. With this enhancement, you can experience improved query latencies because of a reduction in the time Amazon Redshift spends preparing SQL queries for execution. SQL queries start faster, so they return results quicker.
How the optimization works
To understand this improvement, let’s first examine one of Amazon Redshift’s existing core performance capabilities: code generation. Code generation is an optimization technique that analyzes each SQL query and generates query-specific C++ code internally. This code is then compiled and executed in parallel across the available Amazon Redshift compute nodes to deliver results back to you. Code generation has been fundamental to Amazon Redshift query performance, executing complex analytical queries with high efficiency.
While code generation results in performant query execution, new queries can experience a one-time compilation overhead the first time they run. Amazon Redshift already caches compiled code, and more than 99% of queries in the Amazon Redshift fleet execute using this cached generated code and experience no compilation overhead. For queries that haven’t been cached yet, the one-time compilation overhead is most noticeable for fast-running queries (for example, millisecond or single-digit second queries), where it can represent a significant portion of total execution time.
With the optimization we announced, Amazon Redshift reduces this compilation overhead. Here’s how it works: when Amazon Redshift receives a query, it first checks if optimized compiled C++ code already exists in the cache from previous executions of similar queries in the Amazon Redshift fleet. If so, it uses that code for best performance. If not, Amazon Redshift now applies a new query compilation optimization that processes new queries immediately using composition. Composition is a technique that generates a lightweight arrangement of pre-existing logic. At the same time, it creates query-specific optimized code that is compiled and executed across available compute resources to boost performance further. Composition removes compilation from the critical path of query execution and provides immediate execution while compilation proceeds in the background. With this optimization, new queries processed by Amazon Redshift start faster and deliver performance consistent with subsequent runs.
This approach ensures that first-time queries start much quicker, while repeated queries continue to benefit from the same leading price-performance that Amazon Redshift code generation delivers.
The best part? No action is necessary for your queries to start benefiting from this performance optimization. This enhancement is now the default for all SQL queries in Amazon Redshift for all users on provisioned clusters or serverless workgroups in all AWS Regions where Amazon Redshift is available at no additional cost.
Real-world performance results
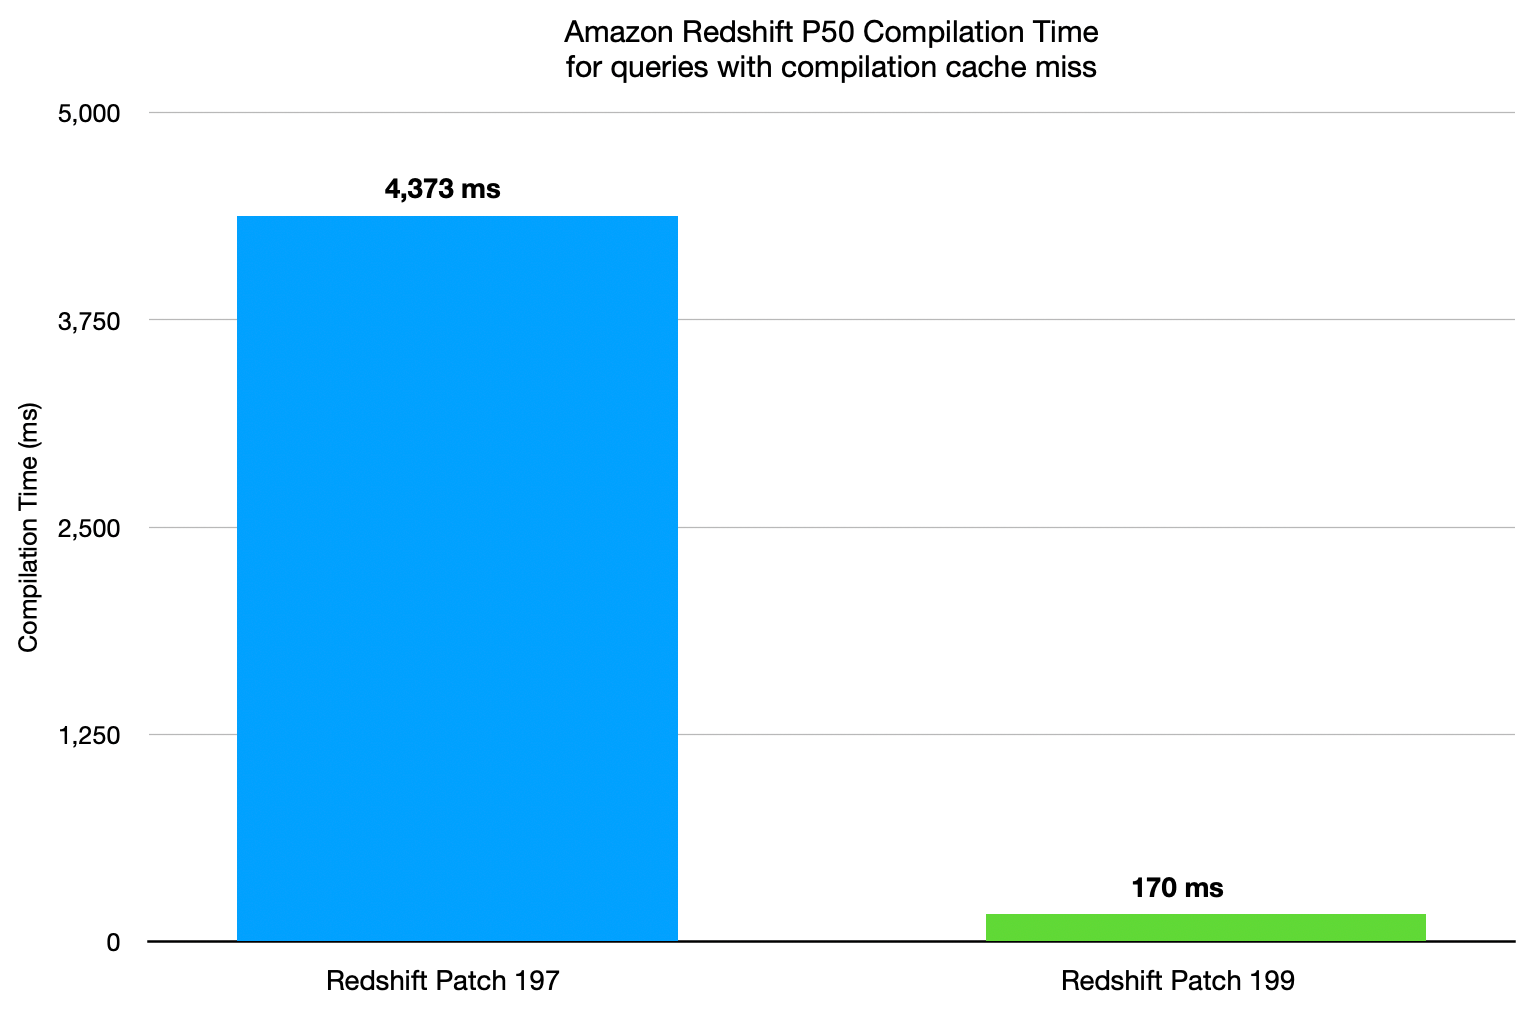
We analyzed the impact of this new optimization on Amazon Redshift customer clusters. To do so, we measured the compilation time of the 1% of query segments that didn’t get a cache hit in our compilation cache and therefore required compilation. The following chart shows the results. The P50 compilation time before the optimization was 4.3 seconds. With this optimization, the compilation time dropped 25.7x to 170 ms.
With this optimization, BI dashboards load faster, interactive exploration feels more responsive, and real-time analytics applications can deliver insights with lower latency.
What customers are saying
“Following the significant performance improvements that Amazon Redshift demonstrated for cold query execution on our cluster with the FastCompile query performance feature enabled, achieving 2.4x faster query performance with compilation time reduced from 12 seconds to 5 seconds, we have adopted Amazon Redshift as our analytics solution”
— Vijay Hiremath, Group Manager, Business Platforms, Intuit
“As a data platform leader at a leading Chinese liquor company, we rely heavily on Amazon Redshift as our enterprise data warehouse. With diverse analytical query patterns, we faced performance challenges during initial compilation. After testing Redshift’s new cold query compilation enhancement, cold queries now perform nearly as fast as warm queries, with significantly improved speed on diverse queries”
— Yujie Wang, Data Platform Leader, JNC
“In a mid size customer processing about 85 GB of data daily through complex ETL pipelines — multiple tables, mixed DML operations, all landing into our 1.7 TB Amazon Redshift data warehouse, fast compile enhancements accelerated our post-maintenance ETL pipelines by 25%. Now the customer data loads complete faster, data hits analysts sooner for quick decisions”
— Jagan Mohan, Product Engineering Head, Algonomy
If you want to learn more about this technology, see the FastCompose: Eliminating compilation cold starts in query execution with composition publication, accepted for the VLDB 2026 Boston conference.
Industry-leading price-performance for all of your workloads
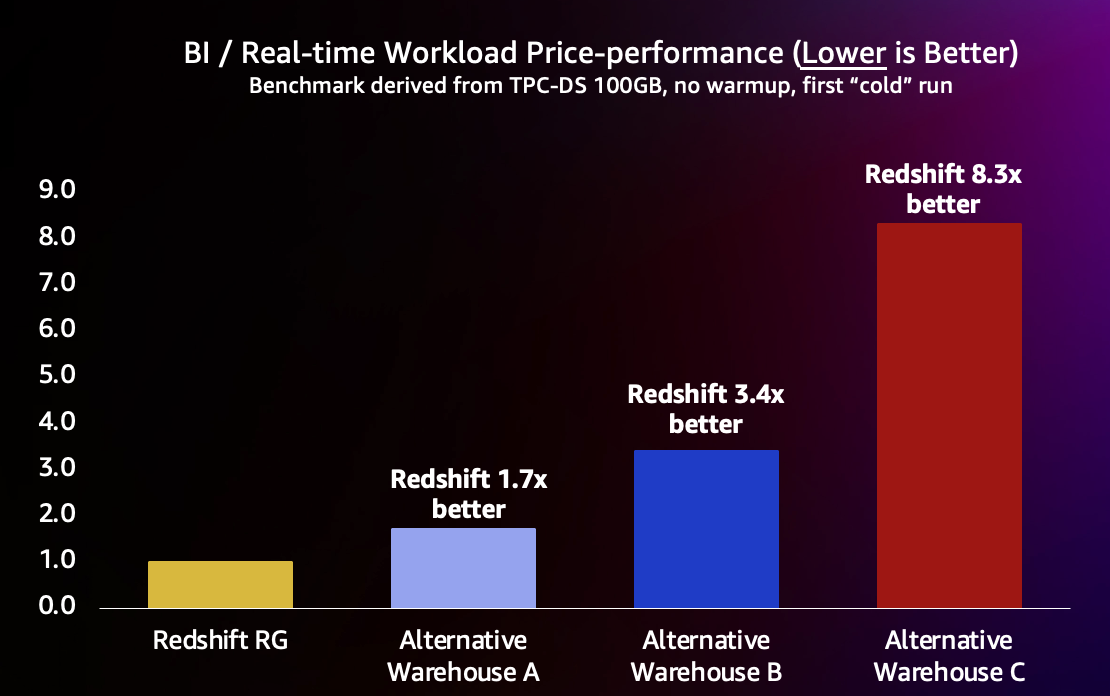
To illustrate the impact of this optimization, we simulated a short-running BI-like low-latency workload using a benchmark derived from the industry-standard TPC-DS benchmark. We ran the workload at a relatively small scale of 100 GB on a 3-node RG xlarge Amazon Redshift cluster. At this cluster size and scale, queries finish in milliseconds or single-digit seconds, representing the expected latencies of a typical BI dashboard. The derived TPC-DS benchmark includes 99 different queries that represent a mix of realistic business intelligence workloads, including reporting queries, ad hoc analysis, and data exploration patterns. For this test, we compared a single cold run of these queries on an Amazon Redshift RG cluster with the same run on comparable alternative cloud data warehouses. We launched the warehouses, loaded the data, executed a single run of 99 queries, and measured the total runtime and geometric mean of the queries. No other cluster warm-up or setup was done. This query performance improvement is hardware agnostic. It works on all supported Amazon Redshift hardware instance types, on RA3 and RG on provisioned clusters, and on the hardware that supports serverless workgroups.
The results are shown in table below and summarized in subsequent chart. With this new optimization, Amazon Redshift delivers the fastest runtime and geomean for these short queries at the lowest cost, with up to 8.3x better price-performance than the leading alternative data warehouses for new queries.
| . | Cost / hr | Runtime (sec) | Geomean (sec) | Runtime comparison | Geomean comparison | Geomean price-performance |
| Redshift 3-node RG.xlarge | $2.28 | 235 | 1.7 | baseline | baseline | baseline |
| Alternative Warehouse A | $3.00 | 327 | 2.3 | 1.4x slower | 1.3x slower | 1.7x more expensive |
| Alternative Warehouse B | $4.00 | 538 | 3.4 | 2.3x slower | 2x slower | 3.4x more expensive |
| Alternative Warehouse C | $6.00 | 907 | 5.5 | 3.9x slower | 3.2x slower | 8.3x more expensive |
Conclusion
The new query startup optimization in Amazon Redshift continues our commitment to fast performance across analytical workloads. By reducing compilation overhead, we’ve made BI dashboards and real-time analytics applications more responsive, while maintaining the query execution performance that Amazon Redshift is known for.
Because this optimization is automatically enabled for all Amazon Redshift customers, you can start experiencing these benefits immediately. No configuration changes or query rewrites are required. Your existing queries will run faster.
To learn more, visit Amazon Redshift. To get started, you can try Amazon Redshift Serverless and start querying data in minutes without setting up or managing data warehouse infrastructure. For more details on performance best practices, see the Amazon Redshift Database Developer Guide.
Find the best price performance for your workloads
The benchmark used in this post is derived from the industry-standard TPC-DS benchmark, and has the following characteristics:
- The schema and data come from TPC-DS unmodified.
- The queries are used unmodified from TPC-DS. TPC-approved query variants are used for a warehouse if the warehouse does not support the SQL dialect of the default TPC-DS query.
- The test includes only the 99 TPC-DS
SELECTqueries. It does not include maintenance and throughput steps. - A single power run was run with query parameters generated using the default random seed of the TPC-DS kit. The total runtime and geomean of that single cold run were used for the results in this post.
- Price performance is calculated as the geomean in seconds divided by 3,600 seconds per hour, multiplied by the cost of the warehouse per hour. The result is equivalent to the geomean cost per query. Published on-demand pricing is used for all data warehouses.
We call this benchmark the Cloud Data Warehouse Benchmark, and you can reproduce the preceding benchmark results using the scripts, queries, and data available on GitHub. It is derived from the TPC-DS benchmark and is not comparable to published TPC-DS results, because our test results do not comply with the specification.
Each workload has unique characteristics. If you’re starting out, a proof of concept is the best way to understand how Amazon Redshift performs for your requirements. When running your own proof of concept, focus on proper cluster sizing and the right metrics: query throughput (the number of queries per hour) and price performance. You can make a data-driven decision by requesting assistance with a proof of concept or by working with a system integration and consulting partner.
To stay current with the latest developments in Amazon Redshift, subscribe to the What’s New in Amazon Redshift RSS feed.