AWS Big Data Blog
How VNR AG built a serverless customer data platform to power BI reporting with Amazon QuickSight
This is a guest blog post by Marc Müller, David Amornvuttkul, and Amira Lotfy at VNR AG.
German publishing house VNR AG has a simple mission: to make expert knowledge accessible to everyone. Founded in 1976, the company has published more than 300 volumes in law, investment, health, and workplace environments. It provides customers with expert information, services, online communities, and portals, as well as training and conferences. As the company grew, groups within VNR served end customers via their own platforms and processes; in late 2018, VNR sought to consolidate and streamline operations with a self-service marketplace platform for omnichannel marketing and fulfillment services. The goal of this marketplace, dubbed Platform X, was to help small and midsize business owners scale through recurring customer relationships and subscription revenues using premium marketing automation and qualified marketing reach.
Learn how VNR built a new self-service business intelligence (BI) reporting system for Platform X using Amazon QuickSight in less than 10 months, with a team of four people.
The key challenges
Microsoft Excel is one of the popular and most convenient tools to quickly transform and analyze data and exchange results for many companies, including VNR. Although it works well with smaller amounts of data, the tool poses a wide range of limitations with larger datasets and complex analyses. Relying on data analysts to create complex SQL analytic queries and stage transformed data for consumption in Excel is not only hard to automate but also hard to scale. This was also a common practice and challenge at VNR.
The increased volume of data following the launch of Platform X impacted the quality of insights because it required increased computational power for complex data aggregation jobs. The increased load on transactional systems to support analytic workloads caused performance bottlenecks in VNR production databases.
Furthermore, data wasn’t discoverable across all systems due to lack of consolidation and missing data catalogs. It became impossible to provide business users with a 360-degree customer view. Exchanging analyses using Excel and email via data files in network storage often led to error propagation. The difficulty of scaling the reporting system resulted in stale insights, and risked losing business users’ trust. The entire workflow was extremely cumbersome, erroneous, and operationally inefficient.
Proposed solution
As VNR decided to offer their system to other publishers with Platform X, it was critical to have a scalable and reliable infrastructure backend and a seamless way to share trustworthy data analyses with a growing number of users backed by single source of truth. We had to address other limiting factors like the growing size of data or hardware constraints like compute or memory on an analyst’s local machine.
A scalable, dedicated BI system was imperative for the success of VNR’s growth strategy with Platform X. With the commitment to use the AWS Cloud, we decided to evaluate QuickSight as the BI front end service for our analytics system backed by a centralized customer data platform. The proposed solution was expected to deliver insights from our data via rich, interactive dashboards with a scalable, serverless, pay-as-you-go service. It would scale to thousands of users without any need for additional infrastructure capacity planning or management overhead.
Our journey to success with QuickSight
We compared different cloud-based BI tools including Qlik, Tableau, and Power-BI with QuickSight. QuickSight is a serverless cloud BI service that integrates seamlessly with other AWS services. QuickSight connected easily with our infrastructure on AWS, and didn’t require maintaining and securing any additional servers.
The license model of the other products would lead to a few thousand euros per month. Because we only needed about 20 report authors, and up to 400 readers to start with, QuickSight was a clear winner in our cost analysis: there are no up-front costs for licenses, and it has pay-as-you-go, per-user pricing for authors, and per-user or per-session pricing flexibility for readers.
One of the hidden champion attributes of QuickSight is the Super-fast, Parallel, In-memory Calculation Engine (SPICE). It’s incredibly fast and able to swiftly switch between different data aggregation layers and work on hundreds of millions of rows in one report with very low latency. This was a game-changer for us when we tested pivoting reports.
After learning about QuickSight features during the preliminary evaluation phase, we redefined the overall objective of the proposed solution to empower the product management and marketing teams with a self-service, modern BI system. The new end-to-end solution would use extract, transform, and load (ETL) processes to move the computation of data from our transactional fulfillment systems to a new analytics data pipeline with multiple storage layers making data available to the reporting system. The final building of reports would be done by analysts and business users with non-technical backgrounds.
With more than 250 readers using the VNR AG reporting system on a daily basis and 15 authors creating the reports, we embarked on our QuickSight journey by training a small team of 9–10 individuals. Previously, they found it very challenging to author and deliver reports and analyses on a frequent basis, especially with respect to the quality of the analyses. For simple reports, the team didn’t require extensive training and overcame their challenges very quickly with QuickSight.
Federated user access
We integrated our existing Microsoft Active Directory (AD) with QuickSight Enterprise version, enabling role-based access permissions and federated single sign-on (SSO) authentication to dashboards on the QuickSight console or embedded in our applications. User accounts and permissions are managed by our BI Administration team using AD group memberships. A QuickSight user can be an admin, author, or reader. Every author is the owner of their own reports and can decide who to share the reports with. This helped us publish reports selectively (such as only for management, developers, or certain marketing departments).
This integration also allowed fine-grained authorization to underlying datasets configured with row-level security (RLS) and column-level security (CLS) features included in QuickSight Enterprise version. We had complete control over which AD user or group gets access to what data and fields based on their role with the company. An immediate win was that we could also add external agencies to the AD and share reporting with an extra layer of data security. The embedding experience facilitated by the QuickSight JavaScript SDK and a rich set of QuickSight API operations greatly enhanced the end-user experience for both internal and external users.
From raw data to rich dashboards: Our ETL workflow
Before we can visualize data in QuickSight in a meaningful way, we run an ETL pipeline to preprocess the data, which is a combination of a few AWS services.
The core of our scalable BI system is our centralized customer data platform backed by Amazon Simple Storage Service (Amazon S3) storage along with Amazon Athena as our data access layer. This design separates the storage of our data from computation, improving the scalability of the ETL jobs and lowering the load on the production database for fulfillment. The data extraction layer from multiple data sources is implemented using AWS Fargate to first pull data from data sources outside of AWS and then to push raw data to Amazon S3. PySpark jobs on Amazon EMR clean up and process the data into a consumable format, and AWS Glue creates the Data Catalog for Athena. As consumable data lands in Amazon S3, AWS Step Functions steps are triggered with pre-calculations to generate data tiers for reporting with QuickSight and machine learning (ML) with Amazon SageMaker. The following diagram shows this ETL workflow and stages of data as it’s extracted, transformed, and staged for consumption by downstream applications.

The workflow is as follows:
- We prepare queries in our Oracle and MSSQL legacy database systems. These queries are run by Python scripts in scheduled Fargate tasks. For every query, we launch a Fargate task via an Amazon CloudWatch Events We use AWS Systems Manager Parameter Store to store database credentials and AWS Key Management Service (AWS KMS) to encrypt buckets in Amazon S3 using server-side encryption.
- Every task definition for Fargate tasks captures the incremental changes from a configurable timeframe (for example, the last hour) from the source databases and stores these as Parquet data files in Amazon S3.
- PySpark on Amazon EMR transforms the data. The transformation is mainly unifying column names, applying deduplication on certain datasets, hashing personally identifiable information, and feature engineering.
- After we have raw data transformed into an optimized consumable format, we trigger Step Functions using Amazon EventBridge scheduled expressions for rules to orchestrate creating two different data layers for reporting and ML with different data structures. Reporting needs a flat format and a lot of pre-calculations, whereas ML needs an event-based format. The use of Presto SQL in Athena from Step Functions allows for querying existing data and creating new tables with aggregated data.
The entire workflow is integrated with AWS Glue crawlers that discover the data format and schemas, group data into tables or partitions, and add the metadata to the Data Catalog integrated with Athena. As data moves through different layers, the crawlers also update partitions in the Data Catalog. This enables discovery and query capabilities as well as further ETL of data assets stored in the data lake in different data layers. This also allows us to query and combine data at every stage in QuickSight. At the end, data support teams curate, load, and refresh custom datasets that need complex queries into SPICE using the QuickSight API. The data is always up to date and can be visualized quickly by business users.
We defined a layering concept to allow the creation of reports for intended users based on their role, which enables them to drill down into specific data at different stages or layers that QuickSight connects to.
Layering concept: Customer data platform
Canned reports with pre-calculated data often need additional data during their usage. A limited data exploration capability can lead to insufficient insights and additional cycles to achieve the desired results. To add flexibility, functionality, and faster time to market, and ensure data integrity as well as consistent naming, we came up with a custom layering concept. This layering concept helped us reduce internal cost and freed up developers to focus on the core ETL pipeline. We started adding data analysts and even business users quite fast in the reporting process. One main benefit for us was enabling non-technical users from marketing and product management teams to easily create reports with QuickSight. The following diagram shows a simplified version of the layering concept for role-based data access from QuickSight.

QuickSight can connect to each data layer via Athena, and the authors have access to relevant data based on their role and group permissions set by the Active Directory administrator. More technically aligned data engineers can fetch raw data and canonical data from other layers and correlate it further with data in any existing reports. They can use QuickSight for data preparation using features like field formatting and calculations, and perform interactive data selection using parameters, filters, and more. Data analysts and other business users are presented with data that has higher level of abstraction and aggregation for simplifying the creation or update of reports based on their role without the need for any specialized skills for sorting the data. These users can also dive deep into the data presented to them with drill-down functionality, which removes the previous dependency on developers. With QuickSight Actions, we further enhanced dashboard interactivity and connected with related target visuals from other systems and datasets.
Another valuable QuickSight feature we adopted is ML Insights to generate forecasts without any technical expertise. This is possible due to the combination of the built-in ML forecasting algorithm in QuickSight, the fast SPICE layer, and the pre-calculated historical time series data in our customer data platform.
Business outcomes
Initially, the performance marketing reports were shared with corporate users via Excel on a weekly basis, with a lot of burden on two employees managing the data collection and curation of reports. Now, not only are these reports available on-demand for multiple in-house teams with relevant data that is refreshed hourly, but they also have interactive and drill-down capabilities for experienced users. Authors with advanced privileges can cross-reference marketing performance data with shipping, delivery, and payment data, and build new dashboards with enriched data to provide deeper, new insights.
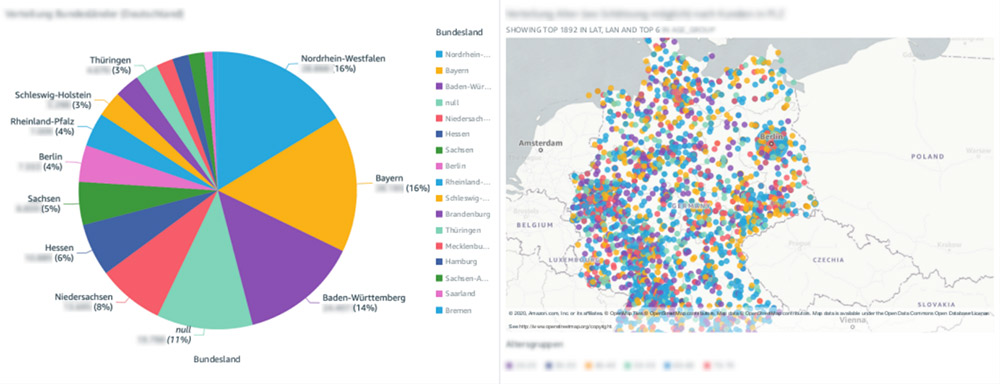
The new system greatly improved the ease of use and performance of recurring BI requests, such as showing all cancellations or trial revocations for a certain product in a given time frame. This led to increased productivity of marketing analysts and helped them review campaign results and develop new data-driven campaigns that can now be optimized based on demographics of customers (see the following visualizations).
Also, our product management team can get answers to most of their questions directly from the self-service reporting system. They can now see how the costs of a marketing channel correlate to created contracts, which contracts were first orders and which contracts were follow-up orders, and more. Product managers can analyze the complete customer lifecycle from lead generation via web, print, or telesales over the fulfillment process until a cancellation.
Forecasts generated with ML insights foster confident and faster business decisions by our product managers and marketing analysts. For example, they can see daily active users in the next 30 days (as in the following graph) or emerging search keywords. We can make data-informed decisions with sophisticated ML insights and point-and-click simplicity without any data science or ML background. We also use forecasts to estimate the starting point of experiments, like multivariate tests with new algorithms. We can choose a timespan for experiments where the most customers are active. Now we can shorten the duration of experiments and reach more customers to have a significant amount of test samples. This applies to the Platform X shop, which is integrated in apps and our other customer self-service portals.

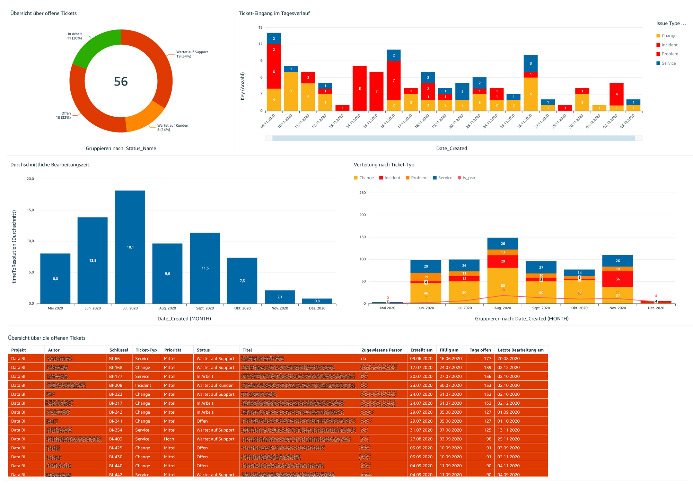
There are a few additional wins worth calling out that we didn’t foresee when we started. We can now cross-reference our issue tracking metrics in Jira from QuickSight dashboards directly using QuickSight actions. We frequently use this for reporting the ticket status for all departments that use the Jira service desk at VNR (see the following screenshot), and it has turned out to be a real timesaver.
Our data science team can also take advantage of the new BI system by generating ML evaluation reports such as heatmaps to find linear dependencies in the feature vector for a churn prediction model in SageMaker (see the following visualization).

All the siloed datasets that could only be merged using Excel, which in turn relied on macros, manual exports and copy/paste actions, are now at the fingertips of business users, delivering valuable insights without the heavy lifting. Moreover, performance marketing curated data as well as dashboards can be easily and securely shared with external agencies like online advertising and call centers via federated, fine-grained access.
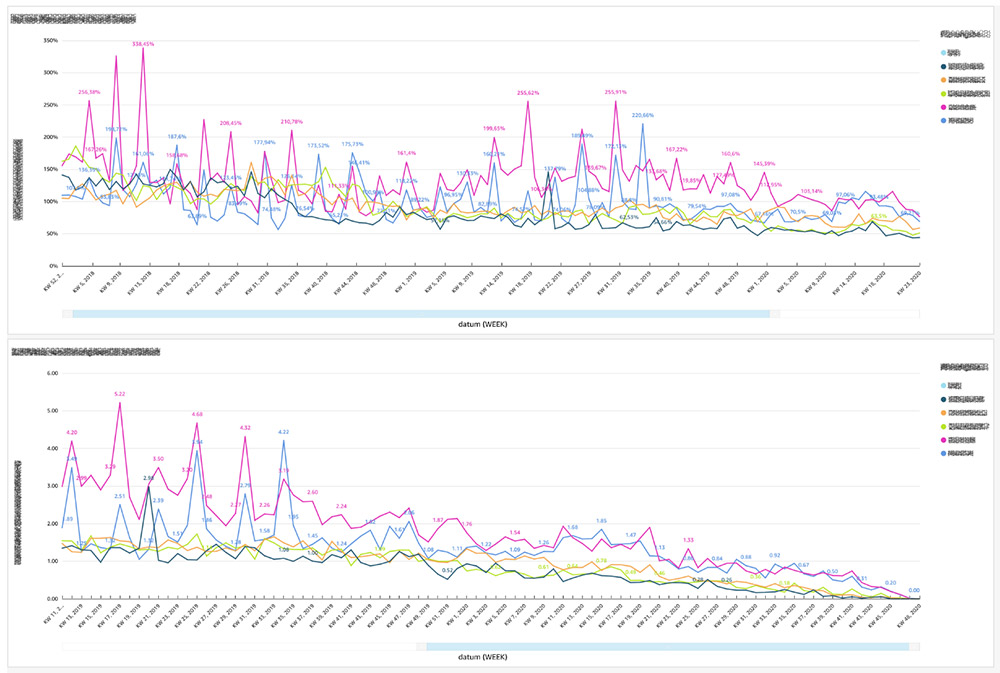
To summarize, VNR users and Platform X partners can view tailored, interactive, embedded dashboards showing customer demographics and results like orders, generated customer LTV (Lifetime Value) for new subscriptions, or even the best performing split tests during a webinar or a campaign (see the following graphs).
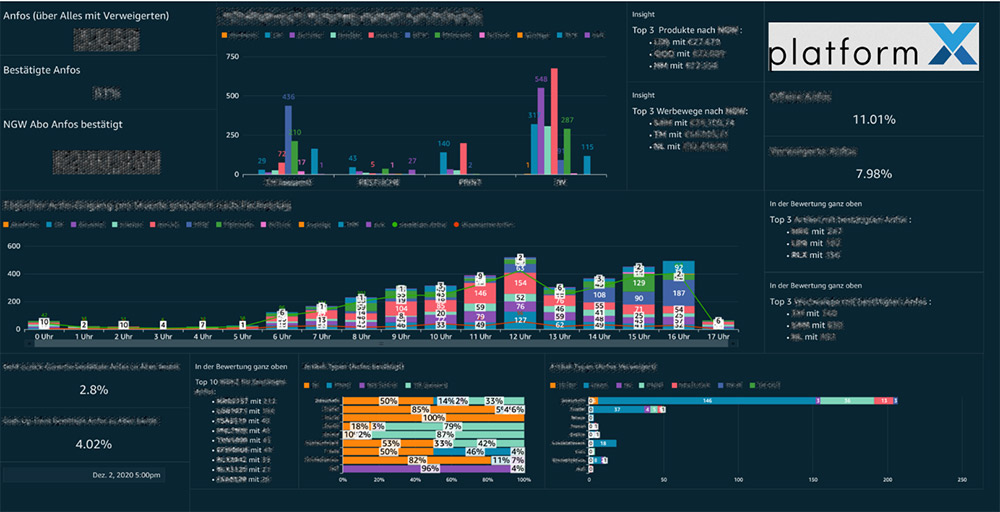
Additionally, everybody can use the QuickSight Mobile app with their smartphones for access to all dashboards optimized for seamless mobile experience. We can even project KPI dashboards including customer LTV on TV screens using the QuickSight API and SDK (see the following screenshot).
Most importantly, because the new BI system is decoupled from production databases, we have successfully removed the anticipated critical bottleneck that could prevent Platform X from scaling as usage increases.
Conclusion
VNR AG introduced a new, scalable and reliable modern BI-reporting system for more than 250 employees as well as half-a-dozen external agencies within 4 weeks. We used the AWS Glue Data Catalog and Athena as the serverless query engine to connect QuickSight to our centralized S3 data lake hydrated with data from multiple sources like Oracle and MSSQL transactional databases, a website tracking system, advertisement performance analytics, as well as manually created Excel and CSV files. The pay-as-you-go pricing model of the serverless services used was an additional benefit that allowed for fast integration and time to market without a cost explosion.
We have successfully built a layered customer data platform with a 360-degree view and millions of touchpoints for product management and marketing teams to build their own data selection and segmentation to draw useful insights from and improve their offerings and marketing campaigns. This historical data from disparate sources is the foundation for predictive analytics and paves the way for future innovation at VNR AG.
About the Authors
 Marc Müller is head of Data within the VNR AG and platform X. His team focusses on the cloud-based development of a customer data platform using AWS technologies. Prior to joining VNR AG, in December 2018, he co-founded the former AI startup goedle.io GmbH (2015), where he led as CTO the technical development of a SaaS product to predict customer behavior in subscription-based businesses and games. Before goedle.io he has worked as a researcher at the Fraunhofer IAIS, in Germany. Marc Müller has an overall track record of 10 years in the field of machine learning, cloud computing, and coordinating international industrial and research projects.
 David Amornvuttkul has been working at VNR AG and platform X as a Data Engineer since 2019. He is mainly responsible for the architecture of the ETL pipeline and the serverless data warehouse infrastructure. Before his role as Data Engineer, he worked for VNR AG as a software developer and lead a support team. He has more than 10 years of experience in data modeling and Oracle databases.
 Amira is a community passionate data integration engineer. In 2019, she joined the data team of VNR AG and platform X, as a data engineer, working on cloud-based development projects and ETL pipelines using AWS Technologies. Before moving to Germany, Amira worked for Teradata Egypt for 8 years where she gained experience in Data warehousing and Business Intelligence. She was involved in projects covering different customer industries like; banking, medical, telecommunication and government. She believes in the role of data in continuously developing the community.