AWS Business Intelligence Blog
How Verisk enhances catastrophe modeling with embedded analytics using Amazon Quick Sight
This is a guest post coauthored with Karthick Shanmugam and Srinivasa Are of Verisk.
Verisk is a leading provider of catastrophe modeling software as a service (SaaS) solutions used by major insurance and reinsurance companies worldwide. Our sophisticated analytical platforms help insurers, reinsurers, and risk managers assess the potential financial impact of large-scale disasters such as hurricanes, earthquakes, floods, and wildfires.
In this post, we share how we enhanced our catastrophe modeling platform by embedding Amazon Quick Sight analytics, helping our customers make more informed decisions through interactive risk visualization and analysis.
The challenge
Catastrophe modeling generates complex outputs including probable maximum loss (PML), average annual loss (AAL), and exceedance probability curves. Although these metrics are essential, raw model outputs alone don’t provide the context or clarity that underwriters, risk managers, and executives need for real-time decision-making.
Our platform needed to handle massive datasets containing thousands of simulated events and probabilistic loss distributions. Additionally, because catastrophe risk is highly location-dependent, we required robust geospatial analytics capabilities to map exposures, hazard zones, and loss footprints effectively.
As a SaaS provider serving hundreds of clients, we faced several technical hurdles. We needed a solution that could:
- Process large volumes of complex modeling data efficiently
- Provide advanced geospatial visualization capabilities
- Scale effectively while maintaining strict data isolation between tenants
- Integrate seamlessly into our platform with white-labeling options
- Deliver near real-time insights through interactive dashboards
- Remain cost-effective at scale
A key technical requirement was the ability to display exceedance probability (EP) curves and summary charts, along with the capability to show loss results by state, county, and zip code through interactive maps. Additionally, we needed to implement a multi-tenant solution that could effectively isolate data and dashboards between different clients.
Why Quick Sight
After evaluating several business intelligence (BI) tools, we chose Quick Sight for its unique combination of capabilities that aligned perfectly with our requirements.
As a fully managed, serverless BI service, Quick Sight seamlessly handles our large-scale datasets while integrating with our existing AWS ecosystem. The platform’s ability to embed interactive dashboards directly into our SaaS application, combined with comprehensive white-labeling support and APIs, helps us deliver analytics as a natural extension of the user experience.
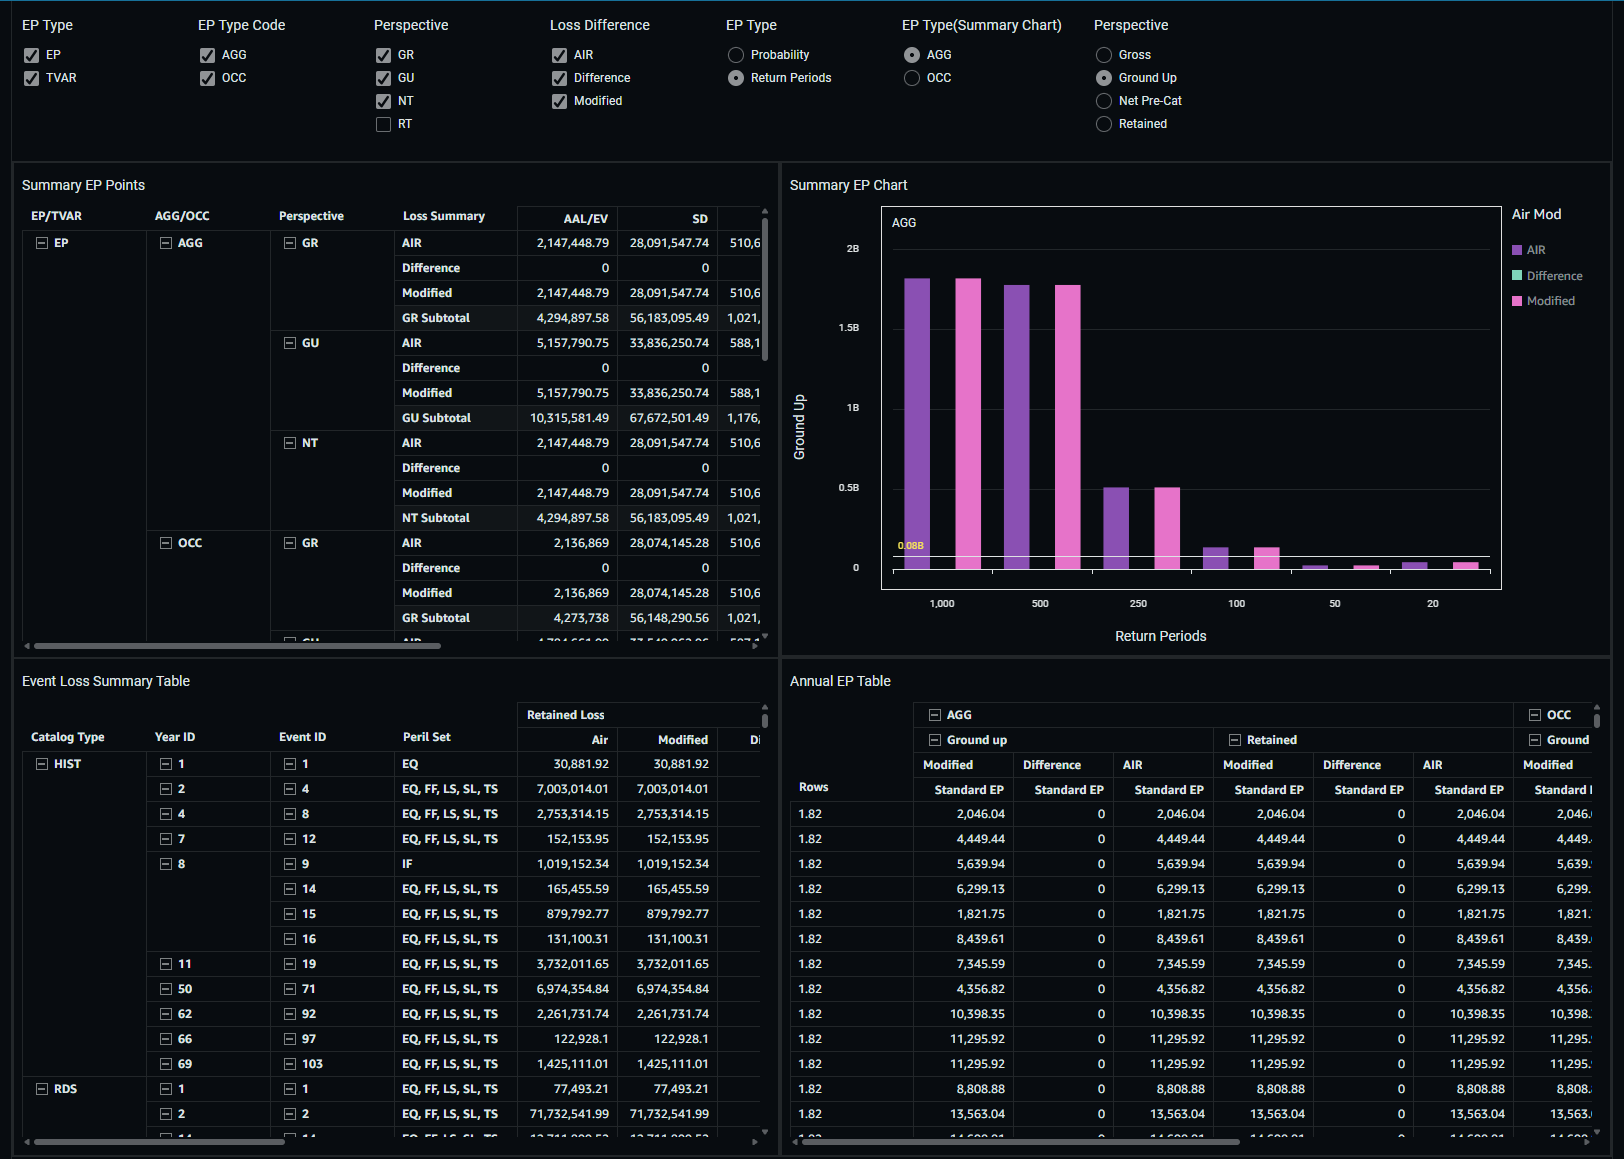
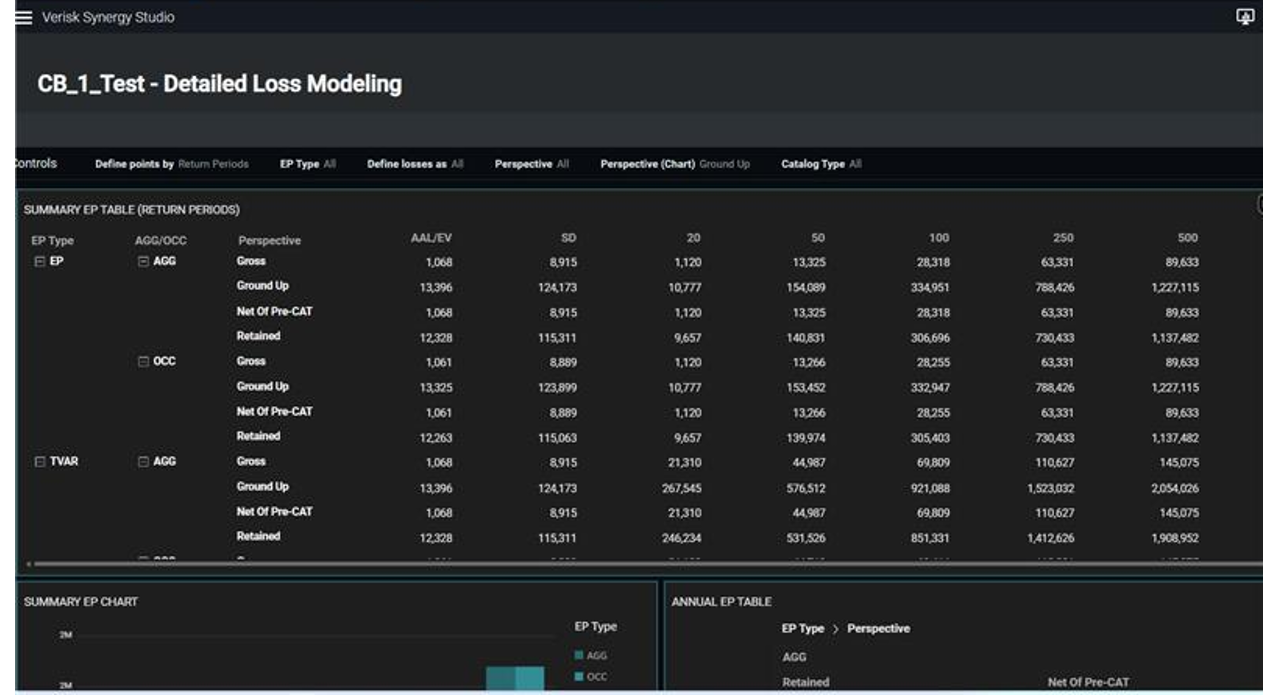
The dashboard shown above combines four purpose-built widgets, each representing a different loss lens into one cohesive BI view, making it easier for analysts to compare, explore, and interpret loss patterns.
Our proof of concept demonstrated the capabilities of Quick Sight in several key areas:
- Creation of EP curves and EP summary charts
- Geographic visualization of loss results at multiple levels
- Successful embedding of reports in our web UI
- Implementation of tenant isolation with Okta authentication
The geospatial visualization capabilities of Quick Sight proved particularly valuable for our catastrophe modeling use cases. Our users can now map exposures, hazard zones, and loss footprints directly within dashboards. The live connection to Amazon Redshift makes sure these insights remain current without requiring static extracts or manual refreshes.
Solution overview
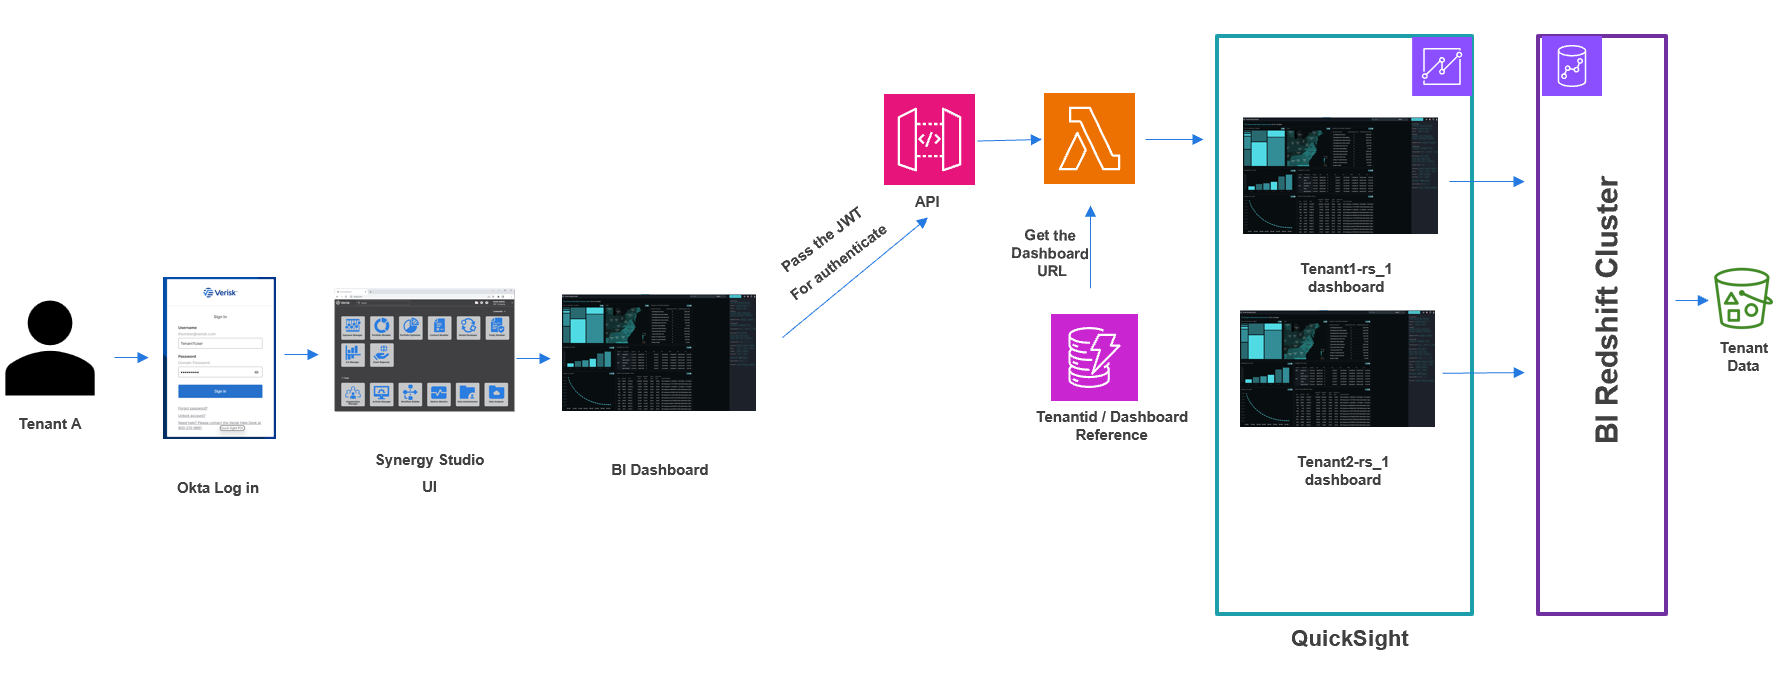
Our solution uses a streamlined architecture, shown in the following diagram, that supports efficient data processing and delivery. We store our modeling data in Amazon Simple Storage Service (Amazon S3), which is accessed through Amazon Redshift Serverless using Amazon Redshift Spectrum. This architecture provides the perfect balance of performance and scalability while maintaining cost-efficiency.
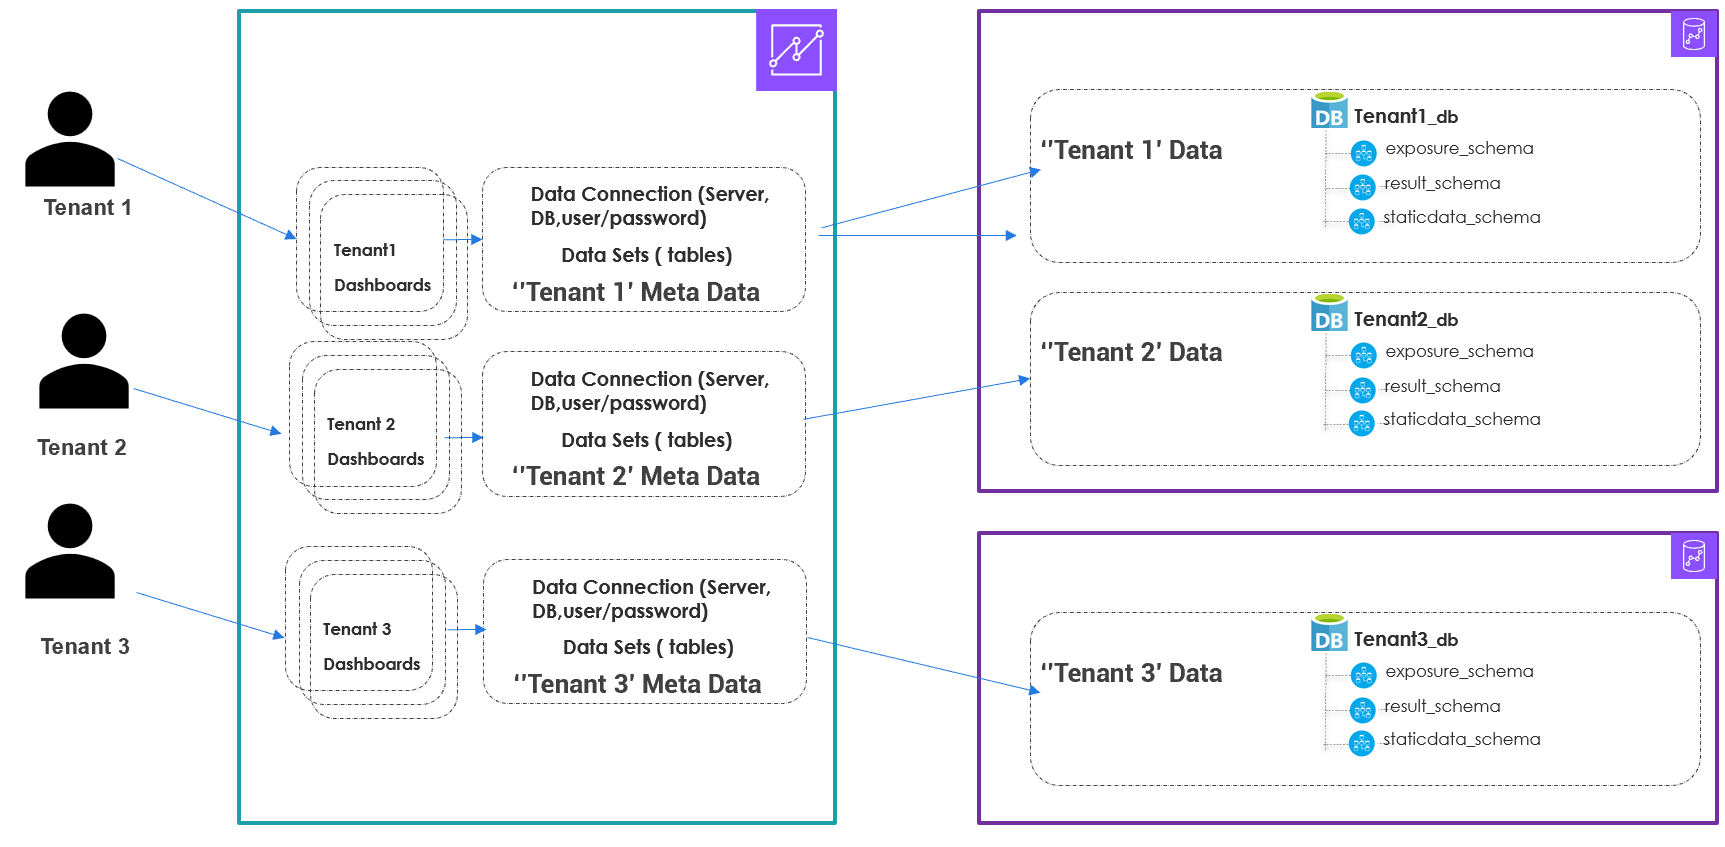
Our multi-tenant architecture, illustrated in the following diagram, facilitates complete data isolation between clients. Each tenant has their own dedicated database schemas for exposure, results, and static data. Quick Sight provides APIs to programmatically deploy separate datasets and dashboards for each tenant, helping us maintain the secured architecture in the BI layer as well.
The architecture consists of the following key components:
- A BI Redshift cluster that handles data processing
- Quick Sight dashboards customized for each tenant
- Integration with Okta for authentication
- An API layer for handling JWT authentication and dashboard URL generation
- Tenant-specific dashboard mapping and access control
The implementation includes a comprehensive tenant onboarding process that creates dedicated database structures and credentials for each new client. We’ve established a clear separation between shared and tenant-specific components, providing security and scalability.
Technical considerations and solutions
Our implementation required sophisticated solutions to handle complex data visualization needs. For EP curves and summary charts, we developed custom SQL solutions that provide dynamic and flexible data presentation. With the anonymous embedding features in Quick Sight, we can deliver secured analytics to a large number of users with less overhead. This approach helps us deliver detailed analytics through interactive dashboards that help our users understand risk patterns and make informed decisions.
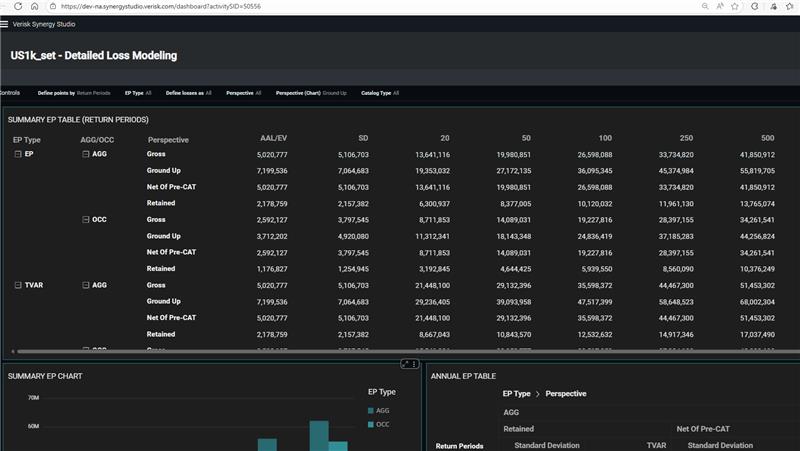
The image above shows an example of the Loss Dashboard as it appears for Tenant 1.
The geographic visualization capabilities we implemented enable multi-level analysis of loss data across states, counties, and zip codes. This granular mapping functionality gives our users comprehensive insights into geographical risk distribution and exposure patterns. We’ve also established a robust workflow integration system that includes preprocessing, processing, and postprocessing steps, facilitating efficient data flow from our loss calculation systems to the BI dashboards.
The dashboard above is the same Loss Dashboard displayed for a different tenant. Thanks to our multi-tenant architecture, each customer’s data remains completely separate – their dashboard will only show information they’re specifically authorized to view.
Our technical architecture emphasizes performance and scalability, with careful attention to data processing, optimization, and user experience. The integration between our loss calculation engine and Quick Sight dashboards provides seamless access to critical analytics, helping our users perform sophisticated risk analyses efficiently.
Benefits and results
The implementation of Quick Sight has transformed how our customers interact with catastrophe modeling data. Users can now drill-down results by geography, line of business, and construction type through interactive dashboards. This enhanced visibility enables better risk assessment and more informed decision-making.
The cloud-based, fully managed nature of Quick Sight reduced the operational overhead of maintaining BI infrastructure. Its session-based pricing model has proven cost-effective as we scale analytics access across our diverse user base of over 2,000 users. With the implementation of session-based pricing in Quick Sight, we are able to significantly reduce cost to our customer by 20–30%.
Security and compliance requirements are met through AWS Identity and Access Management (IAM), providing fine-grained control and strict data isolation in our multi-tenant environment. The seamless integration with other AWS services makes sure our application remains agile and can grow without compromising performance or security.
Looking ahead
As we evolve our platform, we’re working closely with the Quick Sight team to address specific requirements and enhance capabilities. The analytics functionality is now a core feature of our SaaS application, available to all users without additional charges.
We continue to work with AWS to address specific requirements, including enhanced dynamic table capabilities and additional EP chart functionalities. Our focus remains on improving the user experience while maintaining the robust security and performance standards our customers expect.
Our successful implementation of Quick Sight took just 4 months from evaluation to deployment, demonstrating the platform’s ease of integration and the strong support from the AWS team. As we look to the future, we’re confident that Quick Sight will continue to play an important role in helping our customers understand and manage catastrophic risk through powerful, interactive analytics.
Conclusion
Quick Sight has proven to be the ideal solution for embedding analytics into our catastrophe modeling platform. Its combination of scalability, security, embedding flexibility, and cost-efficiency helps us deliver powerful insights to our customers while maintaining the performance and reliability they expect from our services. As we continue to grow and evolve, Quick Sight remains a cornerstone of our analytics strategy, helping insurance industry professionals make better-informed decisions about catastrophic risk.
To learn more about implementing similar solutions, explore the following resources:
- Embedded analytics for Amazon Quick Sight
- Creating maps and geospatial charts
- Asset bundle operations
For additional hands-on experience, try the Quick Sight free trial to explore its embedded analytics capabilities for your use case.
About the authors
 Karthick Shanmugam is Head of Architecture at Verisk EES, leading the strategic design and evolution of the organization’s cloud and SaaS ecosystem. Focused on scalability, security, and innovation, he drives the development of architectural blueprints that align technology direction with business objectives. He is dedicated to building a modern, adaptable foundation that accelerates Verisk’s digital transformation and enhances value delivery across global platforms.
 Srinivasa Are is a Principal Data Architect at Verisk EES, with extensive experience driving cloud transformation and data modernization across global enterprises. Known for combining deep technical expertise with strategic vision, Srini helps organizations unlock the full potential of their data through scalable cost-optimized architectures on AWS—bridging innovation, efficiency, and meaningful business outcomes.
 Vetri Natarajan is a Specialist Solutions Architect for Amazon Quick Suite. Vetri has 18 years of experience implementing enterprise business intelligence (BI) solutions and greenfield data products. Vetri specializes in integration of BI solutions with business applications and enabling data-driven decisions.