AWS Compute Blog
Automating Amazon CloudWatch dashboards and alarms for Amazon Managed Workflows for Apache Airflow
This post is written by Mark Richman, Senior Solutions Architect.
Amazon Managed Workflows for Apache Airflow (MWAA) is a fully managed service that makes it easier to run open-source versions of Apache Airflow on AWS. It allows you to build workflows to run your extract-transform-load (ETL) jobs and data pipelines.
When working with MWAA, you often need to know more about the performance of your Airflow environment to achieve full insight and observability of your system. Airflow emits a number of useful metrics to Amazon CloudWatch, which are described in the product documentation. MWAA allows customers to define CloudWatch dashboards and alarms based upon the metrics and logs that Apache Airflow emits.
Airflow exposes metrics such as number of Directed Acyclic Graph (DAG) processes, DAG bag size, number of currently running tasks, task failures, and successes. Airflow is already set up to send metrics for an MWAA environment to CloudWatch.
This blog demonstrates a solution that automatically detects any deployed Airflow environments associated with the AWS account. It builds a CloudWatch dashboard and some useful alarms for each. All source code for this blog post is available on GitHub.
You automate the creation of a CloudWatch dashboard, which displays several of these key metrics together with CloudWatch alarms. These alarms receive notifications when the metrics fall outside of the thresholds that you configure, and allow you to perform actions in response.
Prerequisites
Deploying this solution requires:
- An AWS account with administrator access.
- Docker.
- The AWS Serverless Application Model (AWS SAM) CLI installed.
- One or more deployed MWAA environments.
Overview
Based on AWS serverless services, this solution includes:
- An Amazon EventBridge rule that runs on a schedule to invoke an AWS Step Functions workflow.
- Step Function orchestrates several AWS Lambda functions to query the existing MWAA environments.
- Lambda functions will update the CloudWatch dashboard definition to include metrics such as QueuedTasks, RunningTasks, SchedulerHeartbeat, TasksPending, and TotalParseTime.
- CloudWatch alarms are created for unhealthy workers and heartbeat failure across all MWAA environments. These alarms are removed for any nonexistent environments.
- Any MWAA environments that no longer exist have their respective CW dashboards removed.

EventBridge, a serverless event service, is configured to invoke a Step Functions workflow every 10 minutes. You can configure this for your preferred interval. Step Functions invokes a number of Lambda functions in parallel. If a function throws an error, the failed step in the state machine transitions to its respective failed state and the entire workflow ends.
Each of the Lambda functions performs a single task, orchestrated by Step Functions. Each function has a descriptive name for the task it performs in the workflow.
Understanding the CreateDashboardFunction function
When you deploy the AWS SAM template, the SeedDynamoDBFunction Lambda function is invoked. The function populates a DynamoDB table called DashboardTemplateTable with a CloudWatch dashboard definition. This definition is a template for any new CloudWatch dashboard created by CreateDashboardFunction.
You can see this definition in the GitHub repo:
{
  "widgets": [{
      "type": "metric",
      "x": 0,
      "y": 0,
      "width": 12,
      "height": 6,
      "properties": {
        "view": "timeSeries",
        "stacked": true,
        "metrics": [
          [
            "AmazonMWAA",
            "QueuedTasks",
            "Function",
            "Executor",
            "Environment",
            "${EnvironmentName}"
          ]
        ],
        "region": "${AWS::Region}",
        "title": "QueuedTasks ${EnvironmentName}",
        "period": 300
      }
    },
    ...
}
When this Step Functions workflow runs, it runs CreateDashboardFunction. This iterates through all the MWAA environments in the account, creating or updating its corresponding CloudWatch dashboard. You can see the code in /functions/create_dashboard/app.py:
for env in mwaa_environments:
        dashboard_name = f"Airflow-{env}"

        dashboard_body = dashboard_template.replace(
            "${AWS::Region}", os.getenv("AWS_REGION", "us-east-1")
        ).replace("${EnvironmentName}", env)

        logger.info(f"Creating/updating dashboard: {dashboard_name}")
        logger.debug(dashboard_body)

        response = cloudwatch.put_dashboard(
            DashboardName=dashboard_name, DashboardBody=dashboard_body
        )

        logger.info(json.dumps(response, indent=2))
Step Functions state machine
Here is a visualization of the Step Functions state machine:

Step Functions is based on state machines and tasks. A state machine is a workflow. A task is a state in a workflow that represents a single unit of work that another AWS service performs. Each step in a workflow is a state. The state machine in this solution is defined in JSON format in the repo.
Building and deploying the example application
To build and deploy this solution:
- Clone the repo from GitHub:
git clone https://github.com/aws-samples/mwaa-dashboard cd mwaa-dashboard - Build the application. Since Lambda functions may depend on packages that have natively compiled programs, use the
--use-containerflag. This flag compiles your functions locally in a Docker container that behaves like the Lambda environment:sam build --use-container - Deploy the application to your AWS account:
sam deploy --guided
This command packages and deploys the application to your AWS account. It provides a series of prompts:
- Stack Name: The name of the stack to deploy to AWS CloudFormation. This should be unique to your account and Region. This walkthrough uses
mwaa-dashboardthroughout this project. - AWS Region: The AWS Region you want to deploy your app to.
- Confirm changes before deploy: If set to yes, any change sets will be shown to you for manual review. If set to no, the AWS SAM CLI automatically deploys application changes.
- Respond to the remaining prompts per the SAM CLI command reference.
Updating the CloudWatch dashboard template definition in DynamoDB
The CloudWatch dashboard template definition is stored in DynamoDB. This is a one-time setup step, performed by the functions/seed_dynamodb Lambda custom resource at stack deployment time.
To override the template, you can edit the data directly in DynamoDB using the AWS Management Console. Alternatively, modify the scripts/dashboard-template.json file and update DynamoDB using the scripts/seed.py script.
cd scripts
./seed.py -t <dynamodb-table-name>
cd ..
Here, <dynamodb-table-name> is the name of the DynamoDB table created during deployment. For example:
./seed.py -t mwaa-dashboard-DashboardTemplateTable-VA2M5945RCF1Viewing the CloudWatch dashboards and alarms
If you have any existing MWAA environments, or create new ones, a dashboard for each appears with the Airflow- prefix. If you delete an MWAA environment, the corresponding dashboard is also deleted. No CloudWatch metrics are deleted.
Upon successful completion of the Step Functions workflow, you see a list of custom dashboards. There is one for each of your MWAA environments:

Choosing the dashboard name displays the widgets defined in the JSON described previously. Each widget corresponds to an Airflow key performance indicator (KPI). The dashboards can be customized through the AWS Management Console without any code changes.
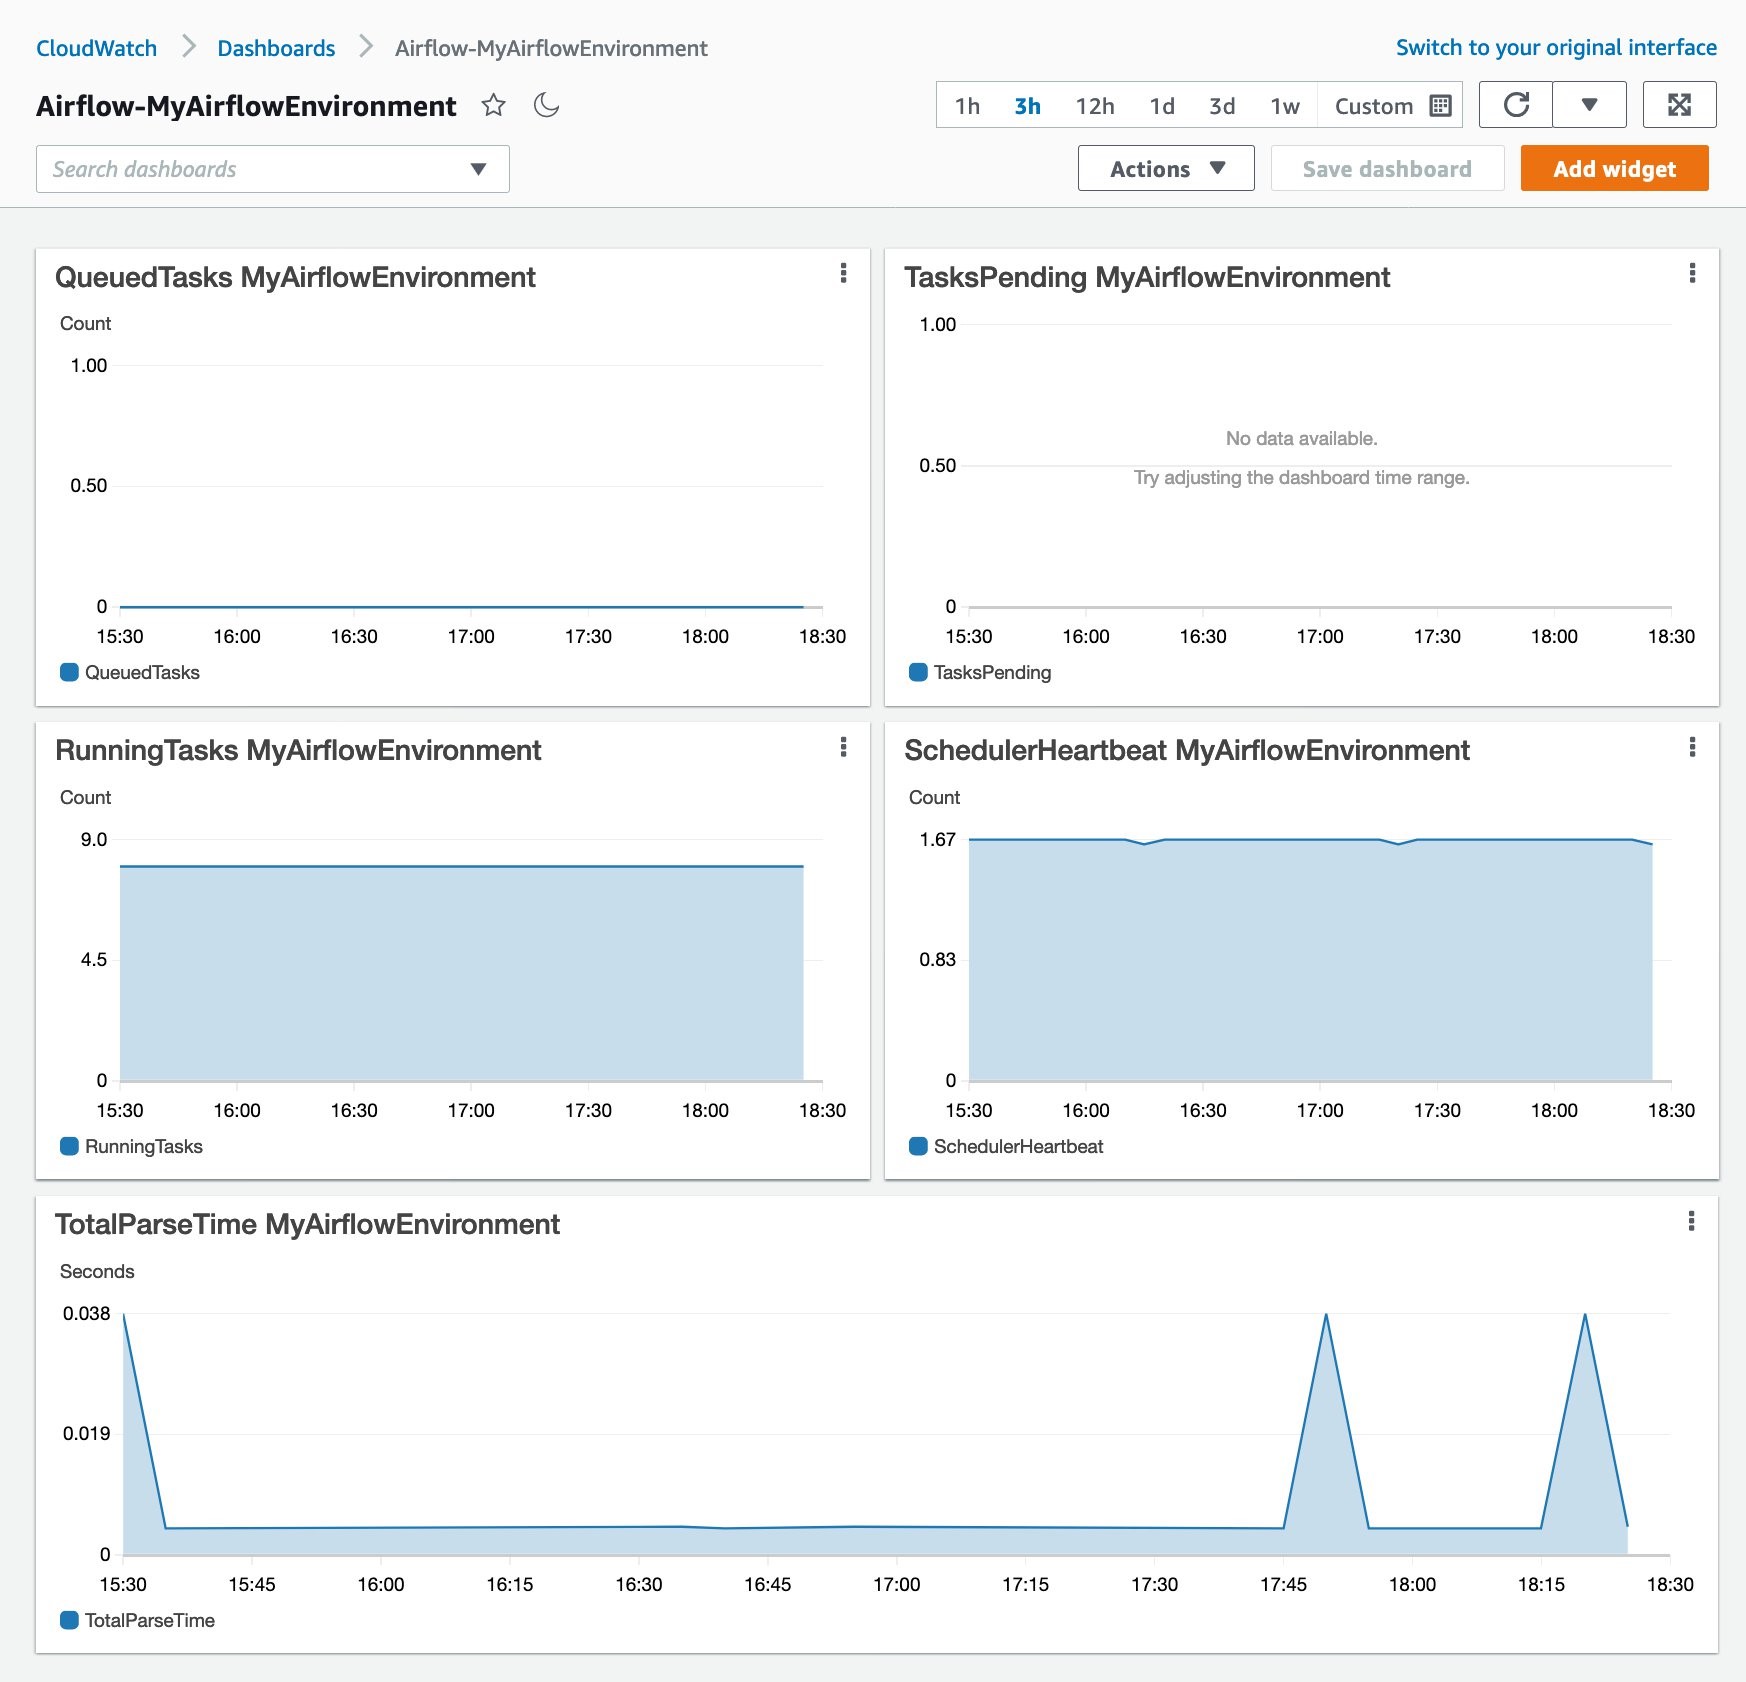
These are the metrics:
- QueuedTasks: The number of tasks with queued state. Corresponds to the
executor.queued_tasksAirflow metric. - TasksPending: The number of tasks pending in executor. Corresponds to the
scheduler.tasks.pendingAirflow metric. - RunningTasks: The number of tasks running in executor. Corresponds to the
executor.running_tasksAirflow metric. - SchedulerHeartbeat: The number of check-ins Airflow performs on the scheduler job. Corresponds to the
scheduler_heartbeatAirflow metrics. - TotalParseTime: Number of seconds taken to scan and import all DAG files once. Corresponds to the
dag_processing.total_parse_timeAirflow metric.
More information on all MWAA metrics available in CloudWatch can be found in the documentation. CloudWatch alarms are also created for each MWAA environment:

By default, you create two alarms:
{environment name}-UnhealthyWorker: This alarm triggers if the number of QueuedTasks is greater than the number of RunningTasks, and the number of RunningTasks is zero, for a period of 15 minutes.{environment name}-HeartbeatFail: This alarm triggers if SchedulerHeartbeat is zero for a period of five minutes.
You can configure actions in response to these alarms, such as an Amazon SNS notification to email or a Slack message.
Cleaning up
After testing this application, delete the resources created to avoid ongoing charges. You can use the AWS CLI, AWS Management Console, or the AWS APIs to delete the CloudFormation stack deployed by AWS SAM.
To delete the stack via the AWS CLI, run the following command:
aws cloudformation delete-stack --stack-name mwaa-dashboardThe log groups all share the prefix /aws/lambda/mwaa-dashboard. Delete these with the command:
aws logs delete-log-group --log-group-name <log group>Conclusion
With Amazon MWAA, you can spend more time building workflows and less time managing and scaling infrastructure. This article shows a serverless example that automatically creates CloudWatch dashboards and alarms for all existing and new MWAA environments. With this example, you can achieve better observability for your MWAA environments.
To get started with MWAA, visit the user guide. To deploy this solution in your own AWS account, visit the GitHub repo for this article.
For more serverless learning resources, visit Serverless Land.