AWS Compute Blog
Eliminating Java cold starts with AWS Lambda Managed Instances
A single cold start can push your Java Lambda function’s response time from milliseconds to seconds, enough to violate your p99 SLA, timeout a downstream service, and page your on-call. The Java Virtual Machine (JVM) performs best in long-running processes. Its Just-In-Time (JIT) compiler progressively optimizes code over thousands of invocations. Standard serverless execution environments recycle before the JVM reaches peak performance. This creates a tradeoff for latency-sensitive applications between cold-start penalties and runtime optimizations. For production services with p99 service level agreement (SLA) requirements, a single 14-second cold start spike can violate response time guarantees. It triggers downstream timeouts and degrades customer experience.
AWS Lambda Managed Instances changes this equation. As a capability of AWS Lambda, Managed Instances runs your functions on managed Amazon Elastic Compute Cloud (Amazon EC2) instances in your account and maintains JVM persistence across invocations. Connection pools, class hierarchies, and heap state persist across thousands of requests. This allows the JIT C2 compiler to complete optimizations like method inlining, escape analysis, and loop unrolling. The result: 18 to 30% better median latency and 3 to 30x better tail latency compared to Standard Lambda, as the benchmarks in this post demonstrate.
This post benchmarks four Java deployment modes across three workload types using 240,000 requests. The modes compared are Standard Lambda, AWS Lambda SnapStart, GraalVM Native Image, and Lambda Managed Instances. The workload types are CPU-bound, I/O + computation, and I/O-bound. This post presents benchmark results demonstrating Managed Instances delivering 30% better median latency and removing multi-second cold-start spikes on CPU-bound work after JIT warmup. It explains why these gains occur, maps each deployment mode to specific traffic patterns and cold-start tolerance requirements, and provides a decision framework for selecting the right approach for your workload.
Benchmarking setup
The benchmark runs all four deployment modes with identical Spring Boot 4.0.6 applications on Java 25 and AWS SDK v2. This configuration verifies fair comparison across modes. We tested three workloads: UC1 (PDF generation, CPU-bound), UC2 (data aggregation, I/O + computation), and UC3 (API orchestration, I/O-bound). The benchmark sends 240,000 requests using Artillery load testing at 33 RPS. Standard Lambda, SnapStart, and Native Lambda use 1024 MB (1 vCPU). Managed Instances uses c7i.xlarge instances with 2048 MB memory. Concurrency is tuned per workload (UC1=3, UC2=5, UC3=10) based on load testing to avoid thread contention. The benchmark measures p50, p99, and maximum latency across 10 runs of 2,000 requests each, with 5-minute cool-down between runs. The benchmark tracks JIT compilation metrics via Amazon CloudWatch Embedded Metrics Format. You can validate these results against Amazon API Gateway access logs, which confirm a <0.1% error rate. The GitHub repository contains complete source code, AWS Serverless Application Model (AWS SAM) templates, load scripts, and raw data. Performance claims in this post reference data from this benchmark methodology.
Figure 1 presents the architecture for all four deployment modes running in parallel against shared backend services.
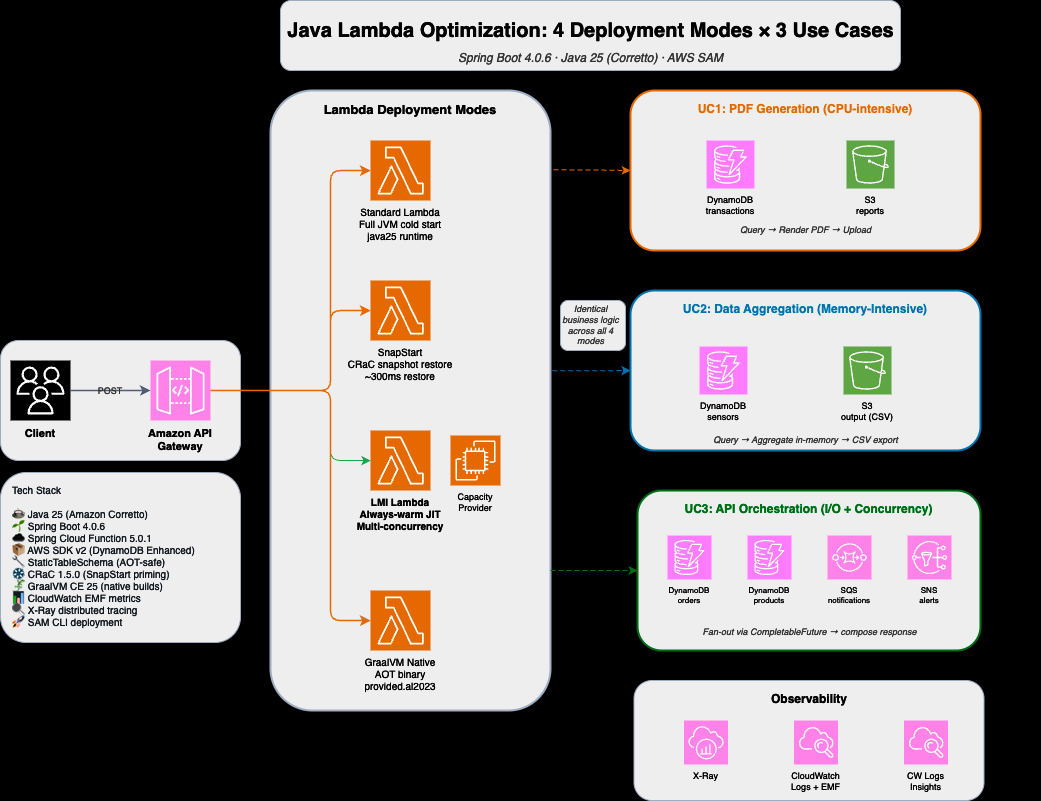
To reproduce these benchmarks or deploy the sample applications, refer to the GitHub repository. The repository contains complete SAM templates, Artillery load configurations, deployment instructions, and cleanup commands. This post focuses on benchmark results and analysis. The benchmark used the following tools and services:
- An AWS account with permissions to create Lambda functions, Amazon DynamoDB tables, Amazon Simple Storage Service (Amazon S3) buckets, Amazon Simple Notification Service (Amazon SNS) topics, and Amazon Simple Queue Service (Amazon SQS) queues
- Java 25 (Amazon Corretto recommended).
- Maven 3.9+.
- AWS SAM CLI v1.155 or later.
- Docker (for GraalVM native image builds) or alternative.
- Artillery for load testing.
- The GitHub repository with complete source code and SAM templates
Observing max latency
Managed Instances removes the extreme tail spikes characteristic of cold starts. Managed Instances delivers 27x faster maximum latency on CPU-bound workloads (UC1: 489 ms vs. 13,270 ms Standard). Mixed I/O + compute workloads see a 3x improvement (UC2: 3,644 ms vs. 11,174 ms Standard). I/O-bound workloads improve 30x (UC3: 309 ms vs. 9,237 ms Standard). We measured all results using the methodology described in Benchmarking setup.
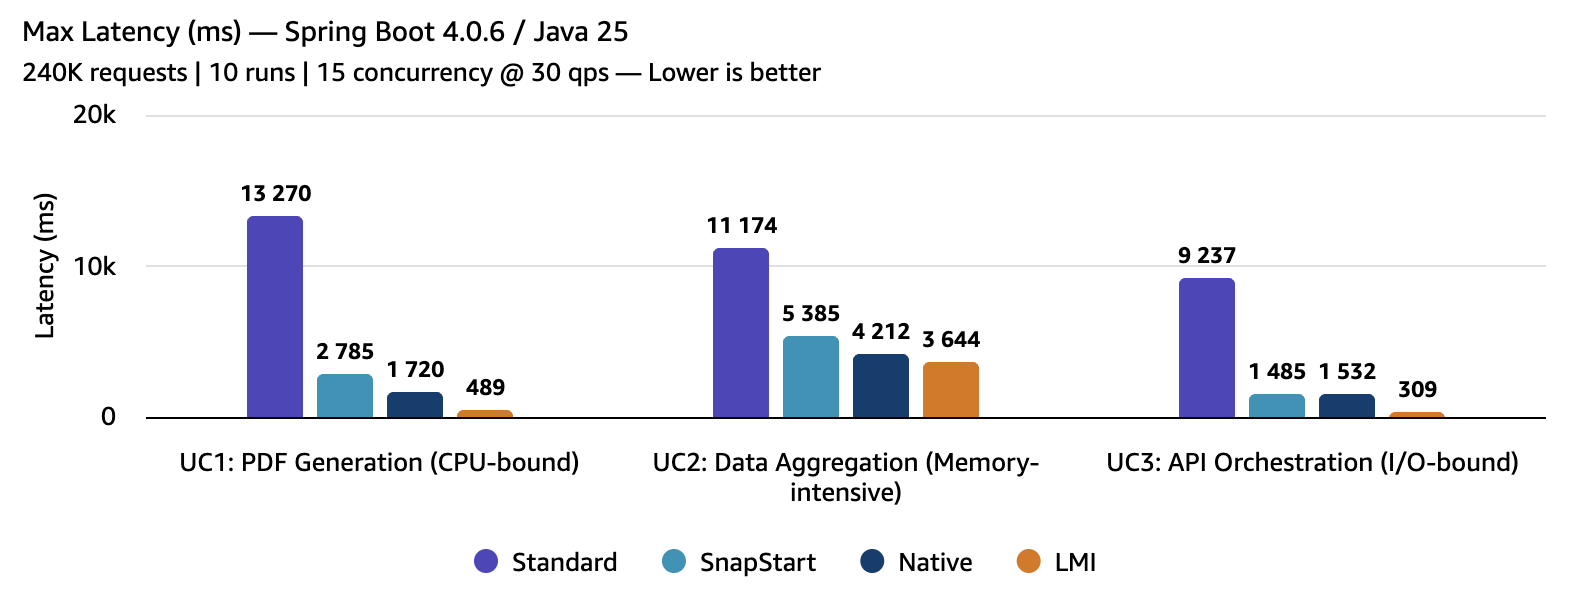
The Standard Lambda 13-second maximum on UC1 represents a full cold start. That cold start includes JVM boot, Spring context initialization, Amazon DynamoDB client setup, and the first PDF render. SnapStart reduces this to under 3 seconds by restoring from a Firecracker microVM snapshot. However, the restore process plus re-initialization of resources that cannot be checkpointed (network connections, random number generators) still adds latency. GraalVM Native starts in under 2 seconds because the ahead-of-time (AOT) compiled binary skips JVM boot entirely. The Managed Instances maximum of 487 ms is not a cold start; it’s the slowest warm request across 20,000 invocations. For production SLAs, a 14-second cold start spike on Standard Lambda violates most requirements, while Managed Instances removes that spike entirely.
Observing median latency (p50)
Lambda Managed Instances delivered the lowest median latency across all three workloads. Results demonstrate 30% faster median latency on CPU-bound workloads (UC1: 97 ms vs. 139 ms Standard). Mixed I/O + compute achieves a 19% improvement (UC2: 184 ms vs. 228 ms Standard). I/O-bound workloads improve 18% (UC3: 76 ms vs. 93 ms Standard).
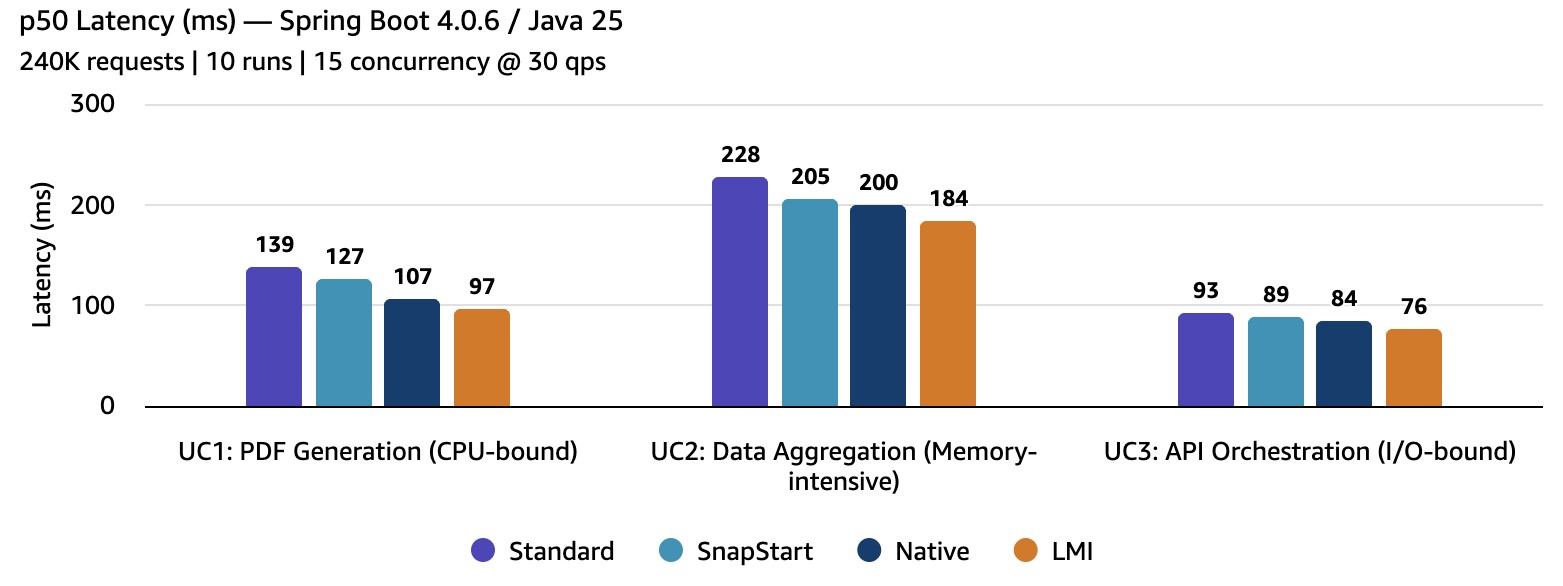
The improvement scales with CPU intensity because the JIT C2 compiler on persistent Managed Instances optimizes hot code paths that short-lived serverless environments never reach. On CPU-bound workloads (UC1), the JIT compiler has more opportunity to optimize tight loops in PDF rendering. On I/O-bound workloads (UC3), network latency to Amazon DynamoDB, Amazon SQS, and Amazon SNS dominates the request duration, so JIT optimization provides smaller gains.
Observing tail latency (p99)
Managed Instances showed even larger improvements at the tail of the latency distribution. The p99 improves 36% on CPU-bound workloads (UC1: 225 ms vs. 353 ms Standard). Mixed I/O + compute achieves a 41% improvement (UC2: 1,883 ms vs. 3,201 ms Standard). I/O-bound workloads improve 27% (UC3: 193 ms vs. 265 ms Standard).
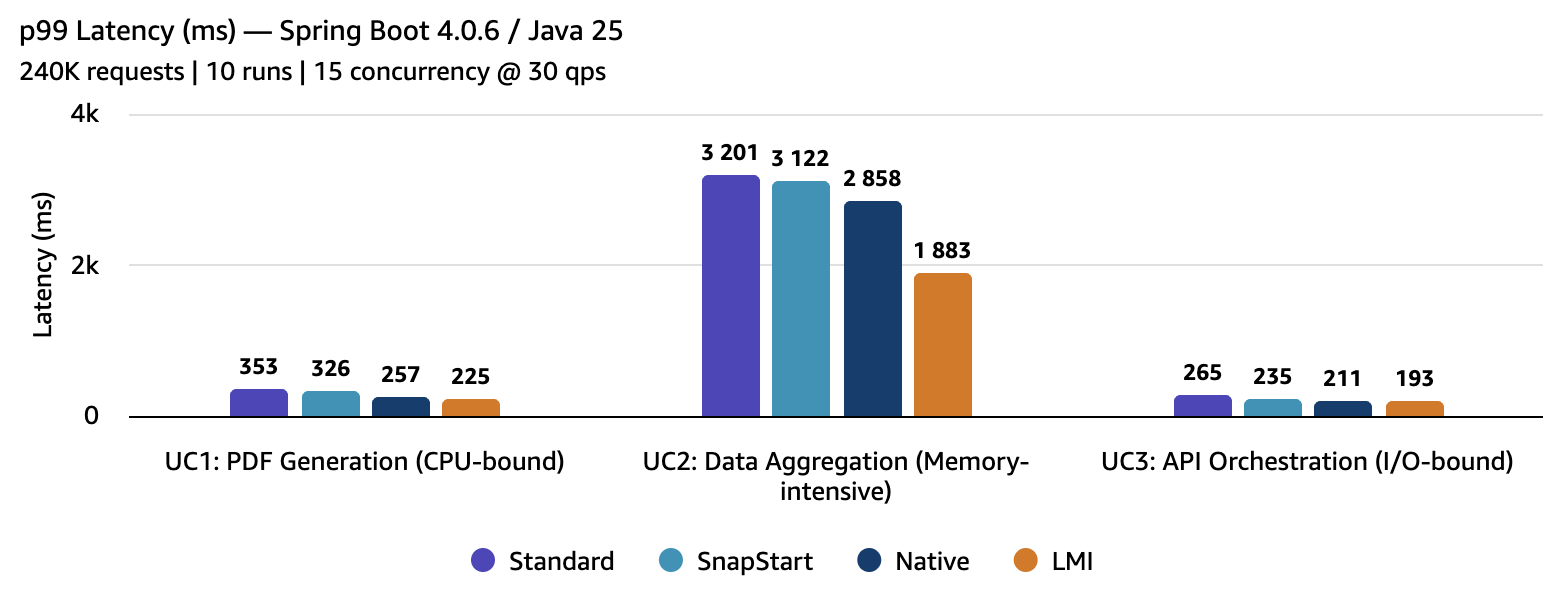
UC2 showed the largest p99 improvement (41%) because data aggregation combines DynamoDB queries, returning hundreds of records with in-memory statistical computation and Amazon S3 uploads. Standard Lambda environments that haven’t fully warmed their JIT produce significantly slower responses at the tail. The persistent JIT optimization (-Xms512m -Xmx1408m) with G1 garbage collection (GC) and explicit heap sizing on Managed Instances both contribute to tighter tail latency distribution. For services with SLAs on p99 response time, this reliability improvement matters more than median performance. For workloads with significant heap pressure, tuning -XX:MaxGCPauseMillis and monitoring GC logs can further tighten tail latency.
Why Lambda Managed Instances is faster: JIT compilation
The JVM’s Just-In-Time compiler works in tiers. The C1 compiler performs initial compilation quickly with basic optimizations. The C2 compiler profiles execution over hundreds of invocations and then applies aggressive optimizations: method inlining (eliminating function call overhead), escape analysis (allocating objects on the stack instead of the heap), loop unrolling (reducing branch overhead), and vectorization (processing multiple data elements in a single CPU instruction).
The following table presents JIT warmup progression using java.lang.management.
CompilationMXBean emitted through Amazon CloudWatch Embedded Metrics Format. We collected this data from a 1,500-request sustained load test on UC1 (PDF generation):
| Phase | Invocation | Avg Latency | What’s Happening |
| First requests (application init) | 1 | ~2,400ms | JVM boot, spring context creation, SDK client setup |
| Early requests (C1 compiled) | 2-100 | ~145ms | C1 compiler active. App is functional, but not optimized |
| Steady state (C2 optimized) | 1000+ | ~38ms | C2 optimizations completed |
The first invocation includes one-time application start costs: class loading, Spring context initialization, and DynamoDB client construction. These costs are unrelated to JIT compilation and occur on any deployment mode.
Once C1 compilation stabilizes during early invocations, latency reaches approximately 145ms. This is the baseline compiled performance. Over the next several hundred invocations, the C2 compiler profiles hot code paths and applies optimizations. By invocation 1,000, latency drops to 38ms. This represents a 3.8x improvement from JIT optimization alone.
Standard Lambda environments typically recycle before C2 completes its optimization passes. On Managed Instances, concurrent requests share the same JVM. This accelerates JIT profiling: three concurrent requests generate three times the method invocation data for the C2 compiler to optimize. The C2 compiler profiles execution patterns across all concurrent requests. It identifies hot code paths faster and applies optimizations sooner than single-concurrency environments.
What this means: CPU-bound workloads see the largest gains (30% faster median latency on UC1) because the JIT compiler has more opportunity to optimize tight loops and method calls. I/O-bound workloads see smaller gains (18% faster on UC3) because network latency to DynamoDB, SQS, and SNS dominates request duration. The JIT compiler still optimizes your code, but the network time remains constant across all deployment modes.
Choosing the right mode
No single mode wins in every scenario. The right choice depends on your traffic pattern, cold-start tolerance, team expertise, and operational complexity budget.
Lambda Managed Instances is ideal for steady-state traffic patterns above 5 requests per second with low cold-start tolerance (p99 SLA under 500 ms). Best for workloads with predictable, sustained traffic that need low latency with zero cold starts. Managed Instances excels at CPU-bound workloads where JIT optimization compounds.
SnapStart works well for variable traffic patterns where cold-start reduction matters. Choose this as the default for Java Lambda functions. SnapStart reduces cold starts with minimal code changes (add CRaC priming). You have no additional infrastructure to manage. Works with the existing Lambda scaling model.
GraalVM Native Image works well for bursty traffic patterns with strict cold-start tolerance (sub-second cold starts required). Ideal if your team can invest in AOT compatibility (reflection configuration, build pipeline). This mode offers a smaller memory footprint. Requires testing for SDK compatibility.
Standard Lambda is the baseline for low-traffic or burst workloads where cold starts of 6-14 seconds are acceptable. Works well when invocation frequency is low enough that per-request billing is cheaper than fixed instance costs, or when operational simplicity is the top priority.
For example, if you run a Spring Boot API handling 100 requests per second with a 400 ms p99 SLA, Lambda Managed Instances reduces your p99 from 353 ms (cutting it close) to 225 ms (comfortable margin) and removes the multi-second cold start spikes that violate your SLA entirely.
| Dimension | Standard | SnapStart | Native | Managed Instances |
| Cold start | 6-14 s | 2-7 s | 800 ms – 2 s | None |
| Warm p50 (CPU-bound) | 139 ms | 127 ms | 107 ms | 97 ms |
| Tail latency | Worst | Better | Good | Fastest |
| Error rate | Low | Low | Higher (SDK compat) | Low |
| Operational complexity | Lowest | Low | High (build pipeline) | Medium (VPC, sizing) |
| Burst scaling | Fastest | Fastest | Fastest | Slower (capacity provider) |
| Migration effort | None | Low (add CRaC priming) | High (AOT compat, reflection configuration) | Medium (capacity provider, VPC, thread safety) |
| Memory efficiency | Good | Good |
Lowest (125-154 MB) |
Fixed per instance |
Lambda Managed Instances supports Graviton4 (arm64) instances, which offer approximately 20% better price-performance based on AWS published Graviton4 benchmarks. These benchmarks use x86_64 for consistency across all four modes (GraalVM native cross-compilation to arm64 adds complexity). The arm64 parallelization characteristics could shift the performance curves for longer-lived deployment modes like Managed Instances in ways worth exploring in a future post.
Cost considerations
Lambda Managed Instances uses instance-based pricing rather than per-invocation billing. For steady-state workloads above approximately 9 requests per second, the fixed instance cost is lower than equivalent Standard Lambda GB-second charges. You can use the official pricing calculator to compare Managed Instances and standard Lambda costs.
Try it with your runtime version
These benchmarks use Java 25 with Spring Boot 4.0.6. The GitHub repository also includes configurations for Java 21 with Spring Boot 3.x. The repository README walks you through deployment, load testing, and collecting your own metrics.
Conclusion
This post demonstrates how Lambda Managed Instances solves a fundamental Java-on-serverless mismatch. The JVM’s JIT compiler needs time to optimize hot code paths. Standard Lambda recycles environments before the JVM reaches peak optimization. Managed Instances keeps the JVM alive across invocations, allowing the C2 compiler to reach peak optimization. The benchmarks show the impact. In these benchmarks, Managed Instances delivered 18 to 30% faster p50 latency than Standard Lambda. Tail latency improved 27 to 41% at p99. Maximum response times dropped 3 to 30x on CPU-bound workloads. The 3.8x improvement from JIT optimization alone shows what’s possible when the runtime has time to complete its work.
For more information, refer to the Lambda Managed Instances documentation. The GitHub repository contains the complete benchmark code, SAM templates, and deployment instructions. Share your results in the comments and let the community know how Managed Instances performs on your workloads. To delete all benchmark resources and avoid ongoing charges, run the cleanup commands documented in the GitHub repository README.