AWS Compute Blog
Uncover new performance insights using Amazon detailed performance statistics on Windows
The primary storage solutions for EC2 Windows instances, Amazon EC2 Instance Store and Amazon Elastic Block Store (Amazon EBS) , now provide detailed performance statistics for real-time monitoring. Real-time monitoring enables you to gain visibility into key performance metrics, such as latency, throughput, and IOPS, allowing you to detect and address potential bottlenecks or issues proactively.
In this post, we explore how to use detailed performance statistics for both Amazon EBS and Instance Storage on Windows environments. These new metrics provide sub-minute granularity, offering real-time visibility into storage volume performance across both storage types. You can access these statistics directly from your Amazon EBS NVMe/Amazon Instance Storage NVMe device attached to the Amazon Elastic Compute Cloud (Amazon EC2) instance and use them to monitor I/O performance at the storage level. We also provide examples of how to use these statistics to quickly assess EBS volume/Storage health and identify performance bottlenecks, which improve both the reliability and performance of your applications. When creating or attaching EBS volumes, enable encryption at rest using AWS Key Management Service (AWS KMS) to protect your data. For more information, see Amazon EBS encryption in the Amazon EC2 User Guide.
Solution overview
Using the new Amazon EC2 Instance Store/Amazon Elastic Block Store (Amazon EBS) detailed performance statistics at the instance-level, this sample solution enhances observability and troubleshooting capabilities for latency-sensitive applications running on EC2 Nitro instances. We use the new nvme_amzn.exe tool to collect high-frequency statistics on I/O operations, latency, and queue length, enabling proactive troubleshooting.
As examples of how to use these granular metrics, this solution demonstrates how to validate the responsiveness of local storage and EBS volume, so that you can quickly identify any I/O interruptions. This solution helps you identify storage performance bottlenecks, which can be used to optimize the local storage and EC2 instance configurations for your workloads.
Prerequisites
This solution involves setting up an EC2 Nitro instance and an attached local storage to access detailed performance statistics for the local storage. This is a setup you likely already have if using Amazon EC2. To deploy the required components, you must complete the following steps:
- Launch an EC2 Nitro instance (or use an existing Nitro instance), and connect to it via Remote Desktop Protocol (RDP).
- Verify that your EC2 Windows instance includes AWS NVMe driver version 1.7.0 or later installed by following identify your driver type
- Identify the NVMe device associated with the local storage/EBS volume for which you want to query the stats. You can run the
Get-Diskcommand in PowerShell to output all NVMe devices on the instance. For more information, see Map NVMe disks on Amazon EC2 Windows instance to volumes.
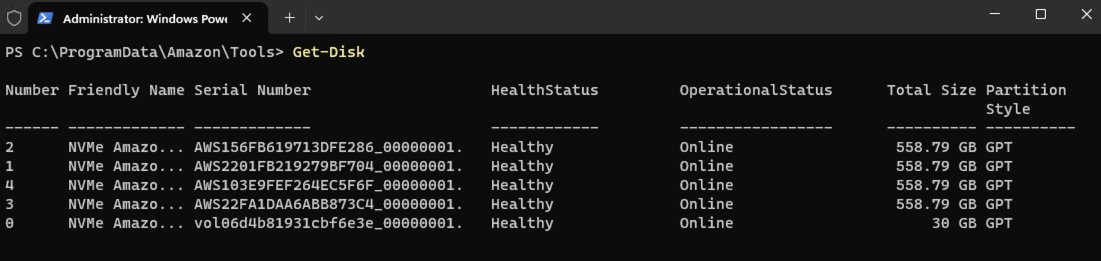
For this demonstration, we’ll monitor two storage volumes:
- EBS volume (Disk 0): Serial Number vol01234567890abcdef_00000001.
- Local storage (Disk 1): Serial Number AWSEXAMPLE1234567890_00000001.
- Ensure that
nvme_amzn.exeis present inC:\ProgramData\Amazon\Toolsby default. - Use the
nvme_amzn.exetool, with administrator privileges, and pass the disk number as a parameter with different command. The returned output looks like the following.
Administrator: Windows PowerShell:
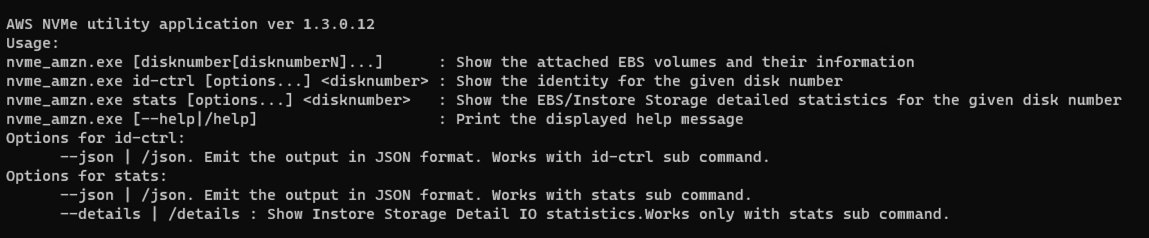
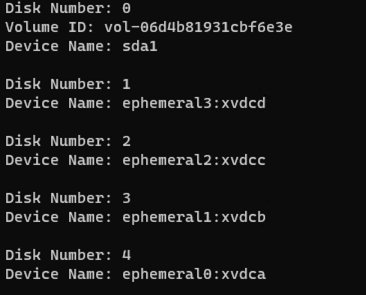
Users can see the EBS volumes devices mapping by default without passing the disk number as a parameter

Users can view the specific device mapping by passing disk numbers or a single disk number as a parameter.
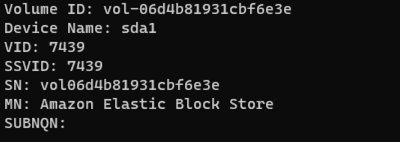
Users can see the nvme controller details by using id-ctrl and pass the disk number as a parameter (JSON output can be retrieved by providing the --json or /json parameter to the tool)
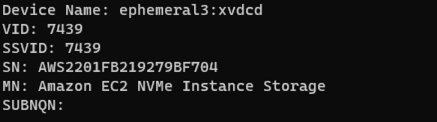
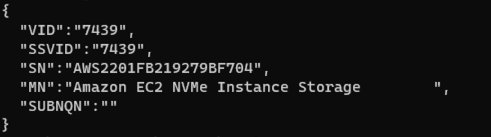
Users can see the performance statistics for EBS/EC2 local storage volume by using stats and pass the disk number as a parameter (provide the --json or /json parameter to retrieve JSON output).
In addition, for EC2 local storage volume, by providing the --details/-d option, you can see the histogram of 5 different IO bands: (0, 512 Byte], (512B, 4KiB], (4KiB, 8KiB], (8KiB, 32KiB], (32 KiB, MAX].
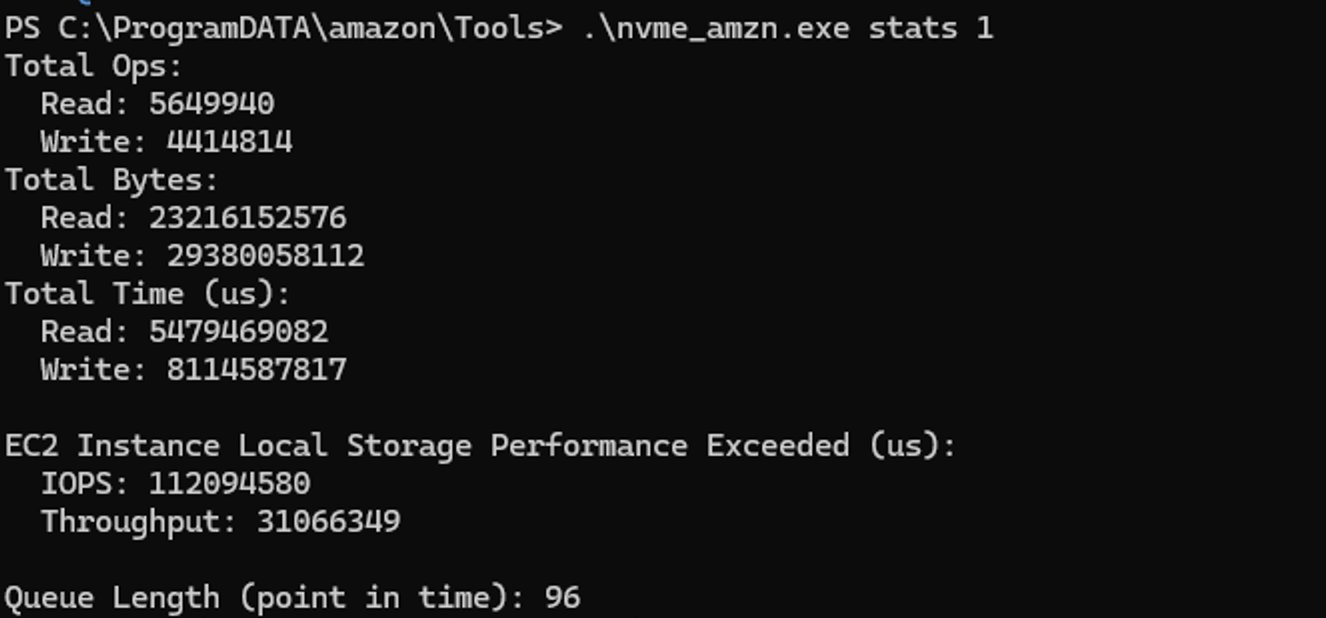
The following example shows NVMe log output with cumulative statistics. The statistics indicate read/write operations, bytes transferred, and time spent processing operations (in microseconds). They also show the number of microseconds in which the application attempted to exceed the Amazon EBS or Amazon EC2 Instance Local Storage IOPS/throughput limits
EBS volume: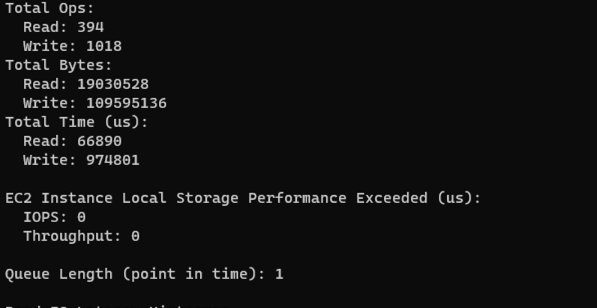
EC2 local storage volume: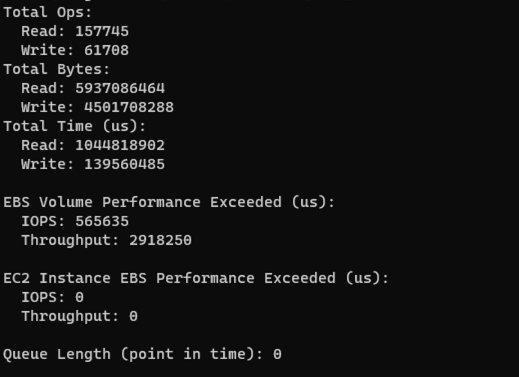
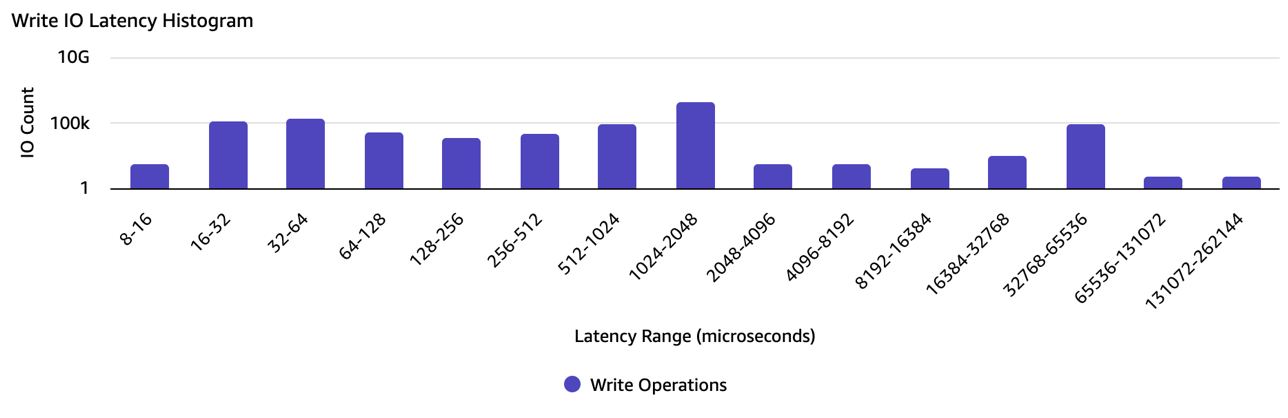
Also included in the following figures are read and write I/O latency histograms, with each row representing the total number of I/O operations completed so far within a specific bin of time (in microseconds).
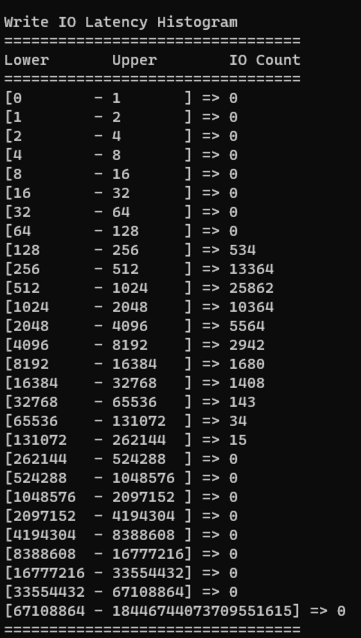
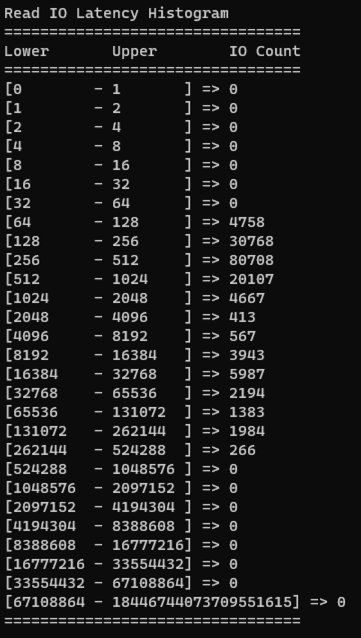
These statistics are presented as cumulative counters up to the time at which the command is executed. The command can be run at the desired interval, for example, every 15 seconds, with each subsequent output reflecting the updated cumulative totals for the metrics. Calculating the difference in the statistics across the last two outputs allows you to derive insight into the instance storage profile over the given 15 second period.
Deriving insights from the Amazon Instance Storage/EBS volume detailed performance statistics
You have set up monitoring using these detailed performance statistics, now we can demonstrate the different ways you can use these statistics.
As mentioned in the preceding section, you can use the detailed statistics to view I/O latency histograms to observe the spread of I/O latency within the period. You can use the read/write operations and time spent statistics to calculate the average latency. Using the detailed statistics allows you to view the average latency at a sub-minute granularity.
Here are four examples for you to use the statistics to shed light on key performance metrics.
Scenario 1: Identifying unresponsive state of an EBS volume
In this scenario, we discuss how to use Amazon EBS detailed performance statistics to observe when an EBS volume isn’t responding to I/O operations. If you observe multiple intervals where your volume is unresponsive, then you can take actions, such as replacing the affected volume or stopping and restarting the instance to which the volume is attached. In most cases, when your volume becomes unresponsive, Amazon EBS automatically diagnoses and recovers your volume within a few minutes.
To identify if your volume is unresponsive, you can use the following steps to determine whether I/O disrupted on your volume:
- Identify the EBS volume’s NVMe device to troubleshoot
- Collect stats for the device at the desired intervals
- Compare the stats to check if the EBS volume is unresponsive
Step 1: Identify the EBS volume’s NVMe device to troubleshoot
1. Identify the NVMe device associated with the EBS volume on the instance by using the nvme_amzn.exe tool.

Step 2: Collect stats for the device at the desired intervals
1. Collect the Amazon EBS detailed performance statistics directly from the device by using the nvme_amzn.exe tool:
Step 3: Compare the stats to check if the EBS volume is unresponsive
1. From the output, consider the following three fields for this scenario: Total Read Ops, Total Write Ops, and Queue Length.
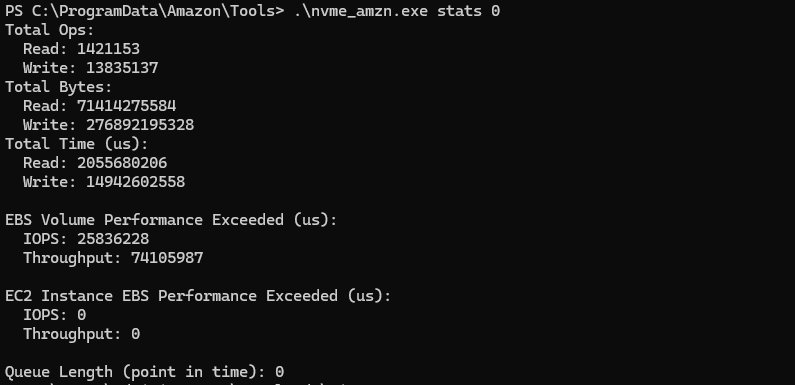
2. Issue the same ebsnvme command after a desired interval (for example: after 15 seconds), so that you can compare how Total Read/Write I/Os have progressed at the Amazon EBS level.
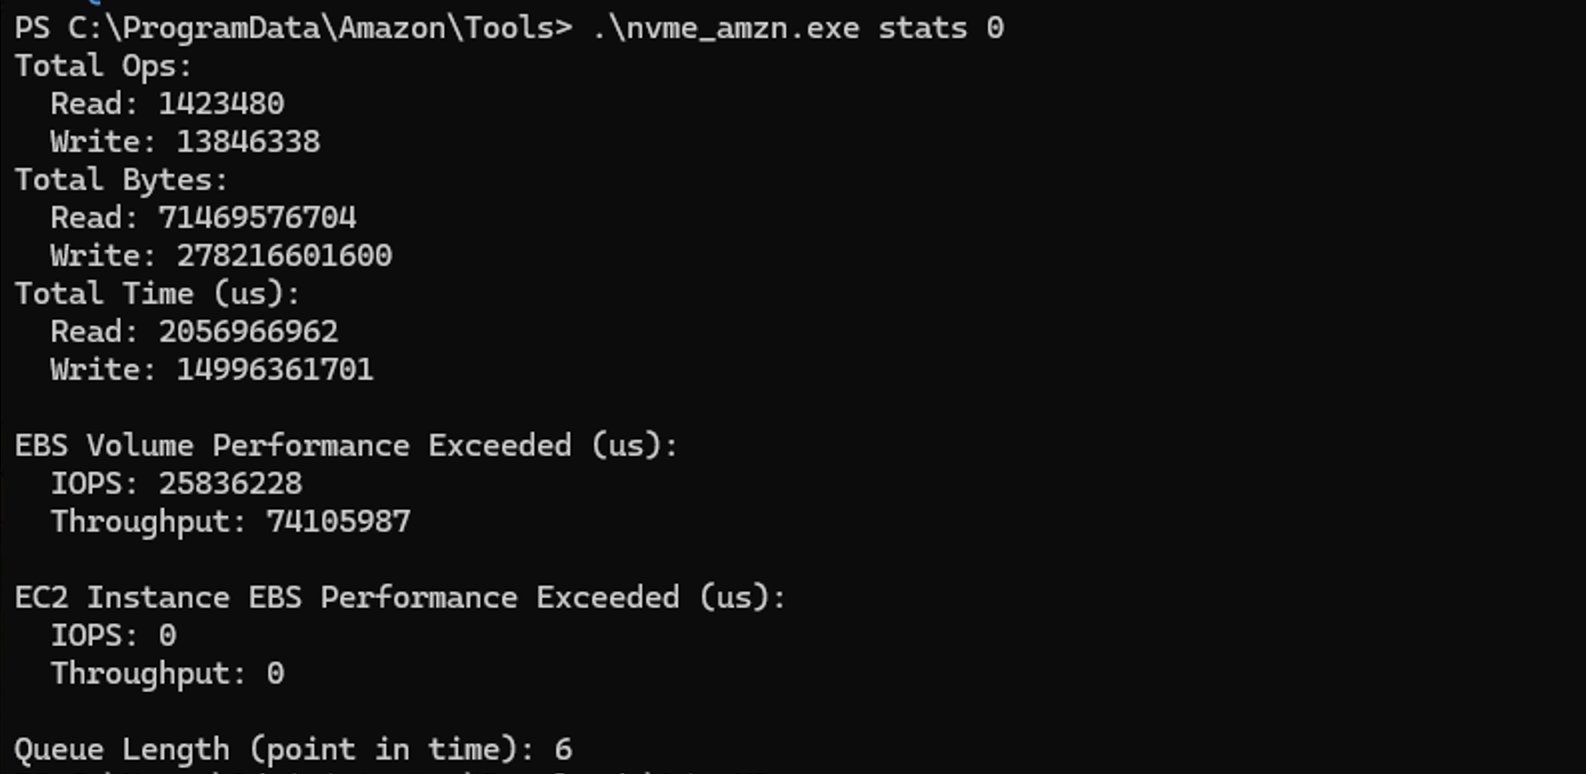
3. From the detailed performance statistics collected approximately 15 seconds apart, we make the following key observations
- Total Read Ops increased from 1421153 to 1423480, indicating 2327 Read operations completed in the 15 second span.
- Total Write Ops increased from 13835137 to 13846338, indicating 11201 Read operations completed in the 15 second span.
- Queue Length stayed between 0 and 6, indicating that the application was issuing I/Os to the EBS volume. If you see a gradual increase in the Queue Length, then it would reflect a buildup in queued I/Os.
This shows that the EBS volume is still driving I/Os that it is receiving, which rules out the EBS volume as the source of observed degradation in application performance. If we had seen an increase in the Queue Length along with 0 Read/Write Ops processed during the period, then it would reflect an unresponsive EBS volume.
If you would like to validate your mechanisms of identifying unresponsive EBS volumes, refer to the Conducting chaos engineering experiments on Amazon EBS using AWS Fault Injection Service blog post, which walks through how to set up an AWS Fault Injection Service Pause I/O experiment.
Scenario 2: Identifying bottlenecks in storage performance on EBS
Amazon EBS detailed performance statistics can also be used to configure the appropriate performance characteristics for your EBS volume and EC2 instance based on the performance needs of your application. The EBS Volume Performance Exceeded and EC2 Instance EBS Performance Exceeded statistics indicate the duration for which your workload consistently attempted to drive IOPS or throughput that is greater than your volume or your instance’s provisioned performance in a given period. Exceeding either the volume’s or instance’s provisioned performance can result in elevated latency on your workload. For this scenario, consider the same application as the one used in scenario 1.
Complete the following steps to check if EBS volume performance is correctly provisioned:
1. Select the EBS volume’s NVMe device to check
2. Collect stats for the device at the desired intervals
3. Compare the stats to check if the EBS volume is exceeding provisioned performance
Step 1. Select the EBS volume’s NVMe device to check
1. This step is the same as Step 1 discussed previously in scenario 1.
Step 2. Collect stats for the device at the desired intervals
1. Similar to Step 2 discussed in scenario 1, access the detailed performance statistics across two points in time.
2. Consider the EBS Volume Performance Exceeded and EC2 Instance EBS Performance Exceeded statistics from the EBS NVMe device.
Step 3: Compare the stats to check if the EBS volume is exceeding provisioned performance
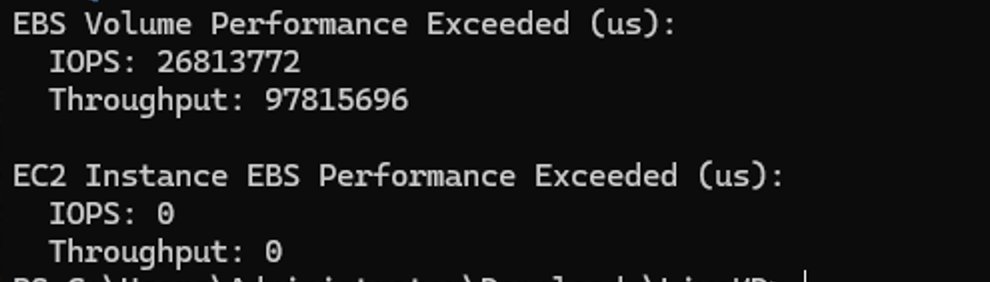
1. In the following example output, you can see the EBS Volume Performance Exceeded statistic increasing by 26813772 microseconds. This shows the workload running on EBS volume vol-EXAMPLEabcd1234 has attempted to drive more IOPS than provisioned on the underlying EBS volume, which can impact the volume’s I/O latency. We recommend that you increase the performance of your volume to make sure that you have sufficient provisioned performance for your application’s needs.
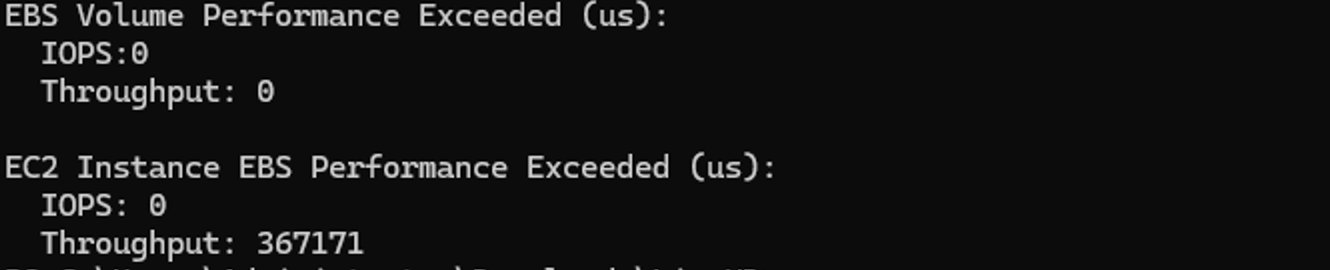
2. In the following example output, driving a different workload on the instance allows us to see that the volume has exceeded the provisioned IOPS performance at the attached EC2 instance level. In this case, up-sizing to a larger instance size can improve the performance of your application.
3. A synthetic load generator for Oracle called Silly Little Oracle Benchmark (SLOB) could also be used to simulate workloads on Oracle databases, while monitoring the Amazon EBS statistics to see which volume or instance is becoming the bottleneck.
It’s important to have the right instance and volume configurations to avoid performance bottlenecks to your application. Refer to the EBS volume types documentation for more information on the different EBS volume types, and the Amazon EBS-optimized documentation to understand how to select the optimal combination of EC2 instance and EBS volume suited for your application. These statistics are available at up to a one-second granularity, which allows you to effectively perform these checks in real-time and initiate volume modifications to optimize volume characteristics as needed.
Scenario 3: Identifying bottlenecks in storage performance on instance storage volume
Amazon Instance Storage detailed performance statistics can be used to configure the appropriate performance characteristics for your application. The “EC2 Instance local storage Performance Exceeded” statistics indicate the duration for which your workload consistently attempted to drive IOPS or throughput that is greater than your rate limit in a given period. Exceeding the throttle value can result in elevated latency on your workload.
For example, i3en.xlarge can support up to 85,000 read IOPS, 65,000 write IOPS, 634,765 KiB/S for read and 317,382 KiB/S for write. By using the detailed IO metrics, you can more efficiently determine if the instance meets your requirements.
Complete the following steps to check if the device meets your application needs:
- Select the instance storage device to check.
- Collect stats for the device at the desired intervals
- Compare the stats to check if the instance storage is exceeding the throttled value
Step 1. Select the Instance Storage NVMe device to check
Use the nvme_amzn tool and identify the NVMe device associated with the instance storage.
Step 2: Collect stats for the device at the desired intervals
Step 3: Compare the stats to check if the instance storage is exceeding throttle value
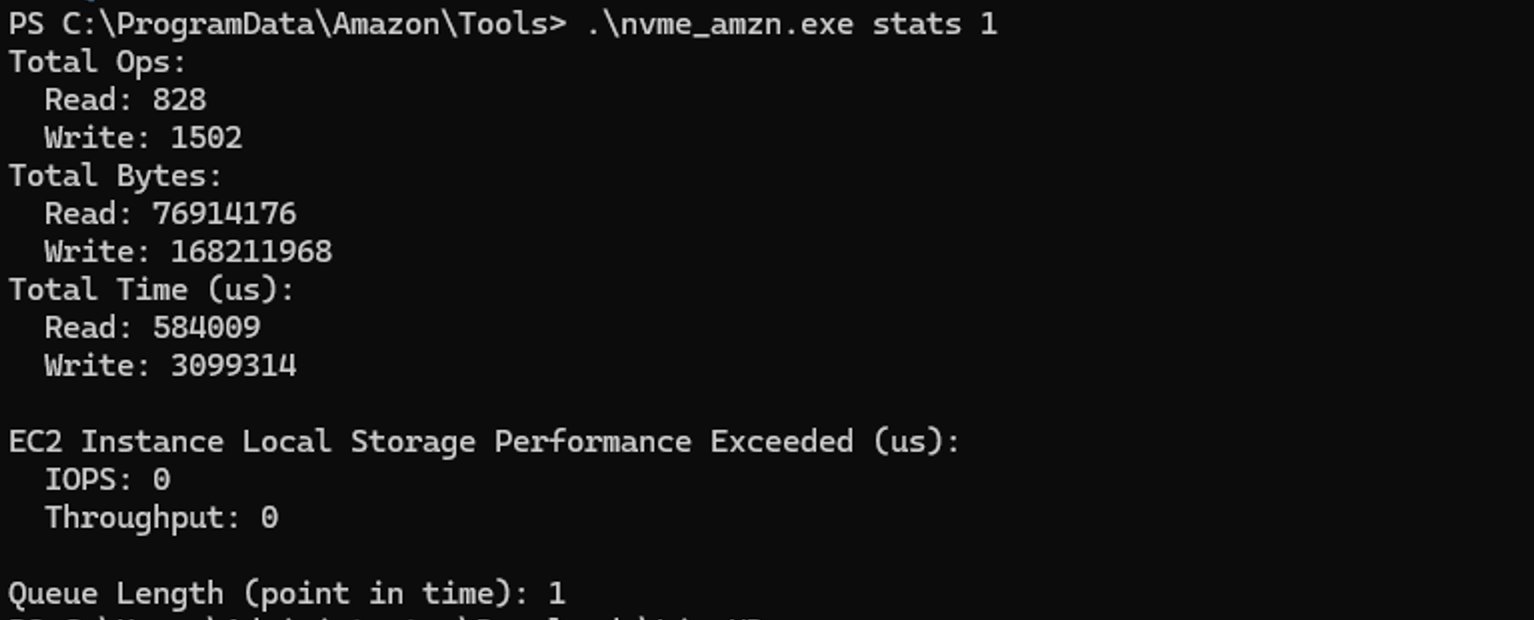
Take the following scenario as an example. At the very beginning, after the instance launch, both the IOPS and Throughput under “EC2 Instance local storage Performance Exceeded (us)” are 0s.
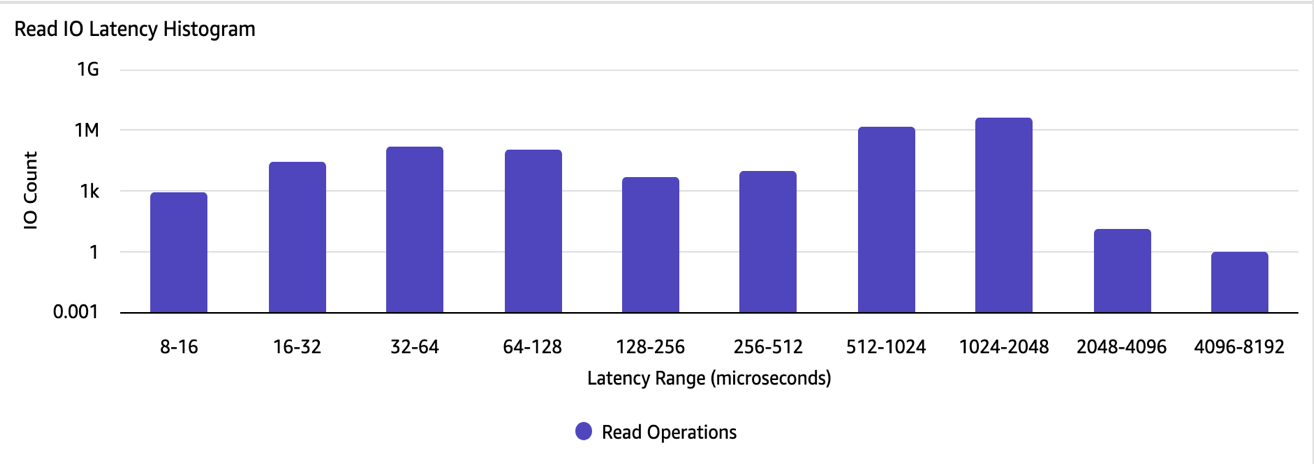
You start your applications and find that the application write does not meet your expectation. You can check the IO metrics afterwards. You see a lot of IO falls into the 1 ms to 2 ms range, which is unexpected.
By further checking the “EC2 Instance local storage Performance Exceeded (us)”. You found that the IO reached the allowed upper limit for up to 8 seconds, which indicates the i3en.xlarge would not meet your expectations. Select a larger instance size to address this.
It’s important to have the right instance size to avoid performance bottlenecks to your application. Refer to the ec2-instance-type-specifications documentation for more information on the different instance storage size to understand how to select the optimal instance size suited for your application. This tool helps you to effectively perform these checks in real-time.
Scenario 4: Identifying which block size caused the long latency on instance storage volume
You may have a mixed workload:
- Data (either read or write) pattern with different block sizes like 4K and 128K.
- Mixed read and write data pattern.
By using the --detail/-d switch from the NVMe CLI, you can identify the issue quickly and readjust the workload.
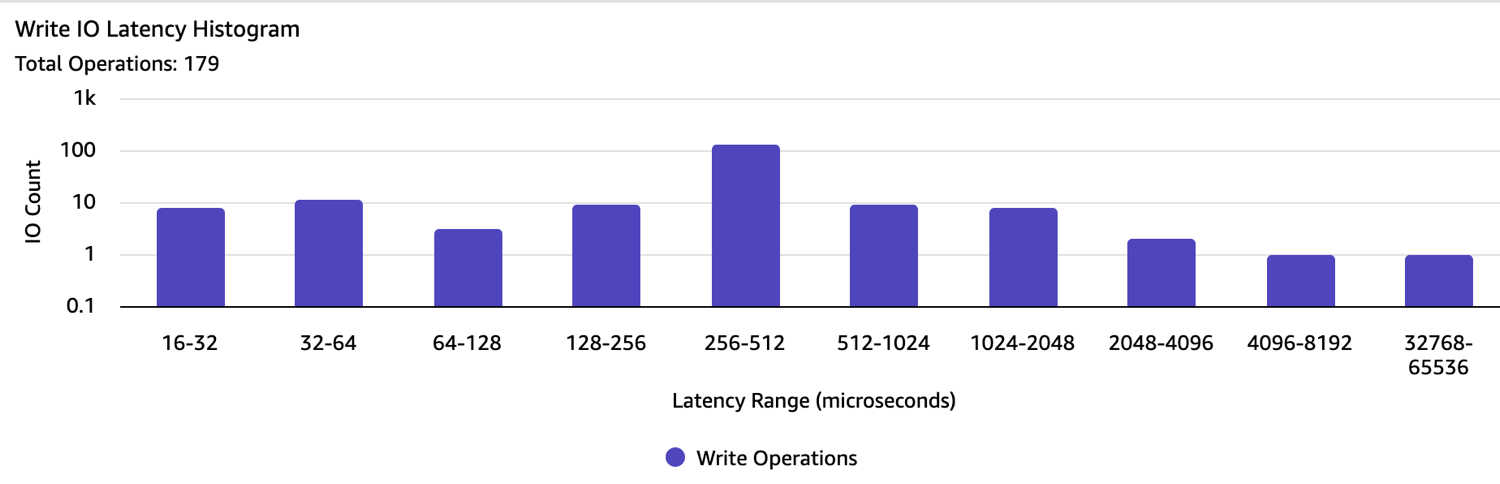
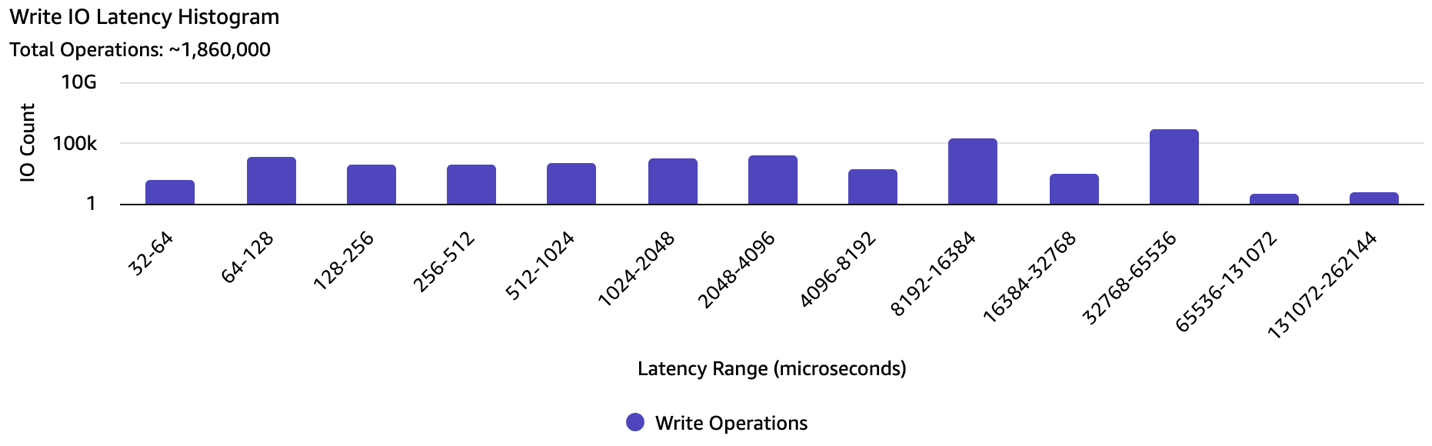
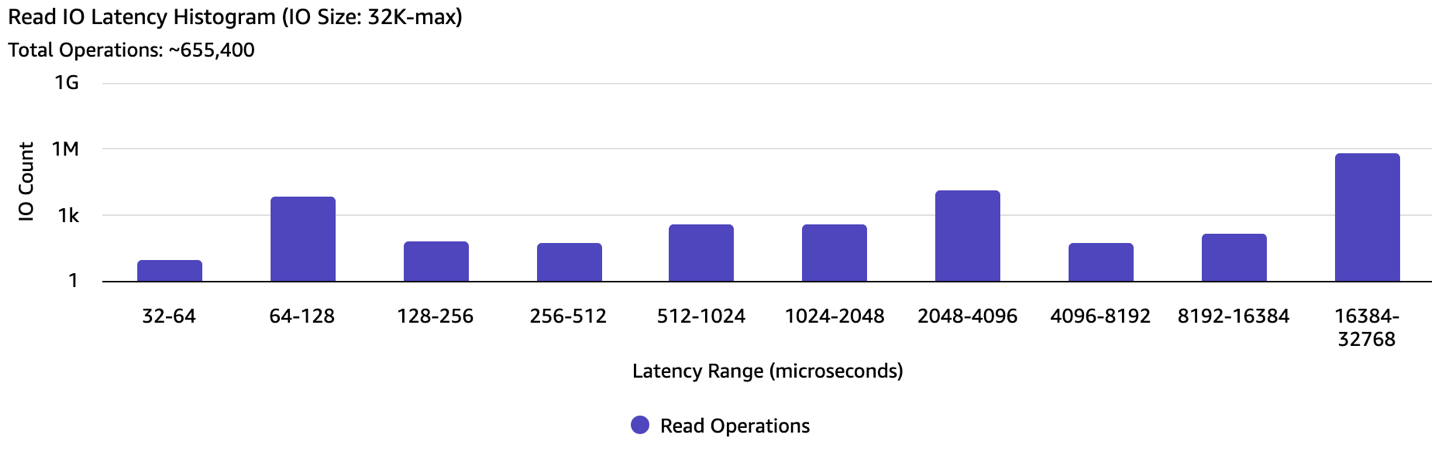
Example 1: High write latency from a workload
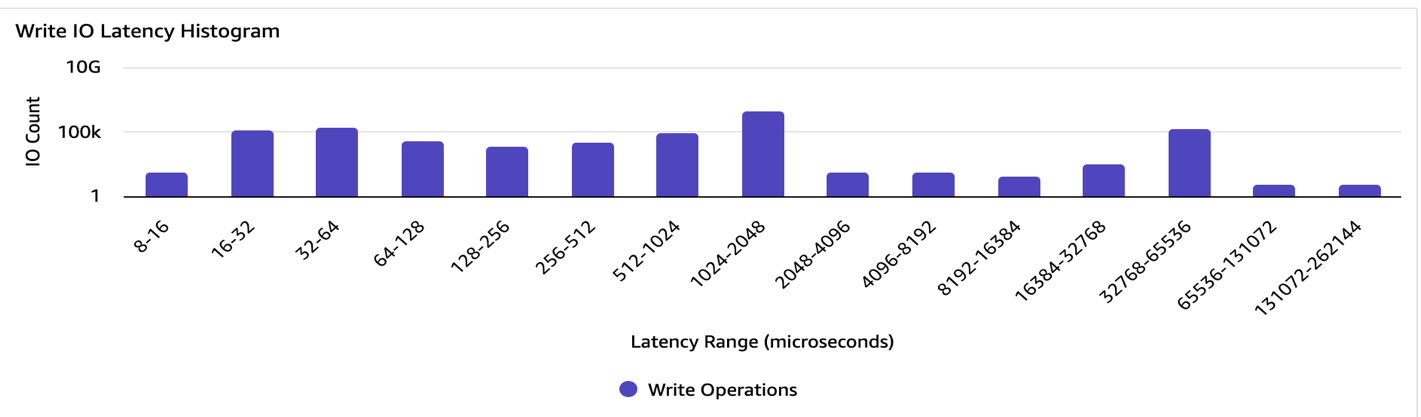
By further looking at the histogram of the block size range larger than 32 KiB, you can see that the larger IO caused high application latency, while other block sizes (like 8K) show no latency abnormality.
Example 2: Mixed read and write traffic
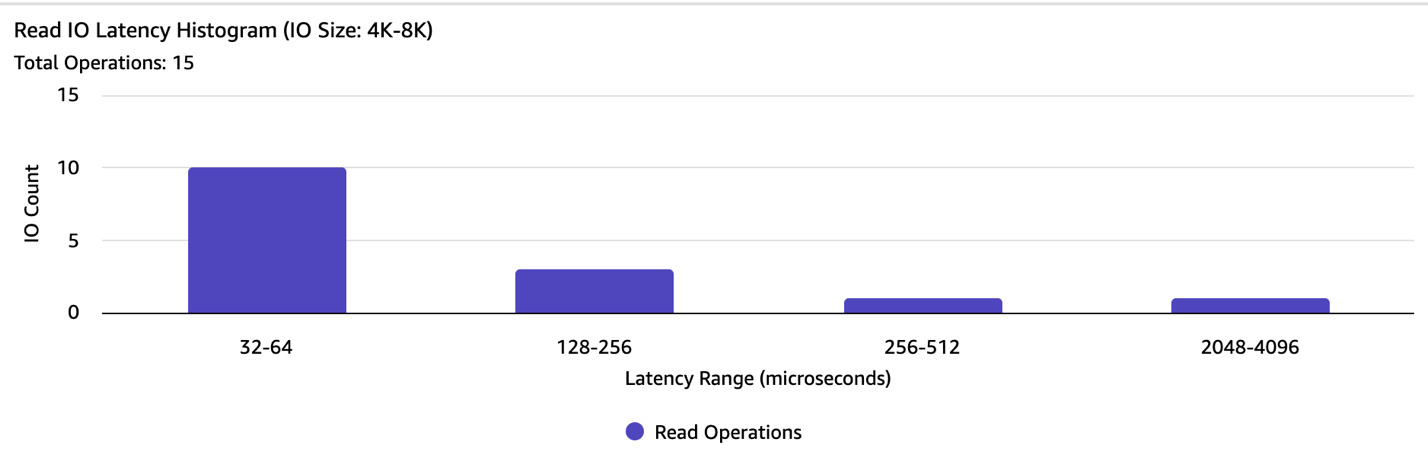
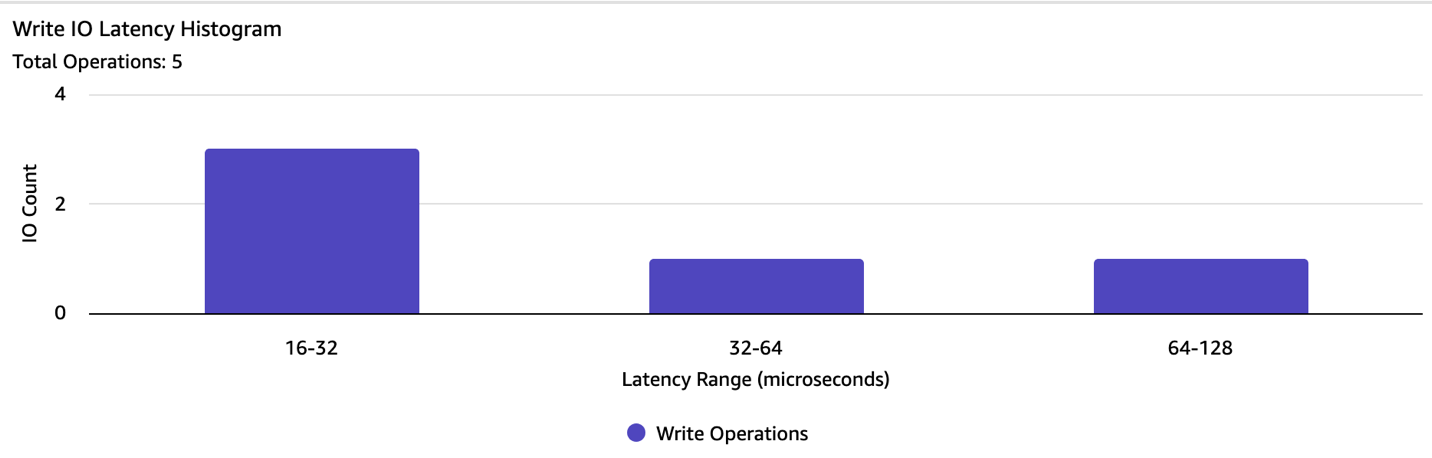
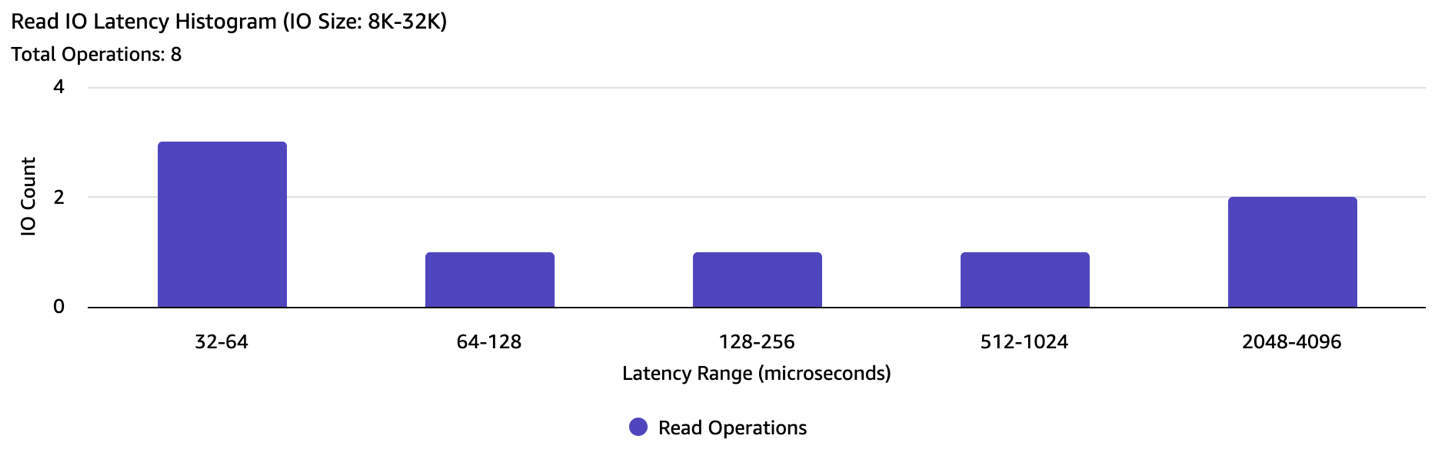
Some users will have a mix of read and write traffic. For example, some applications will do light read traffic (for example to read out some metadata) and heavy write. This may inadvertently impact the read latency. For example, an application is doing a read operation with a single IO of small block size. However, the user experiences high read latency. Examining the histogram breakdown, you could reasonably believe the heavy larger IO write may interfere with the read.
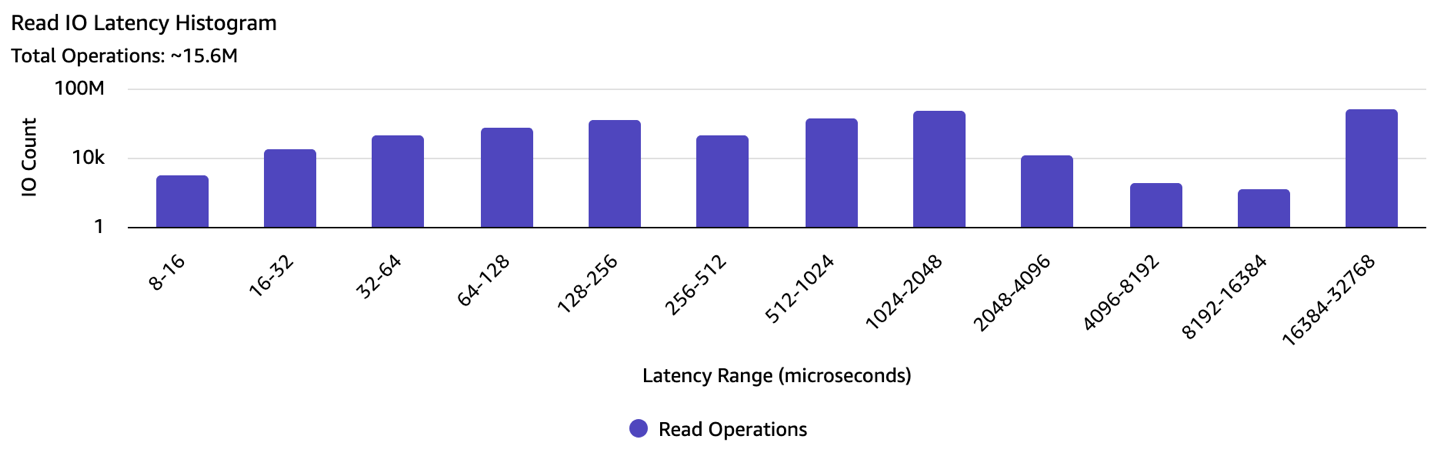
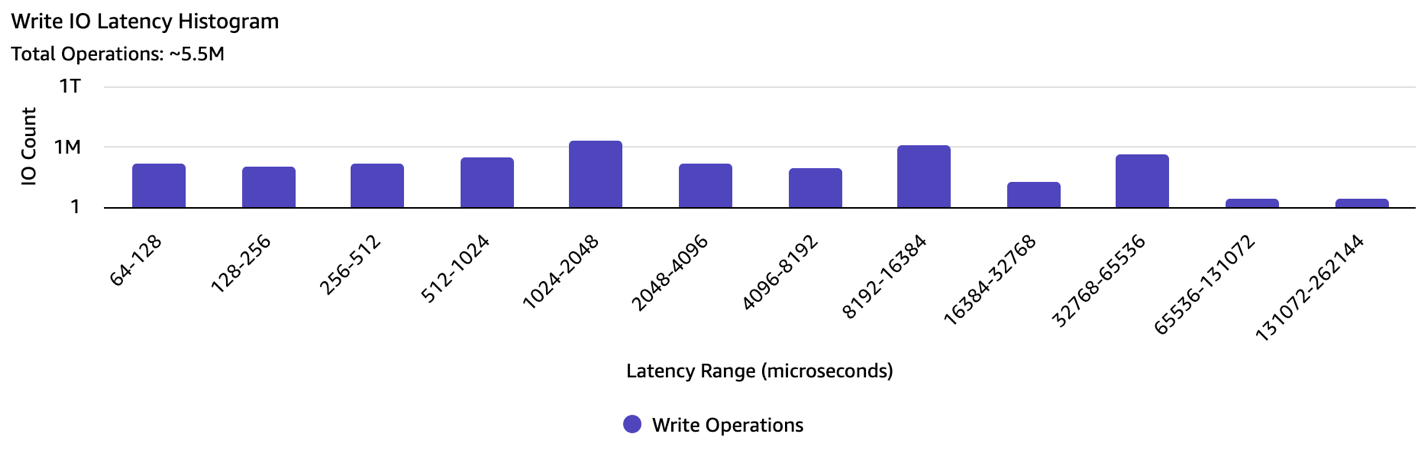
The detailed IO histogram for IO size larger than 512B but less than or equal to 4KB
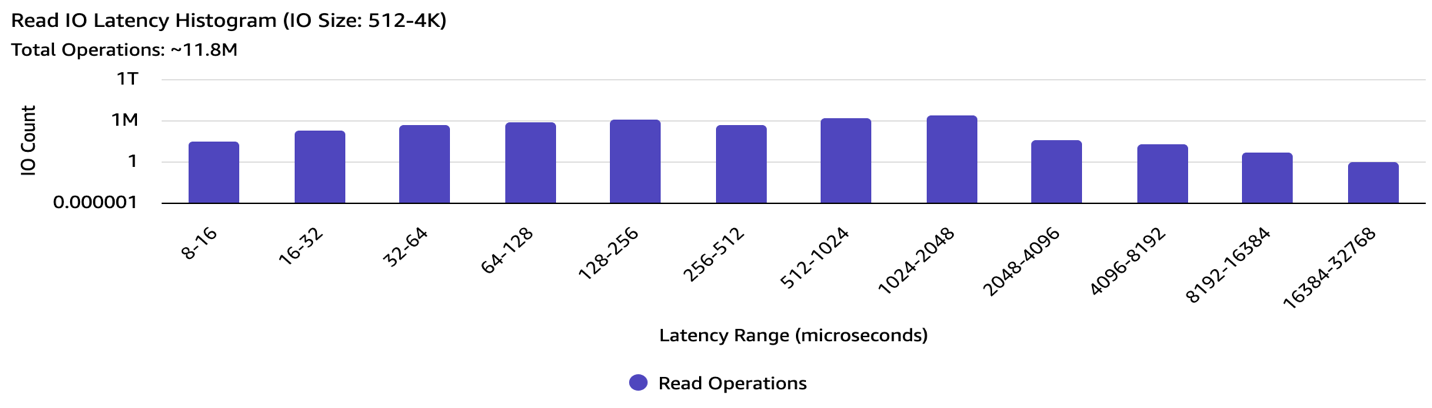
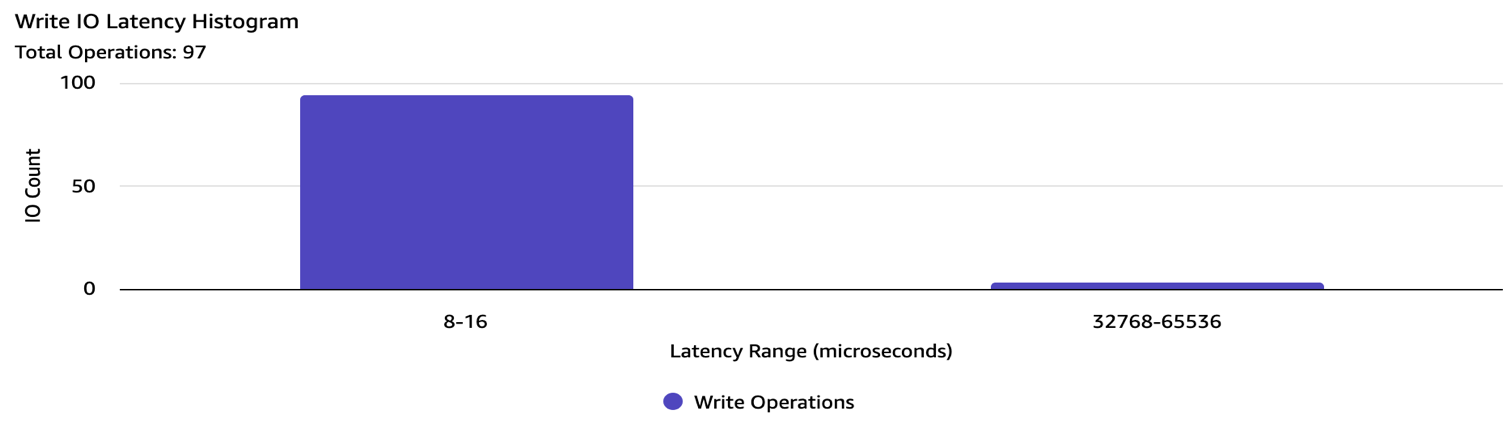
The detailed IO histogram for IO size larger than 32 KiB
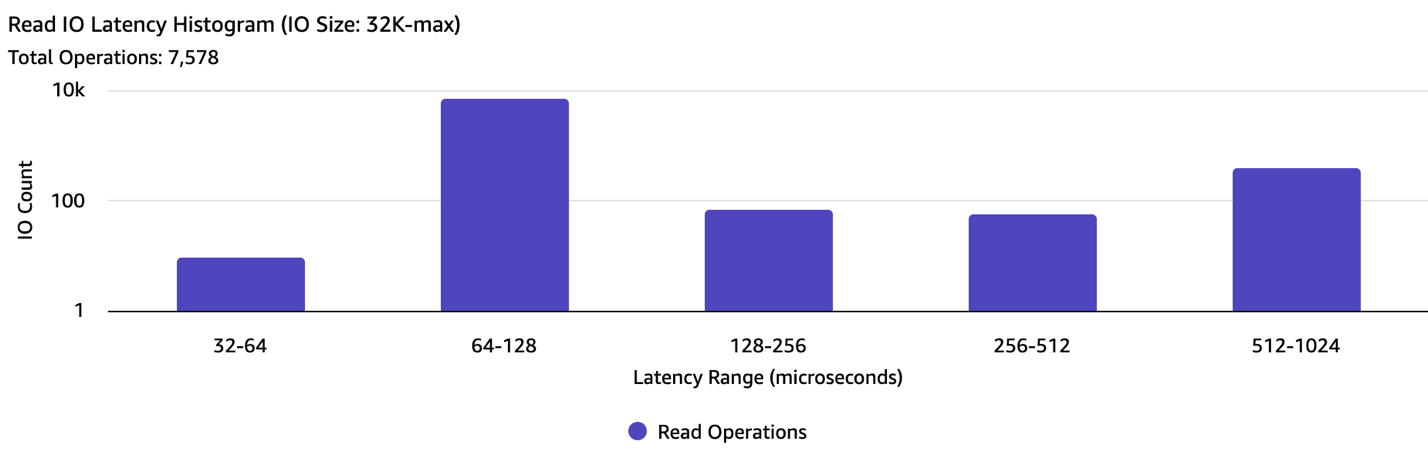
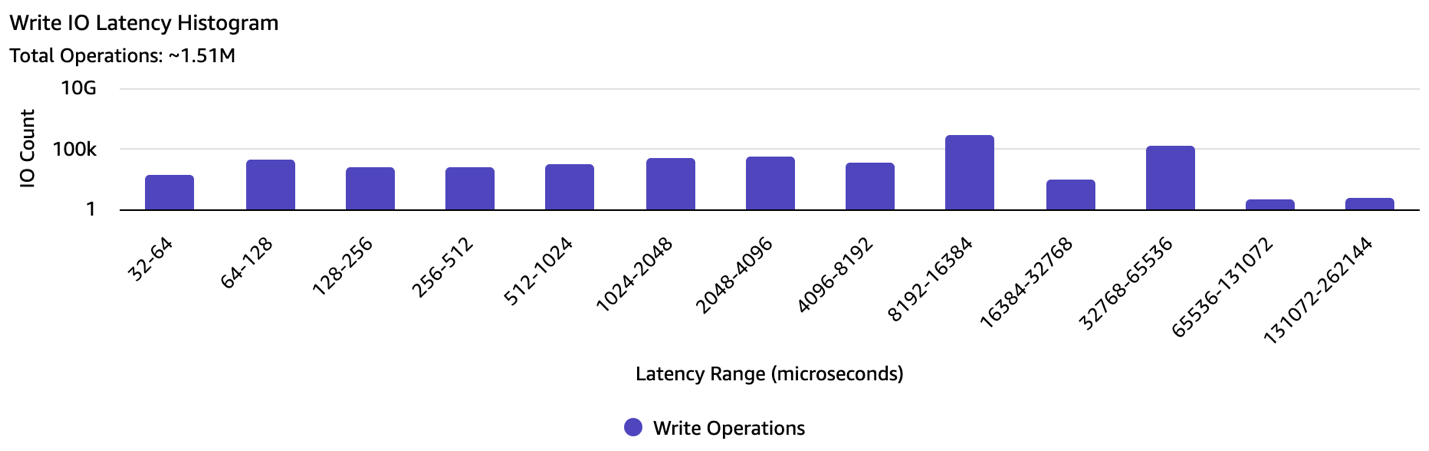
The user should consider smoothing out the write pattern to alleviate the read latency.
Cleaning up
If you created an EC2 instance and EBS volume for this exercise, then terminate and delete the appropriate instance and volumes to avoid future costs.
Conclusion
In this post, we presented a solution for accessing high-resolution performance statistics for Amazon EBS volumes and EC2 Instance Store at the instance level. These detailed metrics provide a real-time view into your underlying storage performance at sub-minute granularity, helping you to quickly root cause disruptions to your applications.
This approach also helps you identify performance bottlenecks caused by workloads exceeding your provisioned IOPS or throughput limits on Amazon EC2, EBS volumes, or EC2 Instance Store. Combined with Amazon CloudWatch metrics, which provide volume-level insights at one-minute granularity, these tools help give you the visibility you need to confidently diagnose and resolve storage-related performance issues.