AWS Database Blog
Build an Oracle AWR-style report for RDS/Aurora PostgreSQL
If you have run an Oracle database, you know the Oracle Automatic Workload Repository (AWR), part of the Oracle Diagnostics Pack. Oracle takes periodic snapshots, and one report between two snapshot IDs shows what the database was doing: load profile, top SQL, hot segments, wait events, and configuration changes. Teams moving to Amazon Relational Database Service (Amazon RDS) for PostgreSQL or Amazon Aurora PostgreSQL-Compatible Edition often ask how to get the same kind of report.
Amazon CloudWatch Database Insights and Amazon CloudWatch give rich visibility on the console. Many teams also want a SQL-native report that works alongside these tools: one they can generate between two snapshot IDs from psql or pgAdmin, compare with the report for an earlier window, and attach to a support case as plain text.
In this post, we show you how to build an AWR-style report using PostgreSQL’s built-in statistics views and two extensions that Amazon RDS and Aurora support: pg_stat_statements and pg_cron. Like Oracle AWR, the finished solution takes two commands: one to list snapshots and one to generate the report.
Solution overview
The solution has three parts:
- Repository: the
awr_liteschema, which holds the snapshot tables. An installer script that you run once as a user with therds_superuserrole creates it. - Collection: three
pg_cronjobs. A snapshot job copies the statistics views every 15 minutes, which gives finer resolution than Oracle AWR’s 60-minute default at modest storage cost. Choosing the schedule explains the trade-off and how to change it. A sampler records active sessions and their wait events every 10 seconds. The report aggregates the samples that fall between the two snapshots you choose. A nightly purge keeps 8 days of snapshots, samples, andpg_cronrun history, matching AWR’s default retention. Edit the intervals in the purge job to change it. - Reporting: one entry-point function that generates a report between any two snapshots.
Collection runs only on the writer (the primary on Amazon RDS, the writer on Aurora), because it writes to the repository tables. Reader instances and read replicas are not covered. If a window spans a restart or failover, the cumulative statistics reset and that window’s deltas are unreliable: the SQL sections drop the affected rows and list_snapshots() shows the gap. Treat the first snapshot after a reset as a new baseline and choose windows that don’t span it.
After setup, your day-to-day workflow takes two commands:
The report includes the core sections you know from an Oracle AWR report:
- Report header and load profile: snapshot window, Average Active Sessions (a DB time analog), and every metric as a total, per second, and per transaction.
- Database activity summary: commits, cache hit ratio, tuples, temp usage, and deadlocks.
- SQL ordered by elapsed time, block reads, executions, and temp usage, each with the executing database user.
- Segments by physical reads and by DML activity, plus unused indexes on active tables, largest first, excluding primary key and unique indexes.
- Background writer, checkpoint, and WAL/redo activity, including WAL bytes (the redo size analog).
- Sampled wait events in Active Session History (ASH) style, SQL attributed to database users and client addresses, and parameters that changed between snapshots.
Before you begin
Keep these three points in mind as you set up the solution:
- Install once for each database you want to monitor. PostgreSQL makes table and index statistics available only inside the database that owns them, so each installation of
awr_litereports on one database, much like AWR at the pluggable database (PDB) level in Oracle. To report on several databases, install the solution in each one. This post uses a database namedappdbin all examples. - Test in a non-production environment first. Before you deploy to production, check three things: the installer finishes successfully, the
pg_cronjobs collect data on schedule, and the report shows the results you expect. - Install the
awr_liteobjects and thepg_cronjobs in the same database.pg_cronruns jobs in the database set by thecron.database_nameparameter, which ispostgresunless you change it. If the jobs run in a different database from theawr_liteschema, they fail withERROR: schema "awr_lite" does not exist. In this post, we setcron.database_nametoappdband install everything there.
Architecture
All three parts live inside the database. awr_lite.take_snapshot() copies the cumulative statistics views into repository tables under a new snapshot ID: pg_stat_statements (per-query counters), pg_stat_database (database-wide activity), the table, index, and I/O views (segments), pg_stat_bgwriter and pg_stat_wal (background activity), and pg_settings (configuration). A second collector, awr_lite.sample_activity(), samples pg_stat_activity for what active sessions were waiting on.
pg_cron runs both collectors and the nightly purge. Every detail table references awr_lite.snapshots with ON DELETE CASCADE, so deleting a snapshot row purges its data in one step. awr_lite.report() calculates the difference between two snapshots, as Oracle computes AWR between two snap IDs. Your performance data stays inside your database. You don’t need any external agent, storage, or network access.
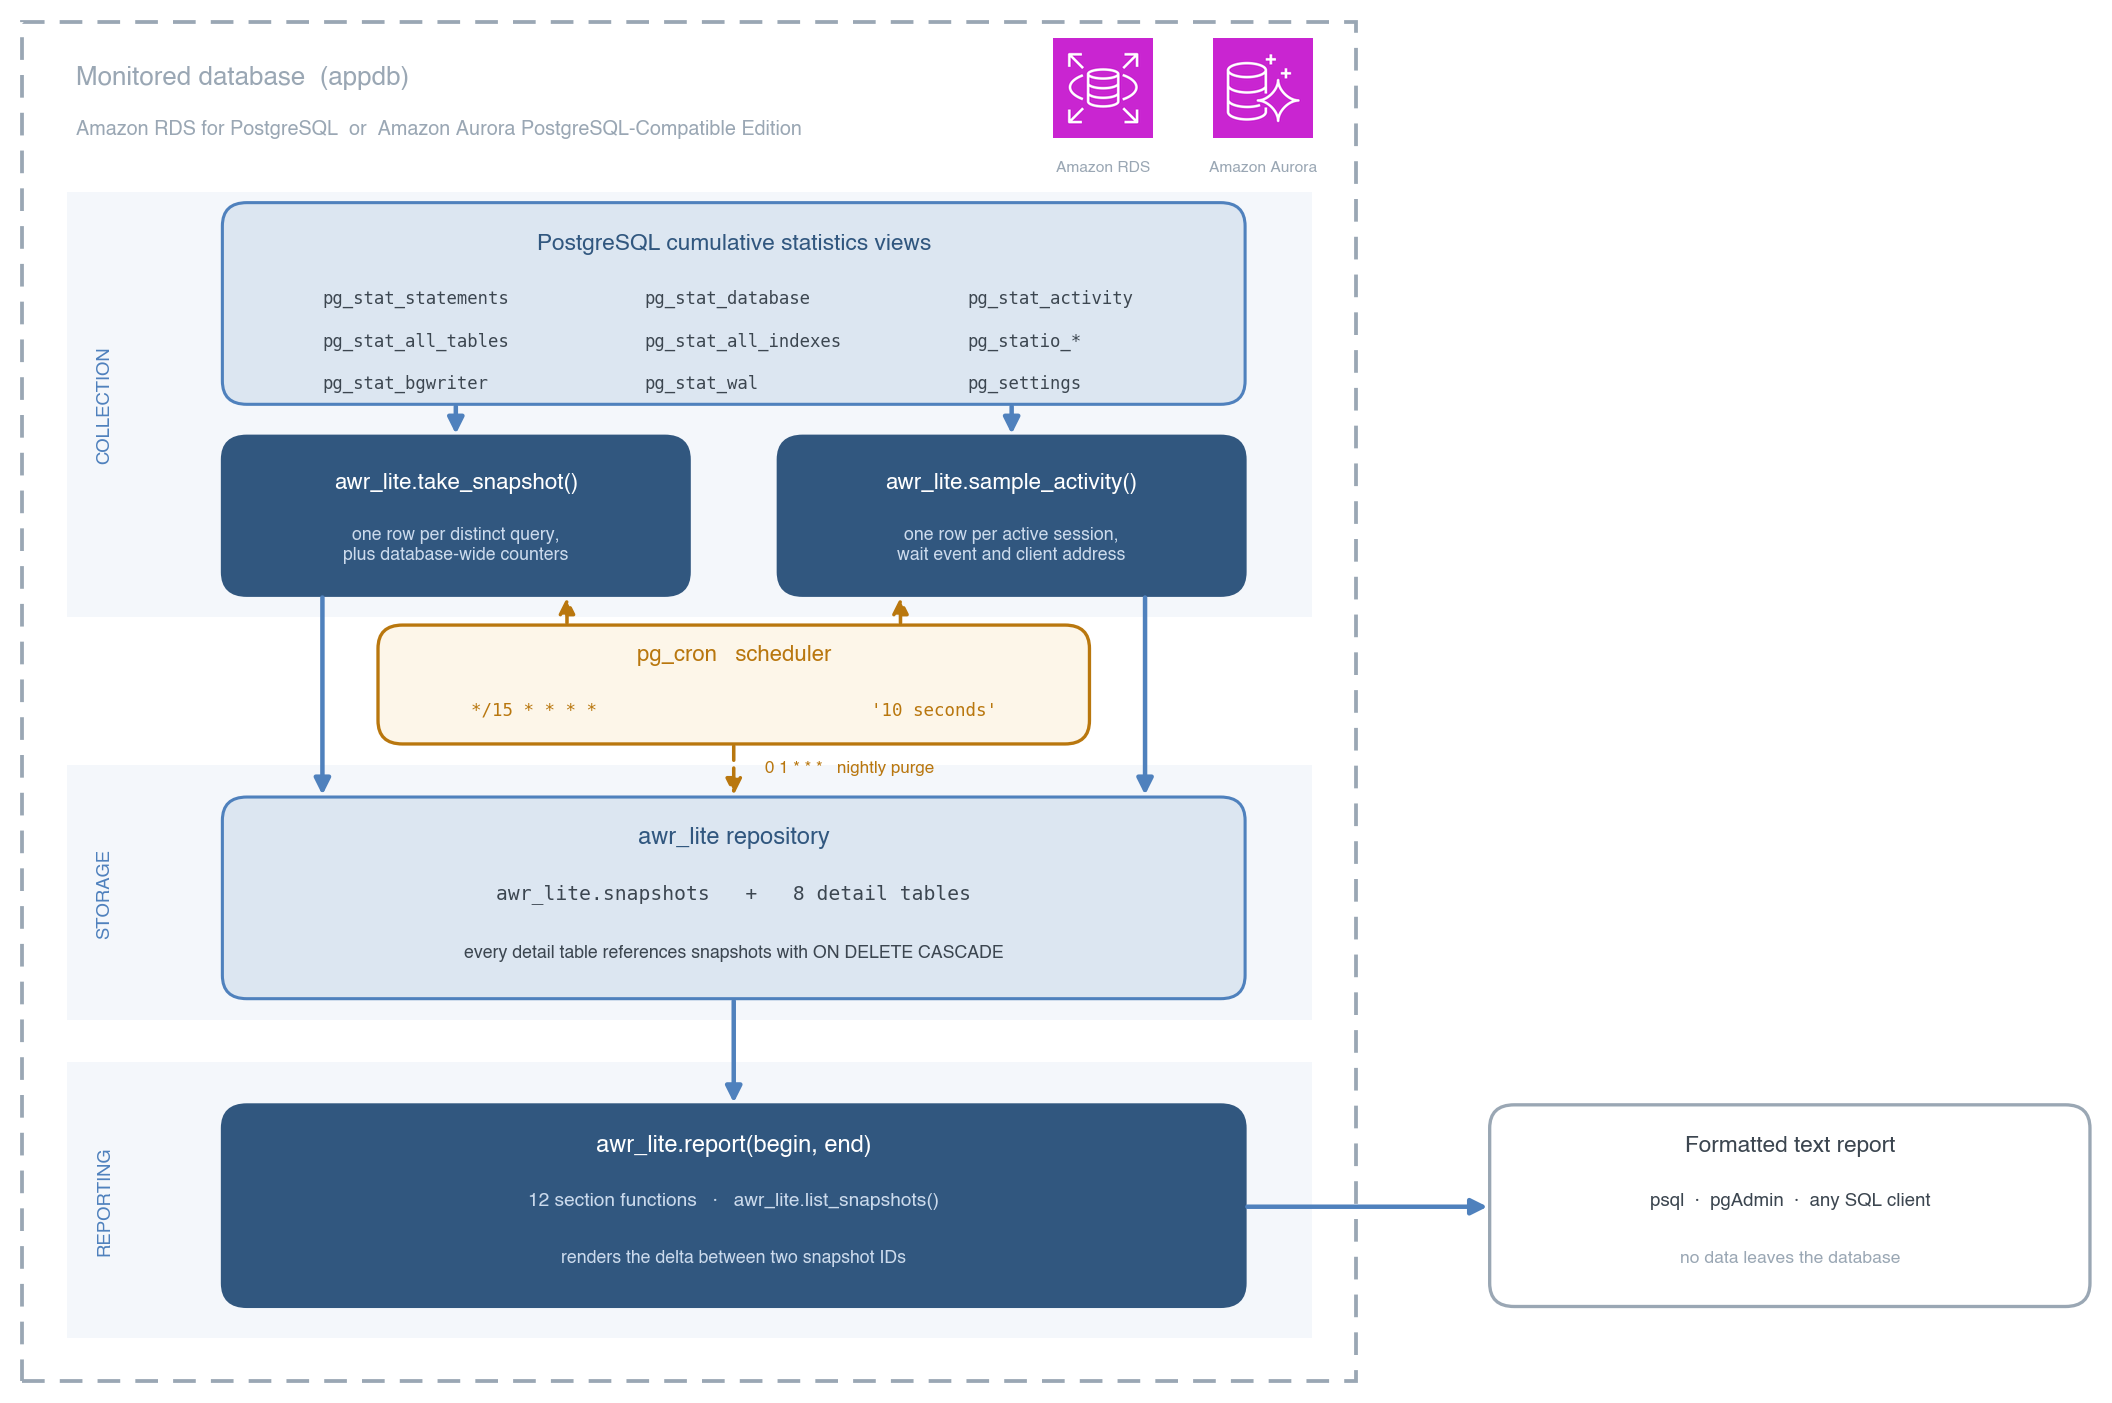
Figure 1: Data flow of the awr_lite solution inside a single monitored database
Prerequisites
You need the following:
- Amazon RDS for PostgreSQL or an Aurora PostgreSQL DB cluster on version 14 or higher. PostgreSQL 14 is the lowest major version still under standard support on Amazon RDS (check current dates in the release calendar) and the lowest on which this solution is feature-complete.
- The
pg_stat_statementsandpg_cronextensions. The 10-second sampler needspg_cron1.5 or higher, which supports schedules shorter than one minute. If your engine version includes an earlierpg_cronrelease, schedule the sampler at'* * * * *'for one-minute sampling, or drive it from Amazon EventBridge and AWS Lambda. - A database user with the rds_superuser role.
- A non-production instance or cluster for initial validation.
- The installer script, awr_lite_install.sql.
The installer detects the server version at run time, so one script works on every supported major version. It still runs on PostgreSQL 13 and earlier, but those are past end of standard support on Amazon RDS and can’t report Average Active Sessions, the WAL section, or client-address attribution. On PostgreSQL 17 and higher it reads checkpoint counters from pg_stat_checkpointer automatically.
Aurora PostgreSQL differences: The solution runs on both engines, with four differences on Aurora PostgreSQL:
pg_stat_get_wal()is unavailable, so the WAL section prints a platform note instead of redo figures. The solution never reads CloudWatch. For Aurora write volume, check theWriteThroughputandVolumeWriteIOPsCloudWatch metrics separately.- Only
rdsadminhasEXECUTEoncron.schedule_in_database(), so create jobs withcron.schedule()in thecron.database_namedatabase. pg_crontherefore serves one database per cluster. Drive collection for any other database externally.- Run everything on the writer. The statistics views reset on the new writer after a failover.
Set up the extensions
Step 1: Create the application database. Connected to postgres, create the database if it doesn’t exist. pg_cron doesn’t create it. It must exist before the step 3 reboot so the pg_cron worker finds the cron.database_name database at startup.
Step 2: Configure the parameter group. In your custom parameter group (DB parameter group on Amazon RDS for PostgreSQL, DB cluster parameter group on Aurora PostgreSQL), append pg_cron to shared_preload_libraries and set cron.database_name to the database you are monitoring. Also set pg_stat_statements.track to ALL and track_io_timing to on, which populates the block timings. On Amazon RDS for PostgreSQL:
On Aurora PostgreSQL, use modify-db-cluster-parameter-group with the same two parameters and reboot the writer.
Step 3: Reboot the instance. shared_preload_libraries and cron.database_name are static parameters, so they take effect only after a reboot.
Warning: This reboot causes a brief outage. On Aurora PostgreSQL, rebooting the writer interrupts connections. Schedule it in a maintenance window.
Step 4: Create the extensions. After the reboot, connect to appdb and create both extensions there. pg_cron can only be created in the cron.database_name database. ERROR: can only create extension in database postgres means the change hasn’t applied. pg_stat_statements is per-database and must also exist in appdb, or the collector fails with ERROR: relation "pg_stat_statements" does not exist.
Install awr_lite
One script, awr_lite_install.sql, creates the whole repository: nine tables cascading from awr_lite.snapshots, the two collectors, 12 section functions, and the two you use day to day, list_snapshots() and report(). Connect to appdb and run it once. It is idempotent, so re-running is safe.
Note: \i is a psql meta-command. In pgAdmin or another graphical client, open awr_lite_install.sql and run its full contents in a query window, or run the file once with psql.
Schedule the collectors
Connected to appdb, create the three jobs (15-minute snapshot, 10-second sampler, nightly purge). Adjust the intervals to your workload. With cron.database_name set to appdb, plain cron.schedule() registers the jobs alongside the awr_lite objects, identically on both engines.
Verify that the jobs run, not only that they were created:
Expect status = succeeded. ERROR: schema "awr_lite" does not exist means the job runs in a different database from the one you installed into. Check cron.job and cron.database_name. A sampler that succeeds with an empty sample table means nothing was active, which is normal on an idle database.
On Amazon RDS for PostgreSQL only, an alternative needs no parameter change: leave cron.database_name at postgres and schedule with cron.schedule_in_database(..., 'appdb'). On Aurora PostgreSQL this fails with permission denied even for an rds_superuser member, because only rdsadmin has EXECUTE on that function. Use cron.schedule() as above. Or, because take_snapshot() is an ordinary SQL call, run it on a timer from Amazon EventBridge and AWS Lambda.
Choosing the schedule
Snapshot frequency trades report resolution against storage. Fifteen minutes is a sensible default, finer than Oracle AWR’s hourly. Each snapshot copies one row per distinct normalized query, so cost scales with query diversity, not volume, and linearly with frequency. At the 76 ms and 910 KB per snapshot shown in the following paragraph, a 1-minute schedule writes about 15 times the volume of the 15-minute default. Use 30–60 minutes for trending, 1–5 minutes during an incident, and manual snapshots around a specific event, like an on-demand AWR snapshot. For the sampler, 10 seconds gives reasonable fidelity at low cost. For one-second resolution, CloudWatch Database Insights is purpose-built. Keep the retention purge in place.
To size storage before installing, use these figures from our test instance, a db.t4g.medium with 20 GiB gp3 storage on PostgreSQL 18.6. With 3,568 distinct normalized queries, take_snapshot() ran in a median 76 ms. At that cardinality on the 15-minute default, each snapshot added about 910 KB: roughly 85 MB per day and about 680 MB at 8-day retention. The sampler is far cheaper, about 240 bytes per row and one row per active session per run. At 2.7 average active sessions it added 5.4 MB per day and settled near 43 MB. Scale the snapshot figures by your query cardinality and the sampler figures by your concurrency.
Generate a report
First, list the available snapshots:
The gap_minutes column reveals a gap caused by a restart. Second, generate the report between two snapshot IDs. In psql, set unaligned, tuples-only output so it renders cleanly, and optionally write it to a file, as with Oracle awrrpt.sql:
To generate one section, pass its name as a third argument, for example report(10, 14, 'TOPSQL'). Valid names are ALL, HEADER, LOAD, SUMMARY, TOPSQL, SEGMENTS, INDEXES, BGWRITER, WAL, ASH, SOURCES, and PARAMS. A misspelled name returns the valid list. A fourth argument sets how many rows each ranked section returns.
Reading the report
The following abbreviated example shows the format. The values are illustrative, not performance claims. It comes from a separate, deliberately short validation run on the same test instance (snapshots 1 and 2, about 20 seconds apart, on PostgreSQL 18.3), so its snapshot IDs and elapsed time differ from the 10 to 14 window above. Three notes:
- The report hides its own machinery:
awr_liteandpg_cronstatements and tables are excluded, so a quiet interval reports as quiet. - The unused-index section considers only tables active in the interval and skips primary key and unique indexes, so a database with thousands of indexes prints a short list.
report_unused_indexes()gives the full one. - A
CREATE TABLE AScan appear twice, becausepg_stat_statementstracks the utility command and its innerSELECTseparately.
Using the report in pgAdmin and other clients
awr_lite.report() returns text lines, so it works in any client. pgAdmin shows it as a single-column grid. For native tabular output with real column headers, call the section functions directly. The following table lists each function, its section, and its keyword.
| Section function | Report section | Keyword |
| report_header(b, e) | Report header, elapsed time, Avg Active Sessions | HEADER |
| report_load_profile(b, e) | Load profile with per-second and per-transaction rates | LOAD |
| report_db_summary(b, e) | Database activity summary and cache hit ratio | SUMMARY |
| report_top_sql(b, e, n) | SQL ordered by elapsed time | TOPSQL |
| report_top_sql_by(b, e, order, n) | SQL ordered by calls, rows, reads, or temp | TOPSQL |
| report_top_tables(b, e, n) | Segments by physical reads and by DML activity | SEGMENTS |
| report_unused_indexes(b, e, n) | Unused indexes on active tables, largest first | INDEXES |
| report_background(b, e) | Background writer and checkpoint activity | BGWRITER |
| report_wal(b, e) | WAL/redo activity including WAL bytes | WAL |
| report_ash(b, e, n) | Top wait events, sampled | ASH |
| report_sql_sources(b, e, n) | SQL by database user and client address | SOURCES |
| report_parameters_changed(b, e) | Parameters changed between snapshots | PARAMS |
Validate the solution
Run these four scenarios on a non-production instance before relying on the output. They prove the mechanics, not the sizing: cost and storage growth scale with your own query cardinality and concurrency, so re-measure in production. Each scenario creates its own snapshots. Substitute the IDs that take_snapshot() returns for <begin> and <end>. Keep workloads modest: on burstable classes, a heavy synthetic workload can exhaust the CPU credit balance and throttle the instance, which looks exactly like a hang. Watch CPUCreditBalance as you test.
Scenario 1: Delta arithmetic. Take a snapshot, run a mixed workload, take another, and generate the report. The load profile, activity summary, SQL rankings, and segment sections should reflect your statements, attributed to the right user. A statement absent at the begin snapshot still appears, so new SQL is never missed.
Scenario 2: Wait-event sampler. pg_sleep produces a predictable wait event at no CPU cost. While it sleeps in one session, call sample_activity() a few times from another, take a snapshot, and report the ASH and SOURCES sections. You should see Timeout/PgSleep attributed to your database user and client address. An empty section means the sampler ran between short statements.
Scenario 3: Configuration tracking. In the same session, set a parameter to a genuinely different value, take a snapshot, and report the PARAMS section. The old and new values appear. ALTER DATABASE ... SET applies only to new sessions, so reconnect first if you use it. On Aurora, confirm that the WAL section prints its platform note instead of failing.
Scenario 4: Automation and error handling. After the pg_cron jobs have run for a few minutes, list_snapshots() shows new IDs arriving on schedule with matching gap_minutes. Calling report() with nonexistent snapshots, reversed IDs, or a misspelled section returns a clear one-line error.
Considerations and best practices
- Install the objects and run the
pg_cronjobs in the same database. This is the most common failure. Confirm it incron.job_run_details. - To monitor several databases on one instance, install the script into each. Every database gets its own repository. On Amazon RDS for PostgreSQL, register one job set per database with
cron.schedule_in_database(). On Aurora PostgreSQL,pg_cronserves only thecron.database_namedatabase, so drive the others externally. Watch cron.max_running_jobs (default 5). - Size retention for your storage. The snapshot tables scale with distinct normalized queries and the Active Session History table with average active sessions, so which dominates depends on your workload. On the test instance (3,568 distinct queries, 2.7 average active sessions), the snapshot tables grew about 16 times faster and
stat_statementsalone was 85 percent of the repository. The sampler would need roughly 40 average active sessions to overtake it. - Purge
cron.job_run_detailstoo.pg_cronlogs one row per job run: 8,765 rows and 2.7 MB per day across the three jobs on the test instance, mostly from the 10-second sampler. The nightly purge above gives it the same 8-day retention as the snapshot tables. 8 days is our default recommendation, and 30 days needs storage sized for your query cardinality. It lives in thecronschema, notawr_lite, soDROP SCHEMA awr_lite CASCADEdoesn’t remove it. Unpurged, it becomes the largest artifact this solution leaves behind. - Statistics also reset on
pg_stat_statements_reset(). As after a restart, treat the first snapshot after the reset as a fresh baseline. - Account for
pg_stat_statementseviction. The view tracks at mostpg_stat_statements.maxdistinct statements and evicts the least-executed when full. A statement evicted between snapshots that re-enters has end counters below its begin counters. That negative delta is filtered like a counter reset, so the statement is absent rather than negative. On high-cardinality workloads, raisepg_stat_statements.max. See the pg_stat_statements documentation. - After an Aurora PostgreSQL failover, the new writer continues the schedule and the repository persists in the cluster volume. Only the statistics views reset. On Amazon RDS for PostgreSQL, the views reset on an instance restart or a Multi-AZ failover, and the WAL section is populated rather than empty.
- Restrict access. The installer revokes the schema from
PUBLIC. GrantUSAGEandSELECTonly to roles that read reports. - Use this alongside CloudWatch Database Insights. The repository gives SQL-native, snapshot-based history that you own and can attach to a support case. CloudWatch Database Insights gives continuous one-second wait analysis in a graphical interface.
Security considerations
The two collectors read query text from different sources, and the difference matters. pg_stat_statements strips literals, so the SQL sections show normalized statements. pg_stat_activity does not: its query column holds the statement as submitted, literals included. sample_activity() stores that raw text alongside client_addr, and the ASH and SOURCES sections show both. Enabling the sampler therefore stores raw statement text and client addresses for your whole retention window.
- Before enabling the sampler, review how your application passes values. Applications using bind parameters are unaffected. Those that interpolate account identifiers, personal data, or credentials into statement text will have them captured.
- If that is a concern, modify
sample_activity()to store only a short prefix of the query text, or a hash. TheASHsection still works, because it aggregates on wait event rather than statement text. - Size the retention window deliberately: it is also the exposure window.
- Whoever generates a report should review it before sharing it outside the database team. A report attached to a support case can carry raw statement text and client addresses in its
ASHandSOURCESsections, so check those first, or generate only the sections you need.
Clean up
To remove the solution entirely:
Conclusion
In this post, we showed you how to build an Oracle AWR-style workload report for Amazon RDS for PostgreSQL and Amazon Aurora PostgreSQL using pg_stat_statements and pg_cron. One command lists snapshots and a second generates the report, covering load profile, SQL ranked four ways, hot segments, background and redo activity, sampled wait events, user and client attribution, and configuration changes. It needs no extra infrastructure, and your performance data stays inside your database.
To learn more, see Scheduling maintenance with the PostgreSQL pg_cron extension and Monitoring DB load with Amazon CloudWatch Database Insights on Amazon RDS. For a related continuous-sampling approach, read Monitor Amazon RDS for PostgreSQL and Amazon Aurora PostgreSQL performance using pgsnapper on the AWS Database Blog.
Get the installer from the awr_lite_install repository on GitHub.