AWS Database Blog
Build and explore Knowledge Graphs faster with Amazon Neptune using Graph.Build and G.V() – Part 2
This is a guest blog by Arthur Bigeard, Founder at gdotv, in partnership with Charles Ivie, Sr Graph Architect at AWS.
G.V() is a graph database IDE available for Desktop or on AWS Marketplace, offering extensive graph visualization and querying capabilities for Amazon Neptune and Neptune Analytics.
In Part 1 of this series, we demonstrated how to design, build and load a Labeled Property Graph (LPG) model into Amazon Neptune using Graph.Build.
Powerful exploration of an Amazon Neptune graph is essential for finding insights.
In this post, we show you how to connect G.V() to our Neptune cluster, enabling powerful no-code exploration, querying, and analysis to discover valuable insights on the ingested graph data.
This post is intended for anyone looking to become familiar with graph data. Prior knowledge of openCypher or Gremlin is not required, and sample queries are provided with explanations.
Solution overview
Amazon Neptune clusters are always deployed within a Virtual Private Cloud (VPC) for network isolation. For connectivity, either restrict access to within the VPC or enable a Neptune Public Endpoint for access over the Internet. When a public endpoint is used, enabling IAM database authentication is mandatory for security.
The following architecture shows a Neptune cluster configured for private access within its VPC.
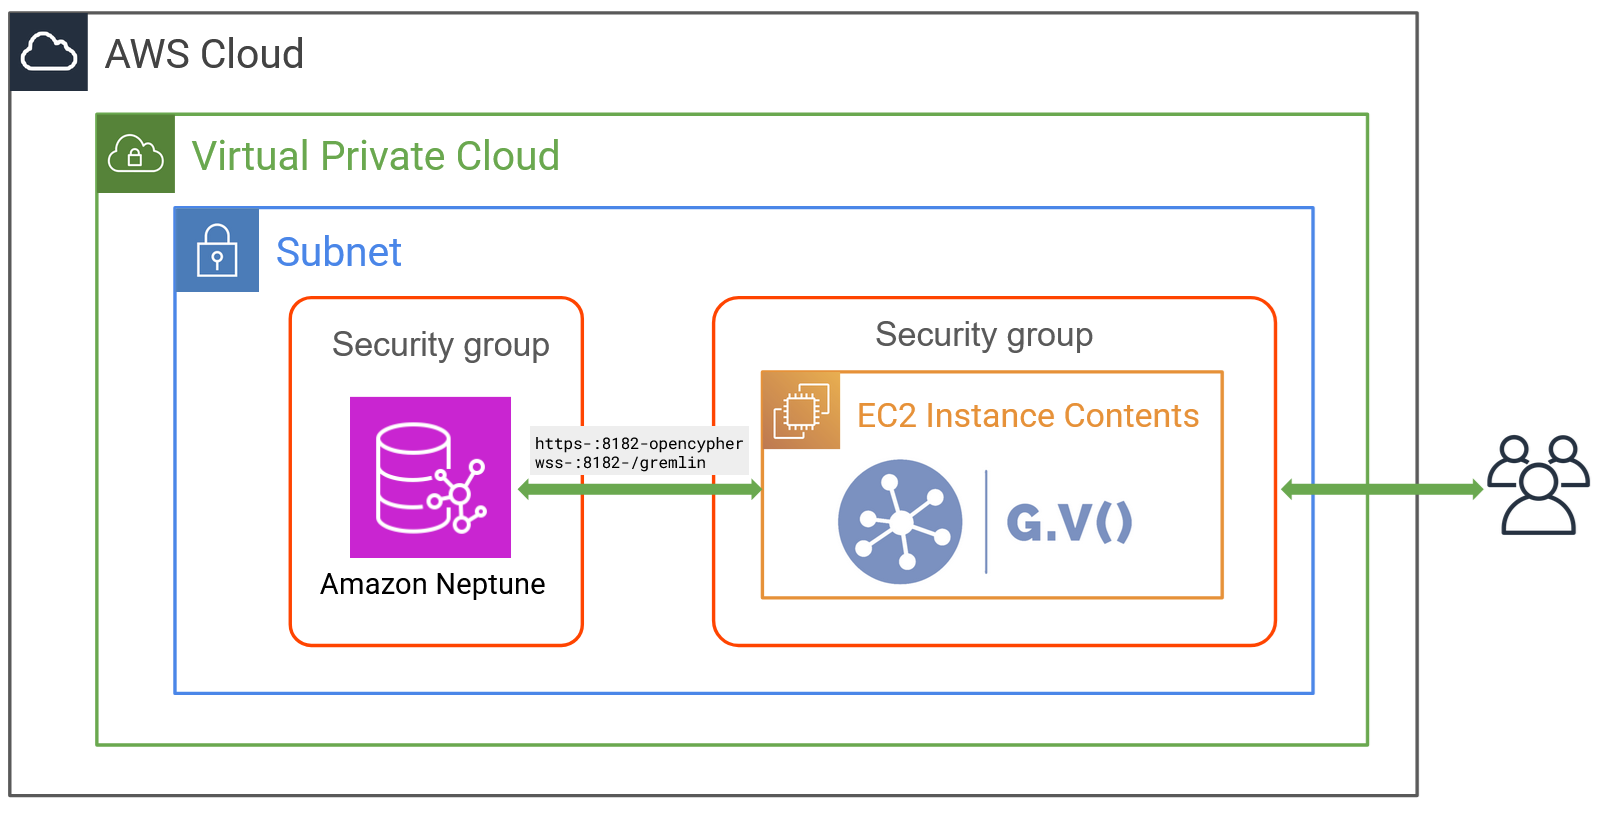
A Neptune cluster is a collection of instances, with the minimum number being 1. Instances can be serverless for on-demand vertical automatic scaling, or distinct instance types. The primary instance acts as the single writer instance, and horizontal scalability is available for read operations by creating additional read replica instances.
G.V() is deployed to an Amazon Elastic Compute Cloud (Amazon EC2) instance in the same VPC as Neptune. Security groups are used to configure network communication permissions between components in the VPC, as well as inbound to the VPC from outside AWS.
G.V() acts as a client application and connects to Neptune through its cluster endpoint. G.V() starts a web server that accepts incoming traffic on port 443, using a self-signed TLS certificate. The high-level implementation steps are as follows:
- Deploy G.V() on Amazon EC2.
- Configure G.V() to connect to Neptune.
- Search and explore the data using G.V().
Customers are responsible for the costs of running the solution. On AWS marketplace, there is a cost for both the Amazon EC2 instance, and G.V() for the specific instance type. For this post, we recommend using a t3.large EC2 instance, so the costs will be as follows.
Examples are taken from the us-east-1 region
|
G.V() – EC2 t3.large |
14-days free trial, then $0.64 per hour |
|
AWS – EC2 t3.large |
$0.0832 per hour |
Prerequisites
A running Amazon Neptune database cluster with data already loaded is required to complete this guide. The first part of this series details how to create a Neptune cluster, design and build a graph model, and load it into Amazon Neptune with no code, using Graph.Build.
Deploy G.V() on Amazon EC2
To deploy G.V() on Amazon EC2, complete the following steps:
- Register for a free 2-week G.V() trial on AWS Marketplace by choosing Try for free.
- Accept the terms and conditions of the offer and automatically create an agreement, and the free trial will start. This process might take up to a couple of minutes.
- Choose Continue to Configuration and choose the same AWS Region the Neptune cluster is deployed to.
- Choose Continue to Launch, then under Choose Action, choose Launch through EC2, and choose Launch again.
Launching through Amazon EC2 offers flexibility with configuration of security group rules and AWS Identity and Access Management (IAM) authentication.
The following is a summary of deployment instructions. For a full step-by-step guide, refer to the G.V() deployment guide.
- To configure communication between G.V() and Neptune, provide the VPC that Neptune is running in.
- Choose a t3.large instance size for G.V().
- If using IAM authentication on the Neptune cluster, we recommend configuring authentication from G.V() via an EC2 instance profile following our documentation.
- Define the security group permissions for the G.V() instance. Ensure access to port 443 is enabled for your IP range at minimum.
- Configure at least 8 GB of storage for the EC2 instance.
- Leave other Amazon EC2 configuration parameters as their default values.
- Choose Launch Instance. G.V() should be deployed and ready to use within 5 minutes.
- Take note of the EC2 instance’s ID and public IPv4 DNS.
- Navigate to the public IPv4 DNS of the deployed EC2 instance.
Because G.V() uses a self-signed TLS certificate by default, it needs to be explicitly trusted in your browser. To configure an alternative, trusted certificate, see Configuring a TLS certificate.
To authenticate to G.V(), enter the following credentials:
For Username, gdotv.
For Password, enter the EC2 instance ID.
G.V() is now ready to use with Neptune.
Configure G.V() to connect to Neptune
You can connect to Neptune by following these three steps:
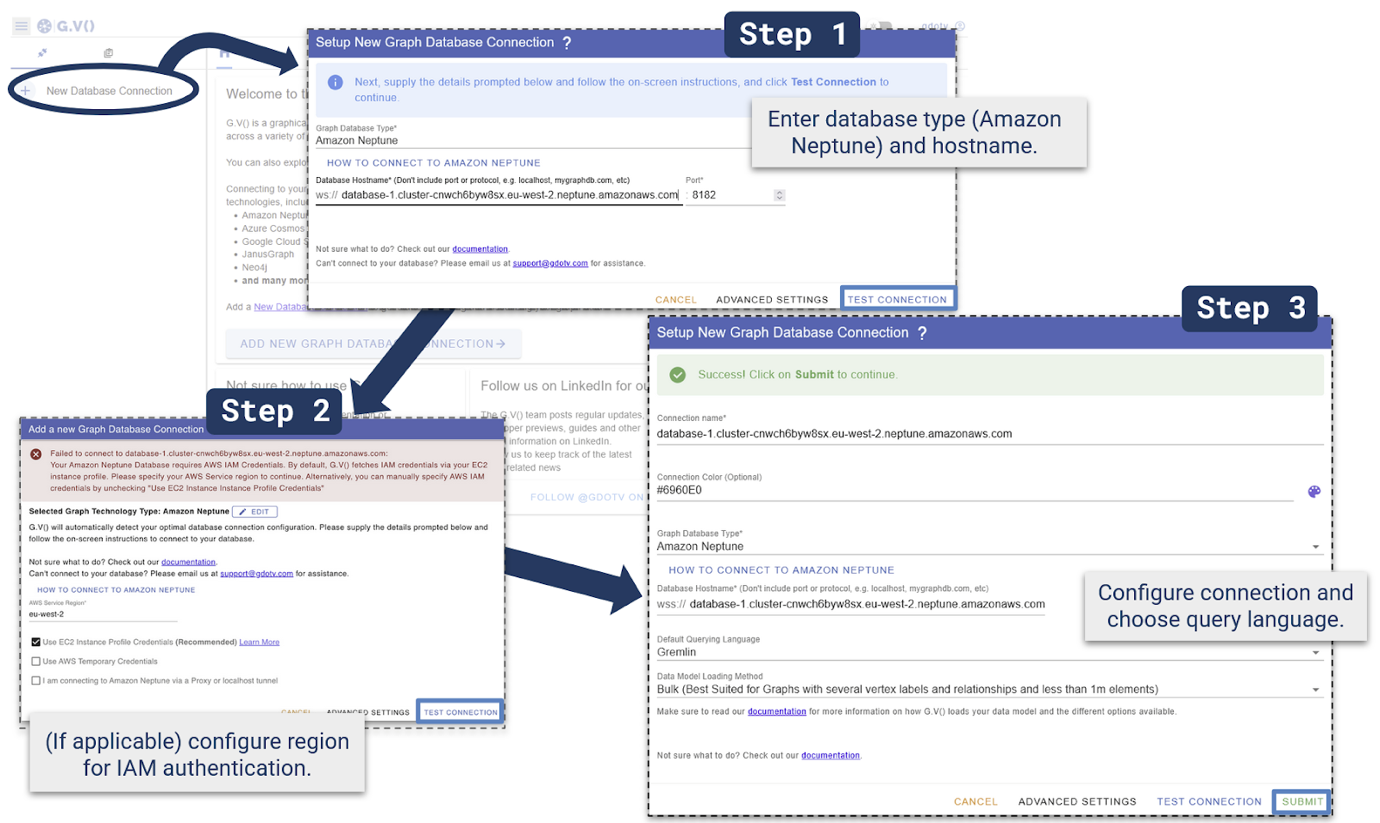
Step 1 – Add connection details
Choose New Database Connection, Amazon Neptune and enter the Neptune cluster hostname, it looks like the following:
Test Connection
Step 2 – (If applicable) configure IAM authentication
If an EC2 instance profile is configured, it will be used automatically – otherwise enter AWS IAM credentials manually and test the connection.
If this step fails, this indicates a misconfiguration. Refer to the G.V documentation for EC2 instance and IAM configuration.
Step 3 – Configure connection
>For Default Querying Language, choose Gremlin. Configure other elements, like the connection name and connection color if desired, then Submit.
You can now query the Neptune cluster on G.V() to visualize and explore the graph data created during Part 1.
First checks and quality control within G.V()
Run the following query.
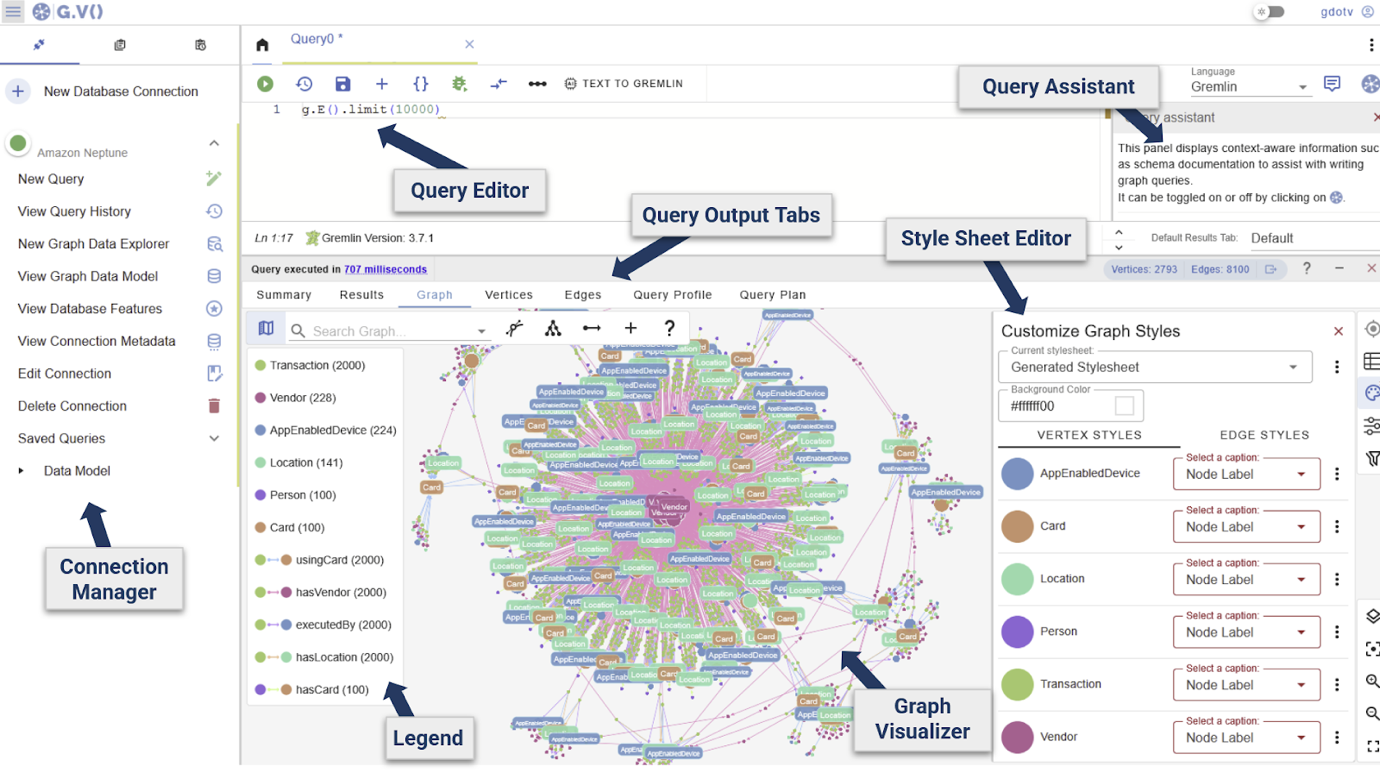
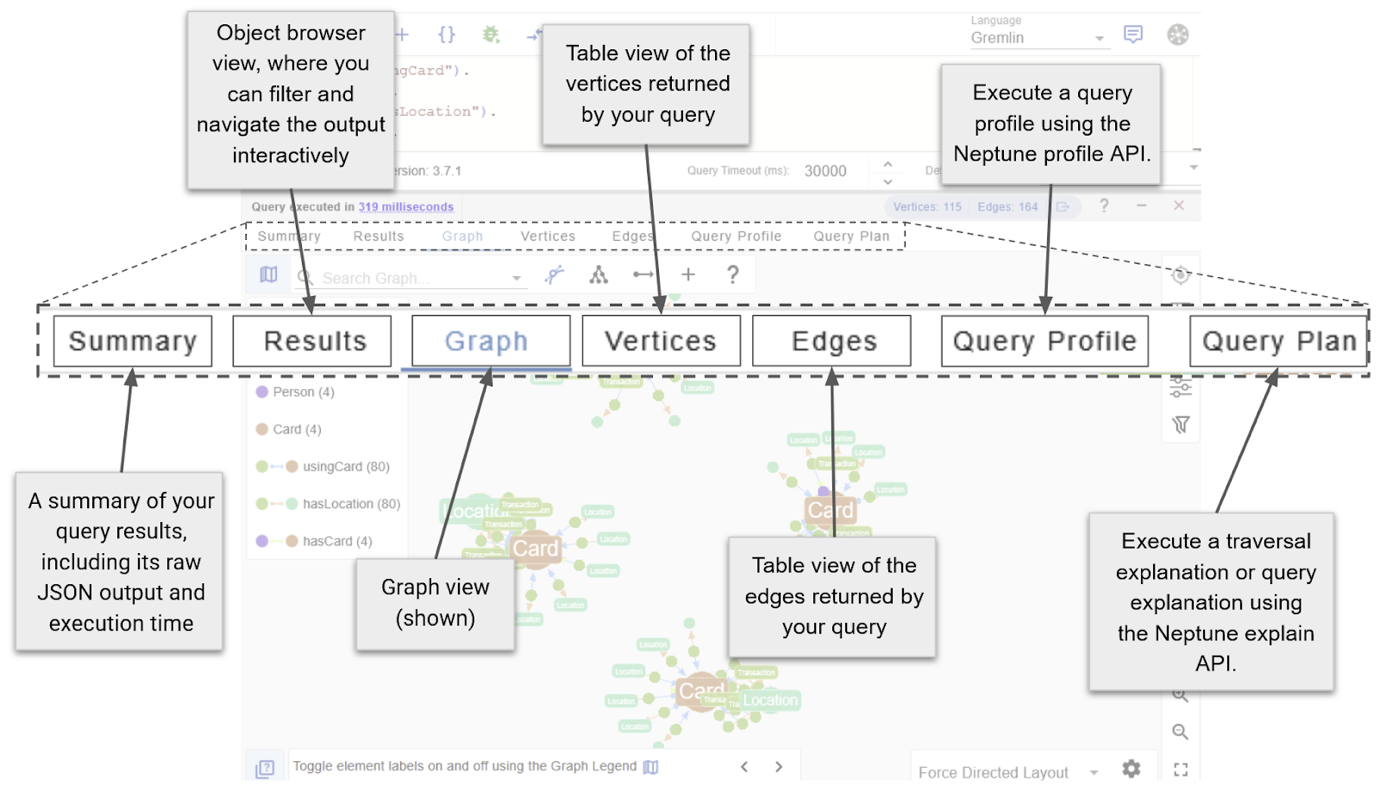
Explore the different visual components showing a sample of the graph data ingested during Part 1.
There are three main exploration views, each of which can be opened from the Connection Manager, highlighted above.
- Query Editors (previous image) – Write and execute a Gremlin, Cypher, or SPARQL queries.
- Graph Data Explorers – Explore data using path definitions and filters, without the need to write a query.
- Graph Data Model views – Graph data schema as an entity-relationship diagram.
The graph is opened in the Query Editor view by default and is suited for traditional query-based checks in Gremlin, Cypher, or SPARQL for RDF graphs.
For broader validation, the Data Model provides a general overview of the graph schema, while the Data Explorer returns visual results and a method for navigation without the need to manually write code.
Use the Data Model and Data Explorer to answer questions like “How are Card nodes linked to with Location nodes?” or “Which Card nodes have links to this particular Location node?” respectively.
For a reference on how to use the Graph Data Explorer view or the Data Model view, see the following cheat sheet:
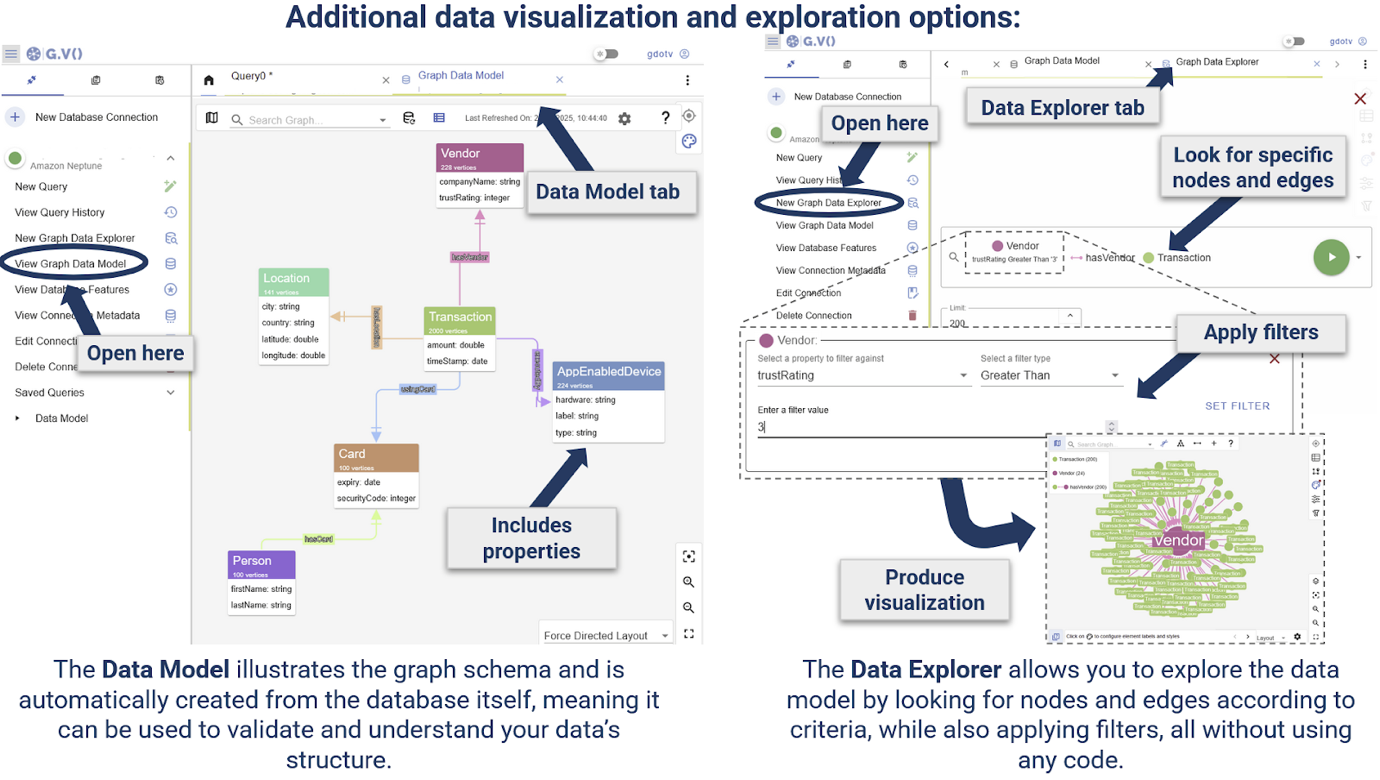
You can organise multiple instances or combinations of these views into tabs.Choose View Graph Data Model.
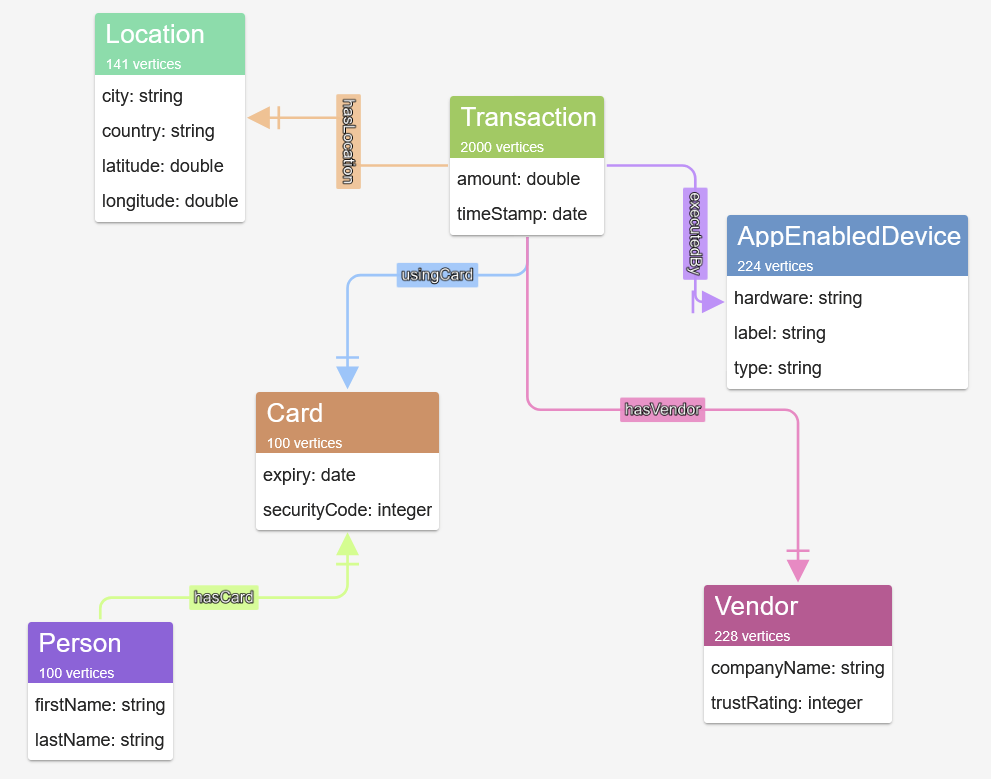
Inspect the schema that has been inferred from the graph by G.V().
We can see various nodes including Person, Card and Transaction nodes, edges and properties.
This gives an overview of the data structure and validates that the ingested data structure matches the schema defined in Part 1. Because the Data Model is generated directly from the graph, it provides a strong validation check that the graph schema is behaving as intended.
Uncovering insights from the dataset
You can query Neptune property graphs using Gremlin and Cypher. We use Gremlin in the following examples.
When running a query, various data output formats organized into tabs are available to explore the query results. Choose Graph View
Execute the following query, to search for a user person with the name ‘Eve Homenick’ and return their linked cards and transactions.
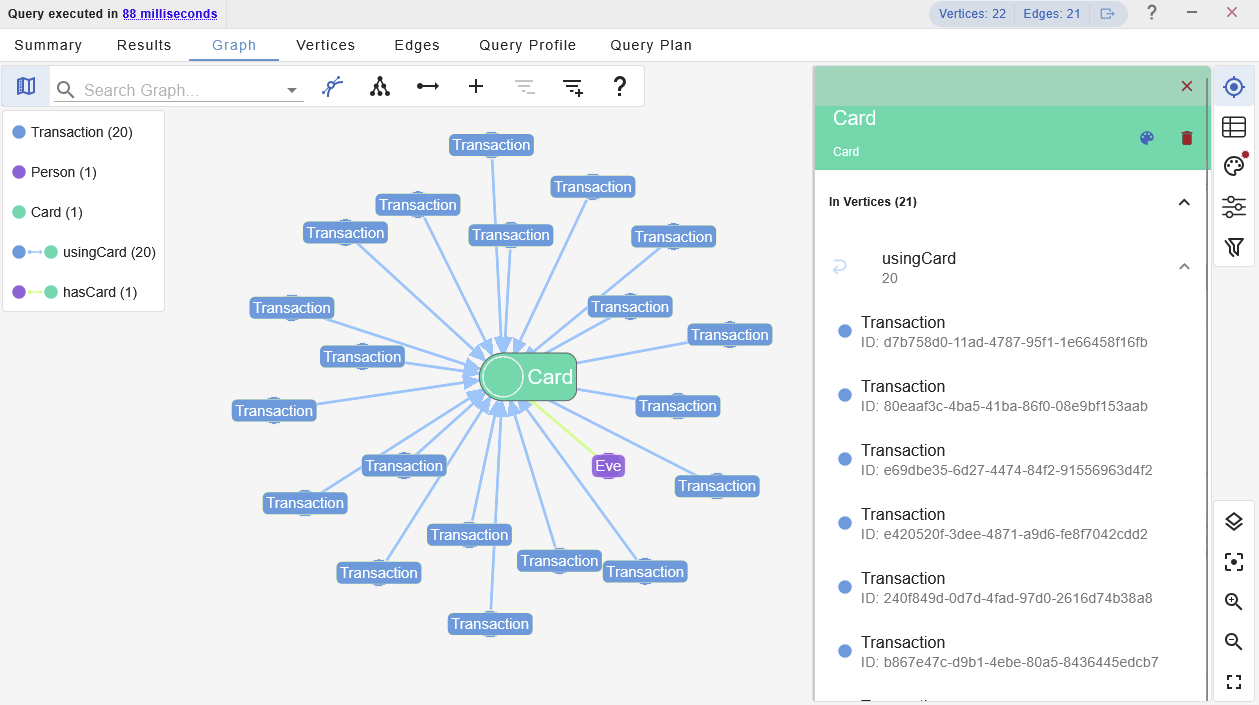
Choose the Card node to explore the associated neighbours in more detail. In this case, listing the In Vertices is all we need to produce an itemized list of associated transactions.
This could be useful if this user is under investigation, as either a victim, or perpetrator, of fraudulent transactions.
When looking for fraud, investigators may need to run the same query repeatedly, passing in values such as they Person’s name as parameters.
Assume the investigator wanted to look at a different individual. Set parameters as variables for firstName and lastName.
G.V()’s query assistant will automatically detect them and prompt for the parameter values:
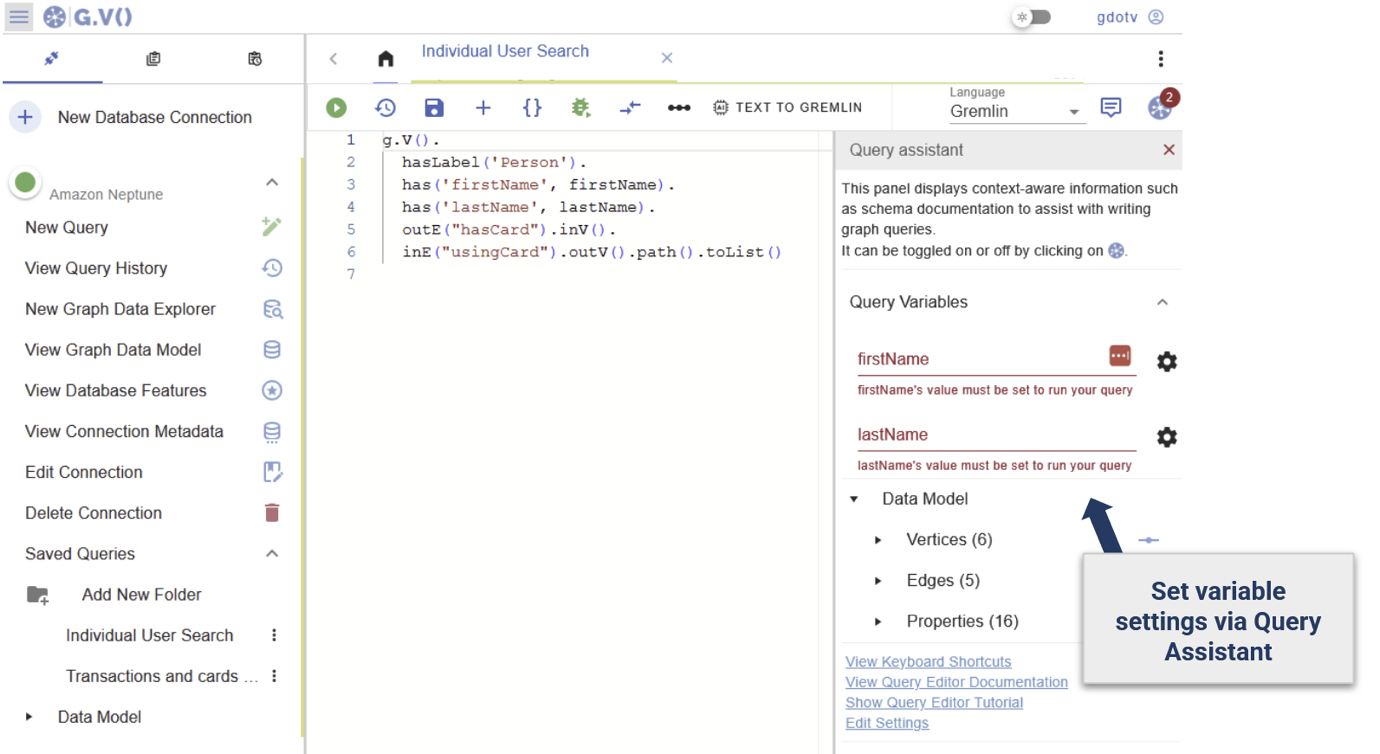
Save the query for later access:
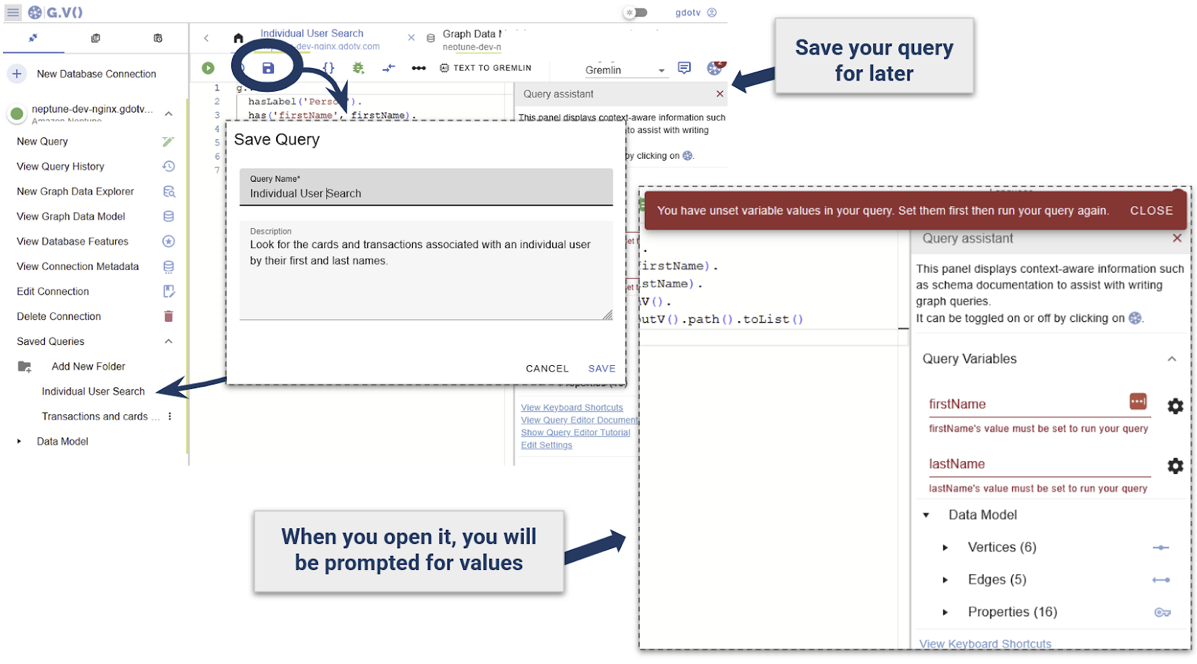
When saving a query with custom parameters like this, they will be prompted back to the user prior to running the query, allowing the ability to emulate stored procedures.
This eliminates the need to rewrite the query, leave it open, or save elsewhere. Write it once, including any necessary parameter directly in the query, and G.V() will auto detect these. This allows building a library of reports against the Neptune cluster that can be accessed and run.
Looking for suspicious behavior
This synthetic dataset demonstrates fraudulent credit card transaction events.
Multiple transactions being made from widespread geographical locations over a short period of time could indicate fraudulent activity.
Execute the following query to:
- Find Person vertices, and find their card using the
hasCardrelationship - Filter out the cards to retain those containing transactions that have been performed from at least five different locations
- For the filtered cards, retrieve the path from the card to the location through the transaction that was performed
Choose Graph View
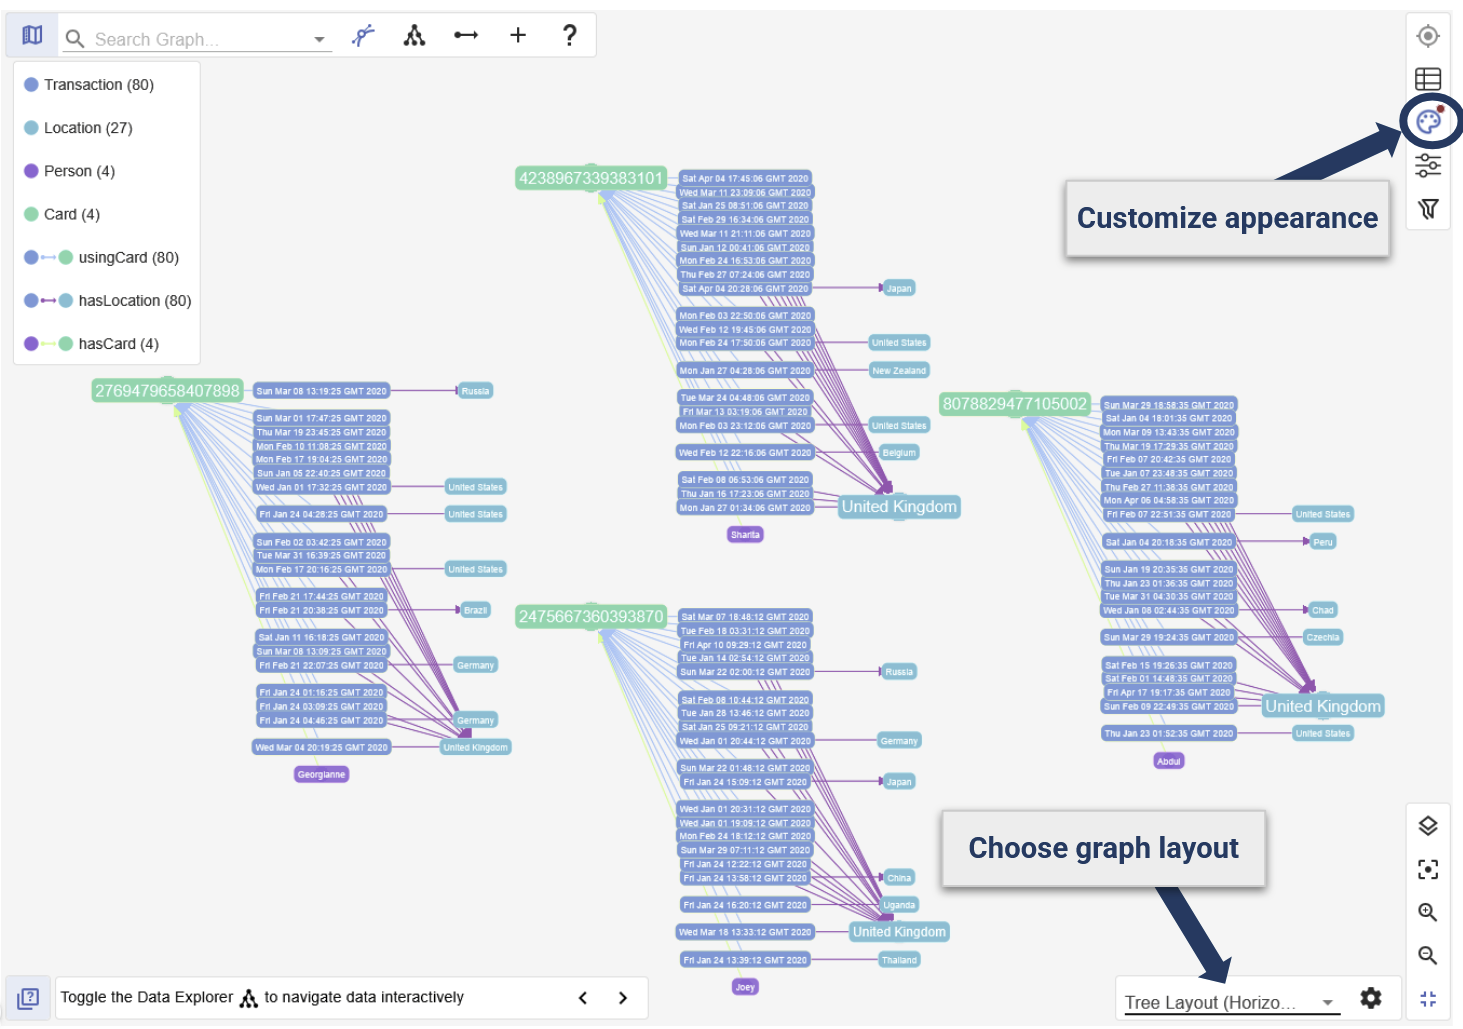
Analysis shows that multiple transactions have occurred in five different countries within just a few hours.
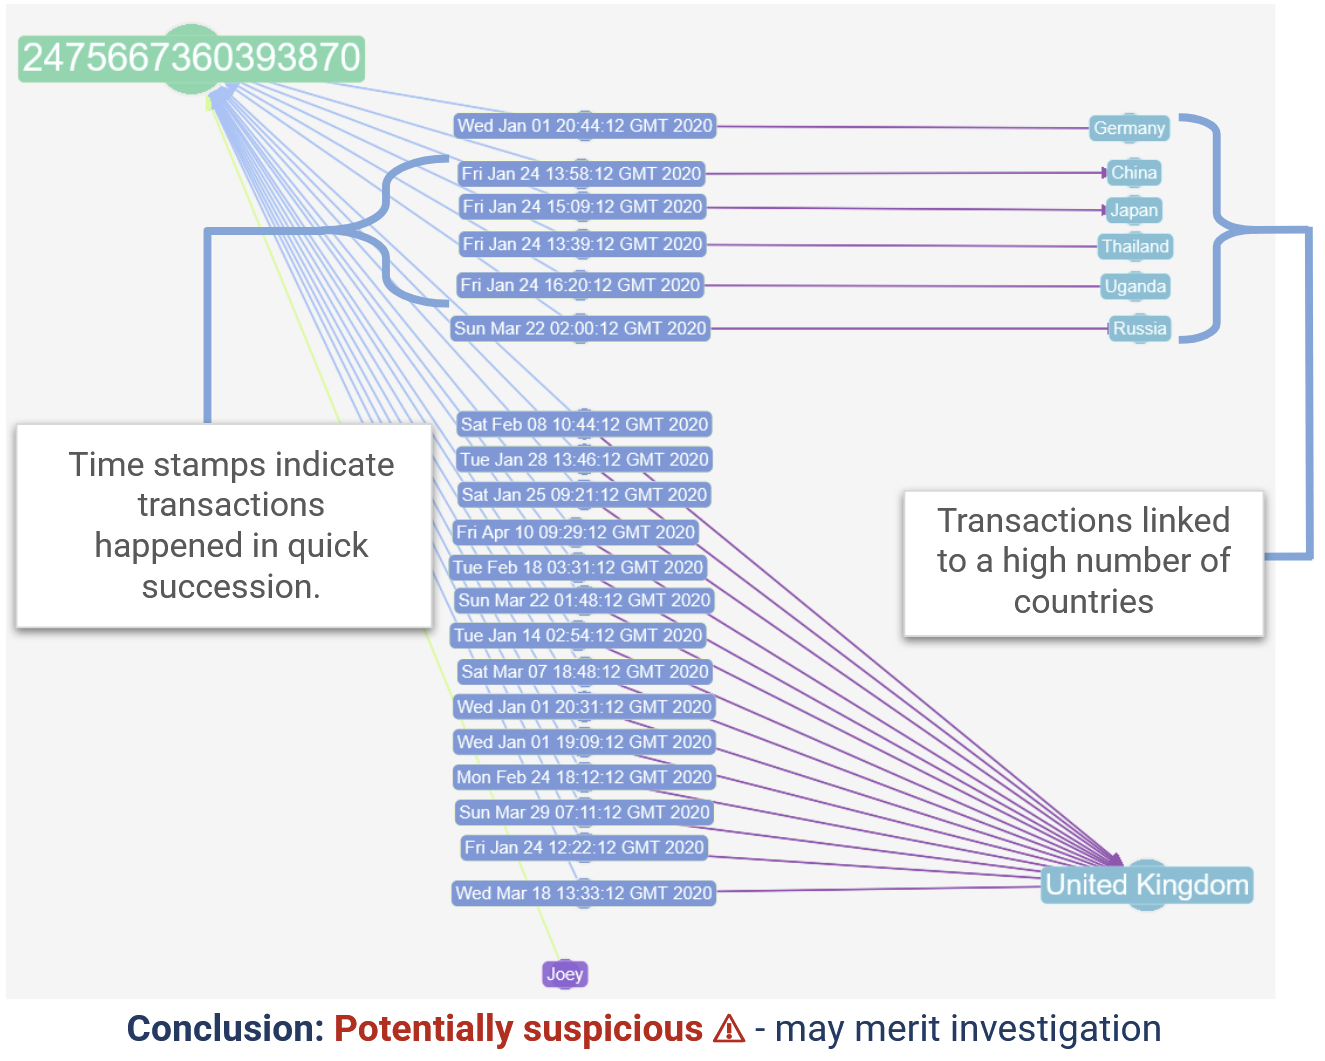
Improve the WHERE condition to target transactions occurring within a short time span across multiple locations.
Deciding how many locations are sufficient to qualify a transaction history as ‘suspicious’ is subjective, so having the number of locations as an adjustable parameter is useful. You can use the Query Assistant to create and manually adjust parameters.
Here we look at any cards that have transactions linked to more than a single location:
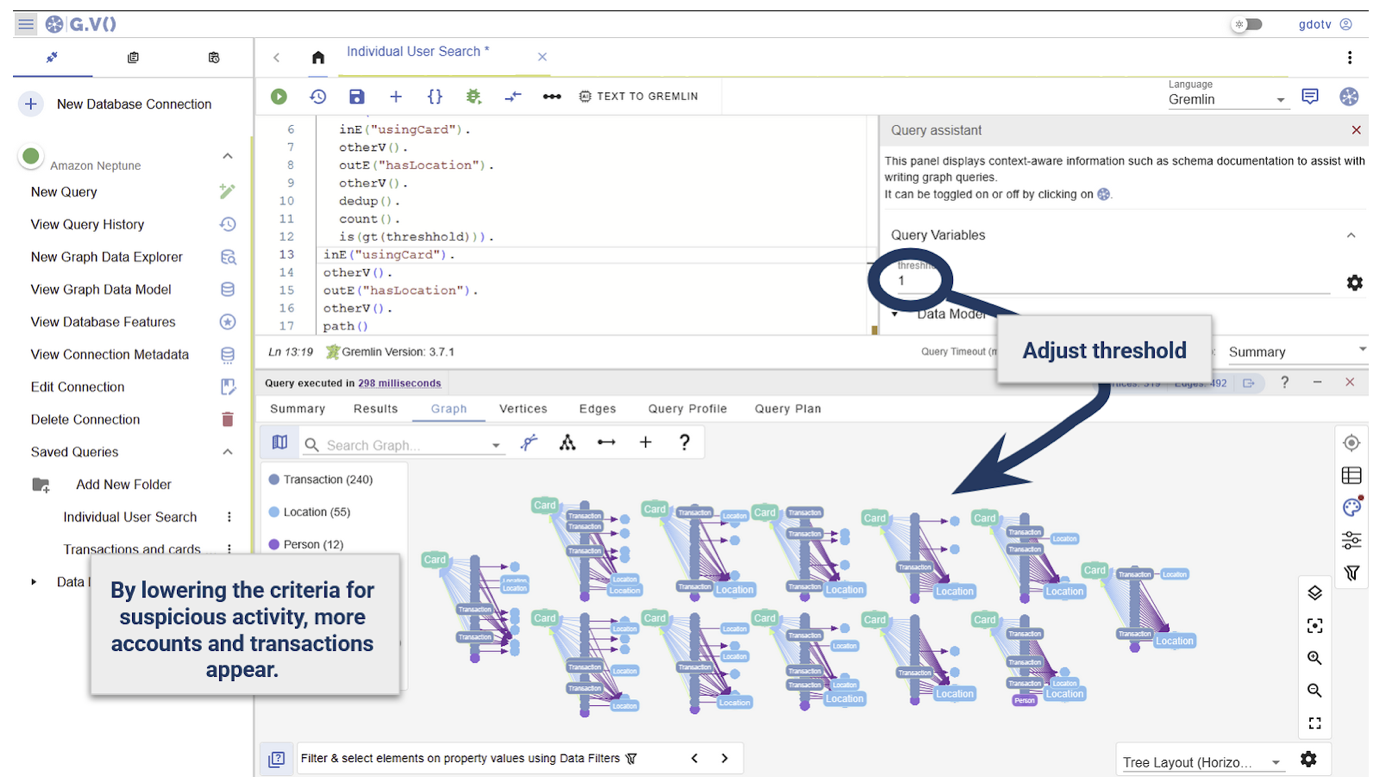
Using parameters, reports can be adjusted to the thresholds and context such as investigating a specific user or transaction.
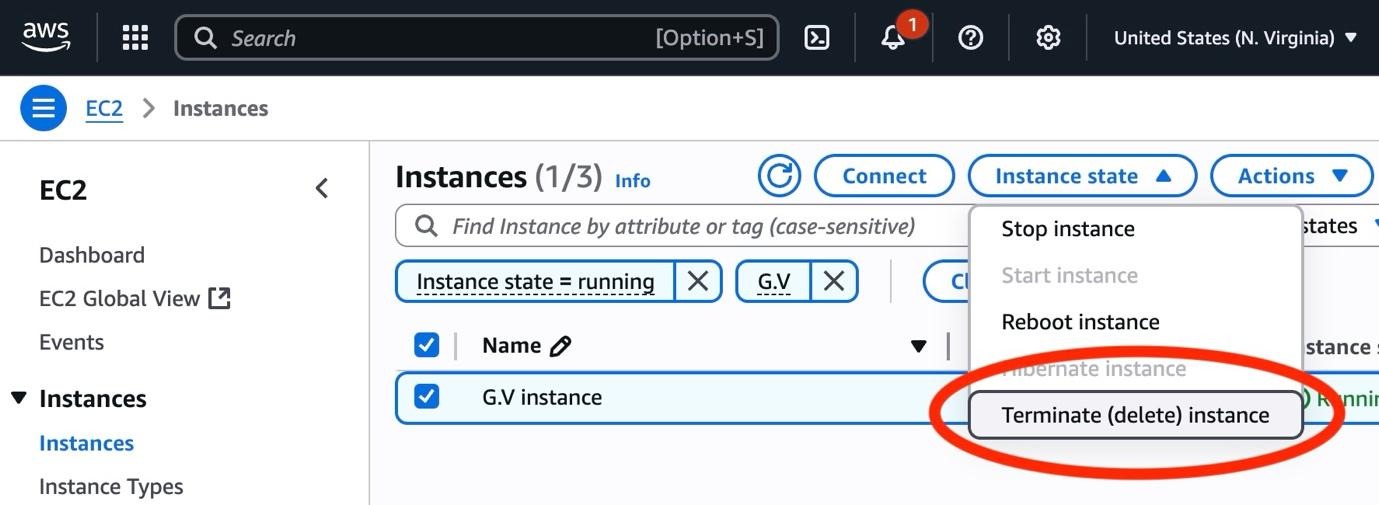
Cleanup
Navigate to the EC2 section on the AWS console, choose instances, select the G.V() instance’s checkbox, then choose instance state, terminate.
If you no longer need the Amazon Neptune cluster created in this post, review the Amazon Neptune documentation for how to delete the cluster.
Conclusion
In this post, we demonstrated the basics of deploying G.V() and configuring it to connect to a Neptune cluster.
G.V() offers a wide range of tools to explore graph data, design complex graph queries, and create configurable reports. This makes querying, exploring and visualizing graph data significantly easier, without the need to build complex, bespoke solutions.
Our documentation offers a comprehensive overview of our features and compatibility with other graph databases and engines, such as Neptune Analytics and other partners, such as Neo4J.