AWS Database Blog
Diagnose and resolve replica lag in Amazon RDS for Oracle replicas – Part 2
This post is the second in a two-part series on reducing replication lag for Amazon Relational Database Service (Amazon RDS) for Oracle Read Replicas. In Part 1, we discussed redo compression and configuration options to optimize replica lag.
In this post, we show you how to:
- Monitor replica lag using Amazon CloudWatch metrics and database views.
- Identify common root causes through wait event analysis.
- Follow a step-by-step troubleshooting approach to resolve performance issues.
When you experience replica lag in your Amazon RDS for Oracle Read Replicas, quick diagnosis and resolution become essential. Lag can affect your ability to maintain disaster recovery readiness, delay data availability for reporting workloads running on Read Replicas, and slow down standard maintenance activities such as database major and minor version upgrades.
Whether the issue originates from configuration settings, application workload patterns, or resource constraints, we provide you with a systematic approach to identify the root cause and implement targeted solutions.
Prerequisites
Before you begin, make sure you have the following:
- Oracle Enterprise Edition (EE) — Read Replicas require Enterprise Edition as the primary instance because Oracle Data Guard, which powers the replication, is only available in this edition.
- DB instance class with two or more vCPUs — The replication processes require sufficient compute resources to function properly.
- Appropriate licensing — An Active Data Guard license is required for read-only mode but isn’t needed for mounted replicas. Review the specific version and license limitations in Requirements and considerations for RDS for Oracle replicas.
Troubleshooting replication lag for Amazon RDS for Oracle
This section covers identification methods and common causes. Once you’ve identified that lag exists, you can use the techniques in the following sections to pinpoint the root cause and implement a solution.
How to identify replica lag
You can identify replica lag using Amazon CloudWatch metrics or by querying Oracle database views directly. You can quickly identify lag using CloudWatch metrics, while database views offer more detailed diagnostic information.
For Amazon RDS for Oracle, the ReplicaLag CloudWatch metric is available only for Read Replica instances. For more information on CloudWatch metric granularity, see CloudWatch metrics documentation.
Amazon CloudWatch metric – ReplicaLag
ReplicaLag CloudWatch metric displays the delay in applying redo at the Read Replica. High apply lag indicates resource constraints (CPU, I/O) or similar issues in the Read Replica affecting the apply process.
To view the metric:
- Navigate to the Monitoring tab of your Read Replica instance.
- Under the CloudWatch section, search for “ReplicaLag”.
- Review the current replica lag at the database level.
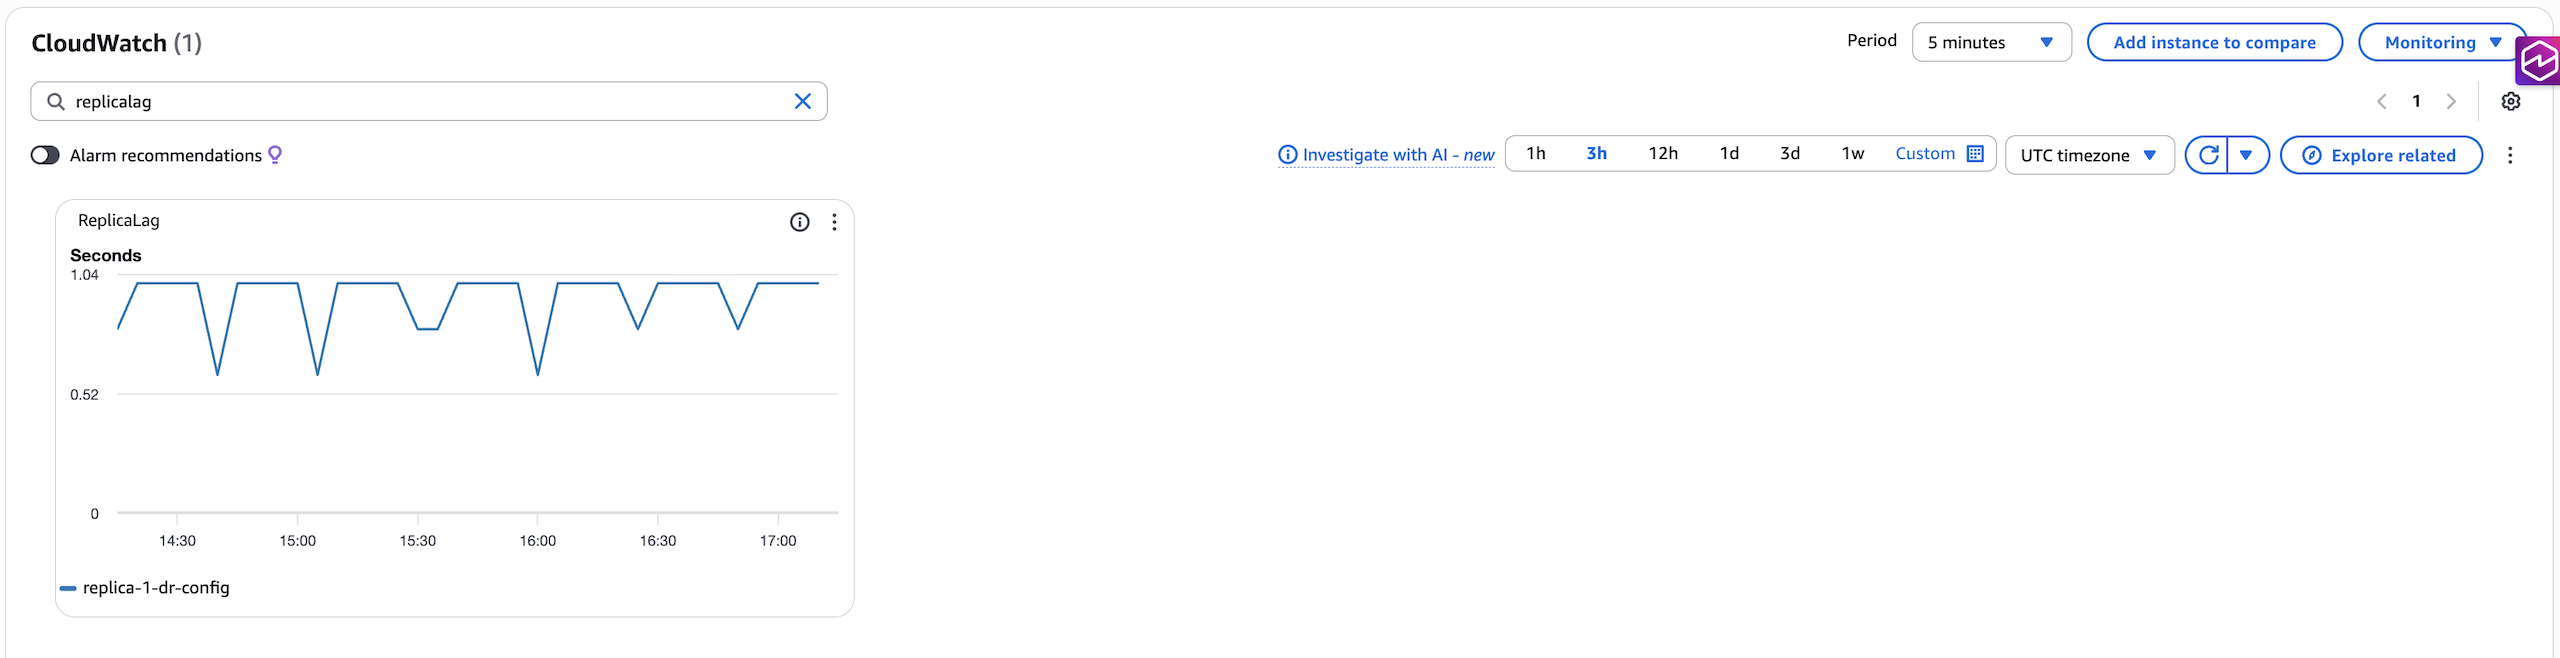
Note: RDS uses asynchronous redo transport for read replicas, so replica lag may show a lag of 1 second when there is no database activity. You can run database queries manually on V$ views or on your application tables to validate if database changes are in sync.
Amazon CloudWatch metric – ReplicaTransportLag
The ReplicaTransportLag CloudWatch metric measures the delay in transporting redo from the primary database to the Read Replica. If you see high transport lag, this typically indicates network issues or bottlenecks on the primary.
To view the metric:
- Navigate to the Monitoring tab of your Read Replica instance.
- Under the CloudWatch section, search for “ReplicaTransportLag”.
- Review the current replica lag at the database level.
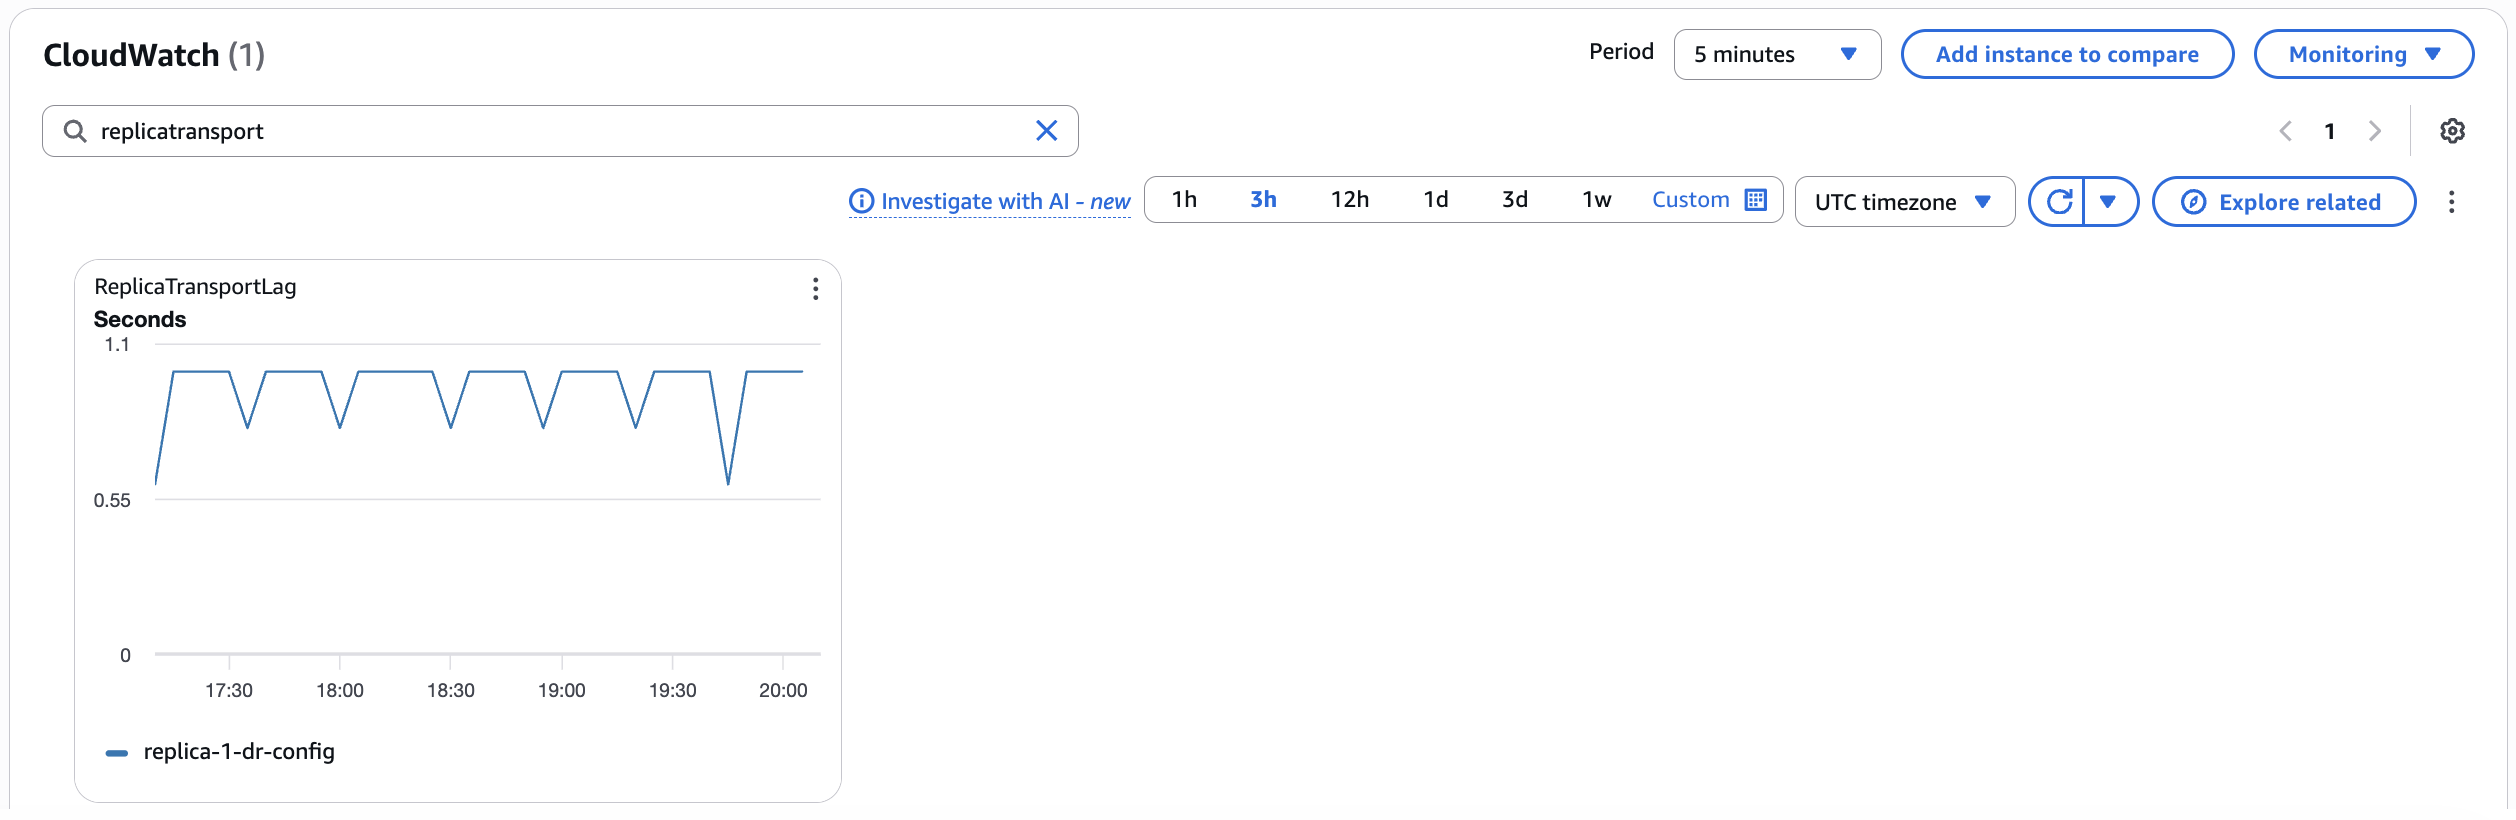
By comparing these metrics, you can determine whether lag is caused by transport delays or apply process bottlenecks.
Standard database queries
For more detailed diagnostic information related to replica lag, you can query Oracle database views directly. As mentioned in the public documentation, the following views help you diagnose replica lag:
V$ARCHIVED_LOG.V$DATAGUARD_STATS.V$DATAGUARD_STATUS.V$ARCHIVE_GAP.
You can query the lag-related views (V$DATAGUARD_STATS, V$DATAGUARD_STATUS, and V$ARCHIVE_GAP) on the Read Replica instance to get the status of the lag. You can query V$ARCHIVED_LOG on both the primary and Read Replica to compare and identify the log status between instances.
Note: For a mounted Read Replica of Amazon RDS for Oracle, you cannot query database views on the Read Replica because the database is not accessible for queries. The ReplicaLag and TransportLag CloudWatch metrics provide monitoring lag information. Additionally, you can download and review the alert log to identify replication lag or apply issues.
Common factors that cause replica lag
Now that you understand how to identify replica lag, this section explores the common causes. Replica lag in Amazon RDS for Oracle results from three main categories: configuration issues, application workload patterns, or external factors.
Configuration issues
Your infrastructure and database settings play a key role in replication performance. Common configuration issues include insufficient or undersized redo and standby logs, memory settings that don’t meet expected levels, and compute or storage resources that are inadequate for handling your primary or Read Replica database workload.
Application workload patterns
The way your applications interact with the database can significantly impact replication performance. High-volume operations such as batch jobs and high-concurrency workloads can generate excessive redo, overwhelming the replica’s ability to keep up. Similarly, read-intensive queries running on your Read Replicas can consume significant compute and storage resources, slowing down the apply process.
Your database design choices can also contribute to lag. Excessive commits increase redo generation, while triggers that restrict operations of privileged users (SYS, SYSTEM, RDS_DATAGUARD, or rdsdb) can interfere with internal replication processes.
External factors
Network latencies can also contribute to replica lag, particularly for cross-region Read Replicas. Part 1 of this series explains in detail how to address lag related to network latencies.
Troubleshooting replica lag
Once you’ve identified that replica lag exists using the preceding methods, the next step is determining the root cause. The root cause can originate at the primary instance or the Read Replica instance.
When troubleshooting or identifying the root cause of replica lag in Amazon RDS for Oracle, we recommend that you enable CloudWatch Database Insights (DBI) and Enhanced Monitoring (EM) with 1-second granularity on both the primary and Read Replica instances. You can then use these tools to actively validate system load in near real-time, which provides finer detail than the 1-minute granularity of CloudWatch metrics.
Typically, the root cause of replica lag relates to events occurring when the lag started to increase. Evaluating DBI and EM graphs for that timeframe (within 5–10 minutes) often reveals what changed in the system. By correlating database wait events and resource contentions, you can identify the issue and take appropriate steps to mitigate or resolve it.
Note: If no unique anomalies are visible to you when lag increases, compare Active Session History (ASH) or Automatic Workload Repository (AWR) reports between periods with and without lag to identify the delta. For guidance on generating AWR reports for Read Replicas, see Generate AWR reports for Amazon RDS for Oracle read replicas.
When troubleshooting replica lag, identifying database wait events will help you to pinpoint the root cause. Wait events indicate where the database is spending time or holding resource without expected database activity. The following wait events are commonly associated with replica lag:
Data Guard process wait events
You can monitor these wait events by querying V$DATAGUARD_PROCESS:
- Log Network Server (LNS) wait on SENDREQ or ARCH wait on SENDREQ.
- Managed Recovery Process (MRP) wait on archivelog arrival or WAIT_FOR_LOG.
Session-level wait events
These wait events affect database sessions, and you can monitor them by querying V$SESSION:
- log file sync.
- db file sequential read / db file scattered read / db file parallel write.
- CPU-related waits or high DB CPU time.
These wait events are directly or indirectly related to replica lag. Based on the root cause you identify, take appropriate action to eliminate/reduce these wait events to reduce replication lag.
Common causes and solutions
Redo logs not sufficiently sized
The archive_lag_target parameter controls how frequently log switches occur. This parameter specifies the maximum time (in seconds) before a log switch is forced. In Amazon RDS for Oracle, the maximum value is 300 seconds, notably different from Oracle’s native maximum of 7200 seconds (2 hours). This Amazon RDS for Oracle specific limits results in at least 12 log switches per hour. If your redo logs are too small for your workload, log switches happen too frequently. This causes increased checkpoints and I/O spikes, which can overwhelm both the primary and Read Replica.
Use the following query to identify hourly archive log generation:
This query provides a historical view of redo generation volume and log switch frequency per hour, helping you identify peak periods and determine whether your current redo log size is adequate.
Note: ALTER SYSTEM/DATABASE commands are restricted in Amazon RDS for Oracle instance, follow performing common log-related tasks for Oracle DB instances AWS documentation to use RDSADMIN package to perform required redo log related activity.
Insufficient system configuration for workload
Resource throttling can occur at the compute level (CPU, memory, network bandwidth) or storage level (IOPS/throughput). When your primary or Read Replica doesn’t have sufficient resources, replication processes compete with other database operations, causing lag.
Note: Throughput throttling can happen at the network level too, hence verify the compute chosen for the workload has baseline bandwidth supporting the application workload.
If storage level resource throttling occurs, usually the read/write latency would be higher than 10 Milliseconds. Increasing the IOPS/throughput based on whichever value is throttled will mitigate/fix the issue.
Check if CPU utilization exceeds the allocated max vCPU in DBI. Also verify if the wait events discussed earlier appear in DBI on either source or target. Verify the primary and Read Replica have the same compute and storage configuration. This makes sure the replica can handle peak loads from the source.
Note: High CPU utilization may result from direct load or indirectly from resource throttling (for example, Amazon Elastic Block Store (EBS) IOPS limits causing server processes to wait, which increases CPU utilization). Hence fixing the related root cause can bring the CPU consumption below allocated vCPU
Scenario: Troubleshooting replica lag step-by-step
The following scenario demonstrates how to identify and narrow down the cause of increasing replica lag.
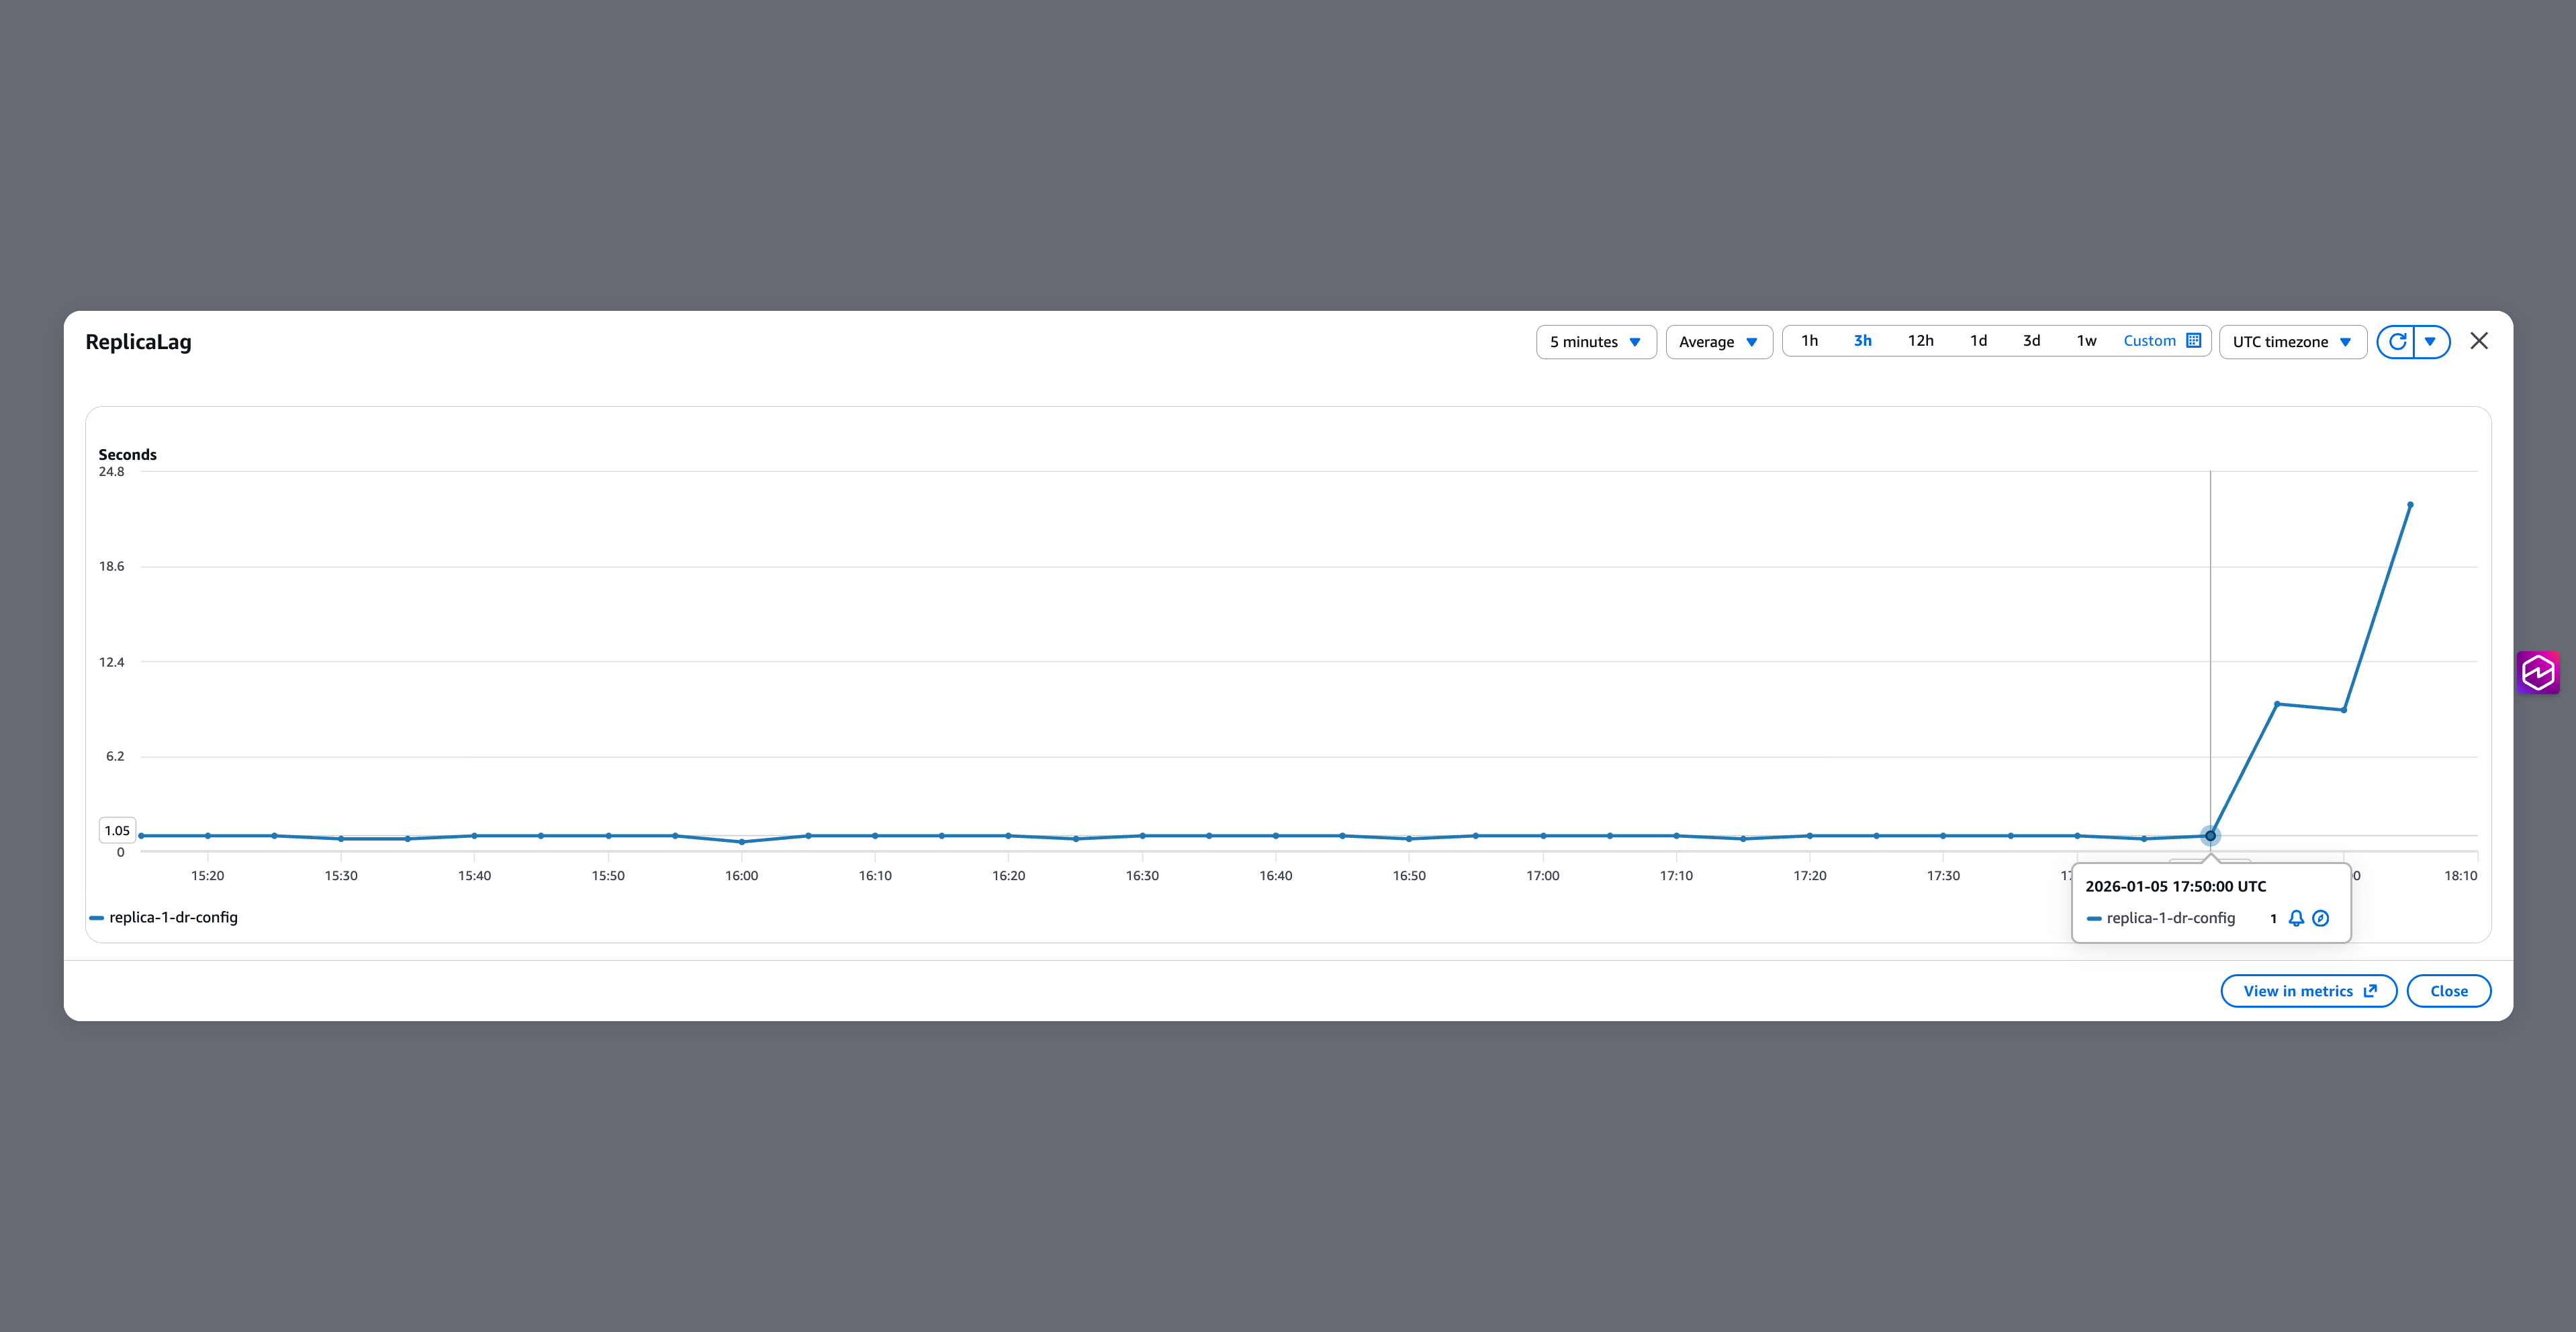
Step 1: Check replica lag in CloudWatch and identify when lag started
Navigate to the Read Replica Instance Monitoring tab to view the ReplicaLag metric. Choose Maximize on the “ReplicaLag” graph to identify the exact start time.
In this example, the snapshot was taken at 18:00 UTC on January 5th. The graph shows replica lag started increasing around 17:50 UTC. The lag started a few minutes ago and is currently at 9.15 seconds.
Step 2: Check DBI on primary
Navigate to the primary database instance in the AWS Management Console.
Choose Monitoring → Database Insights. The default view shows the last 3 hours.
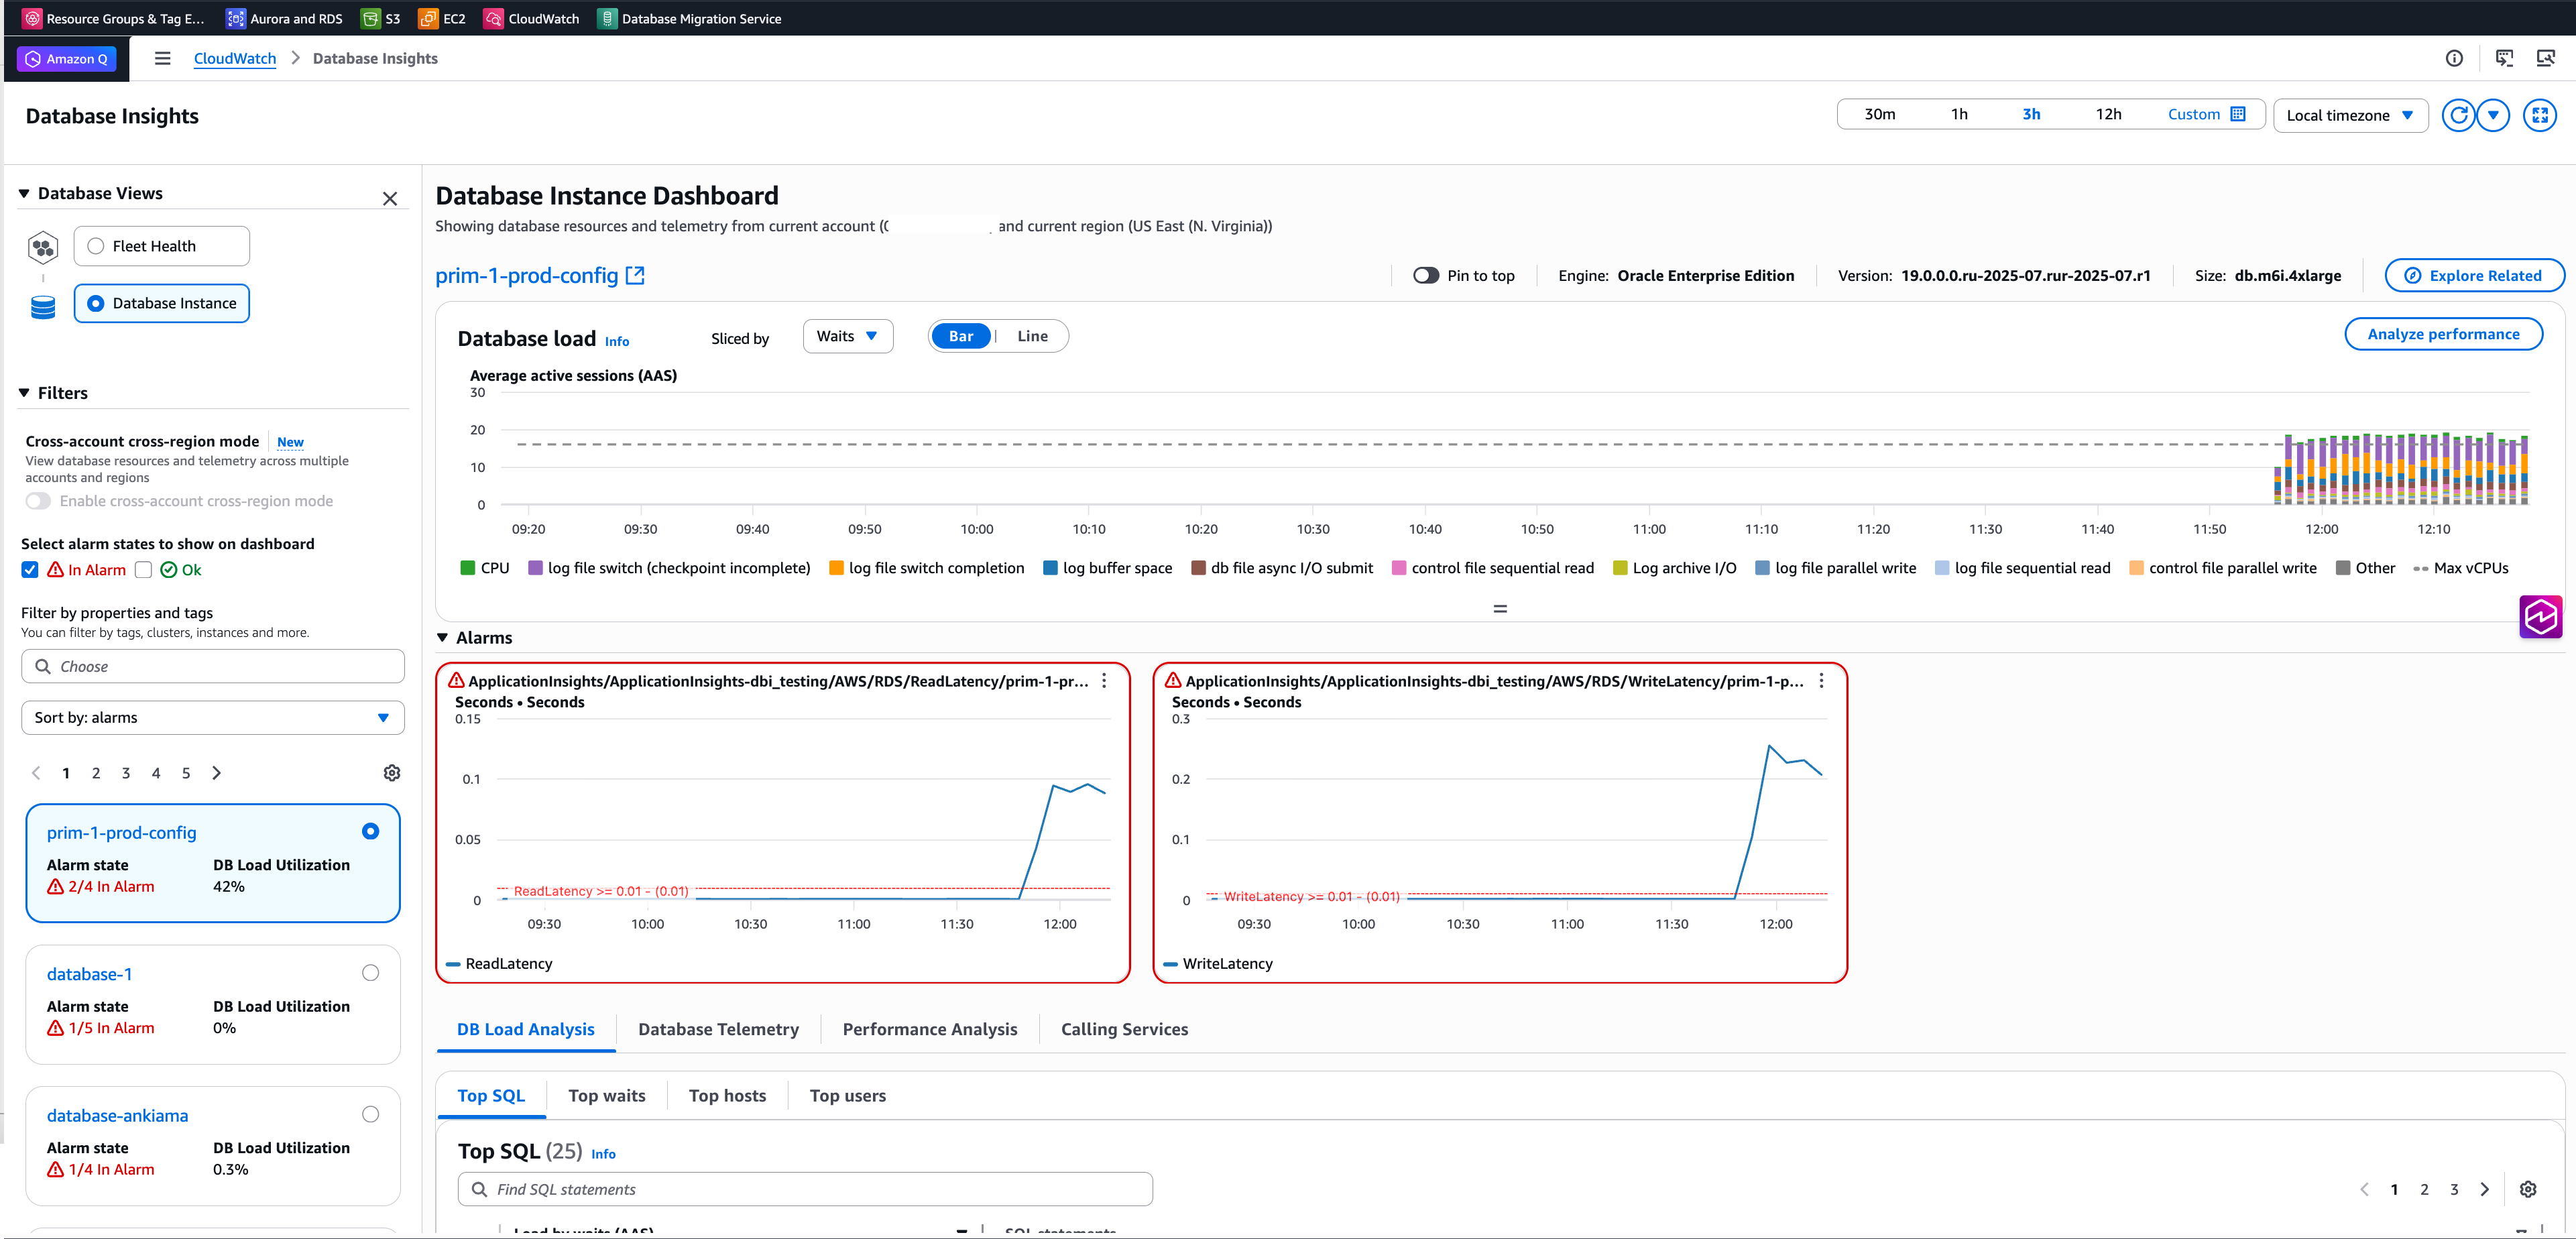
Choose Custom in the top-right corner to select the appropriate time range for analysis.
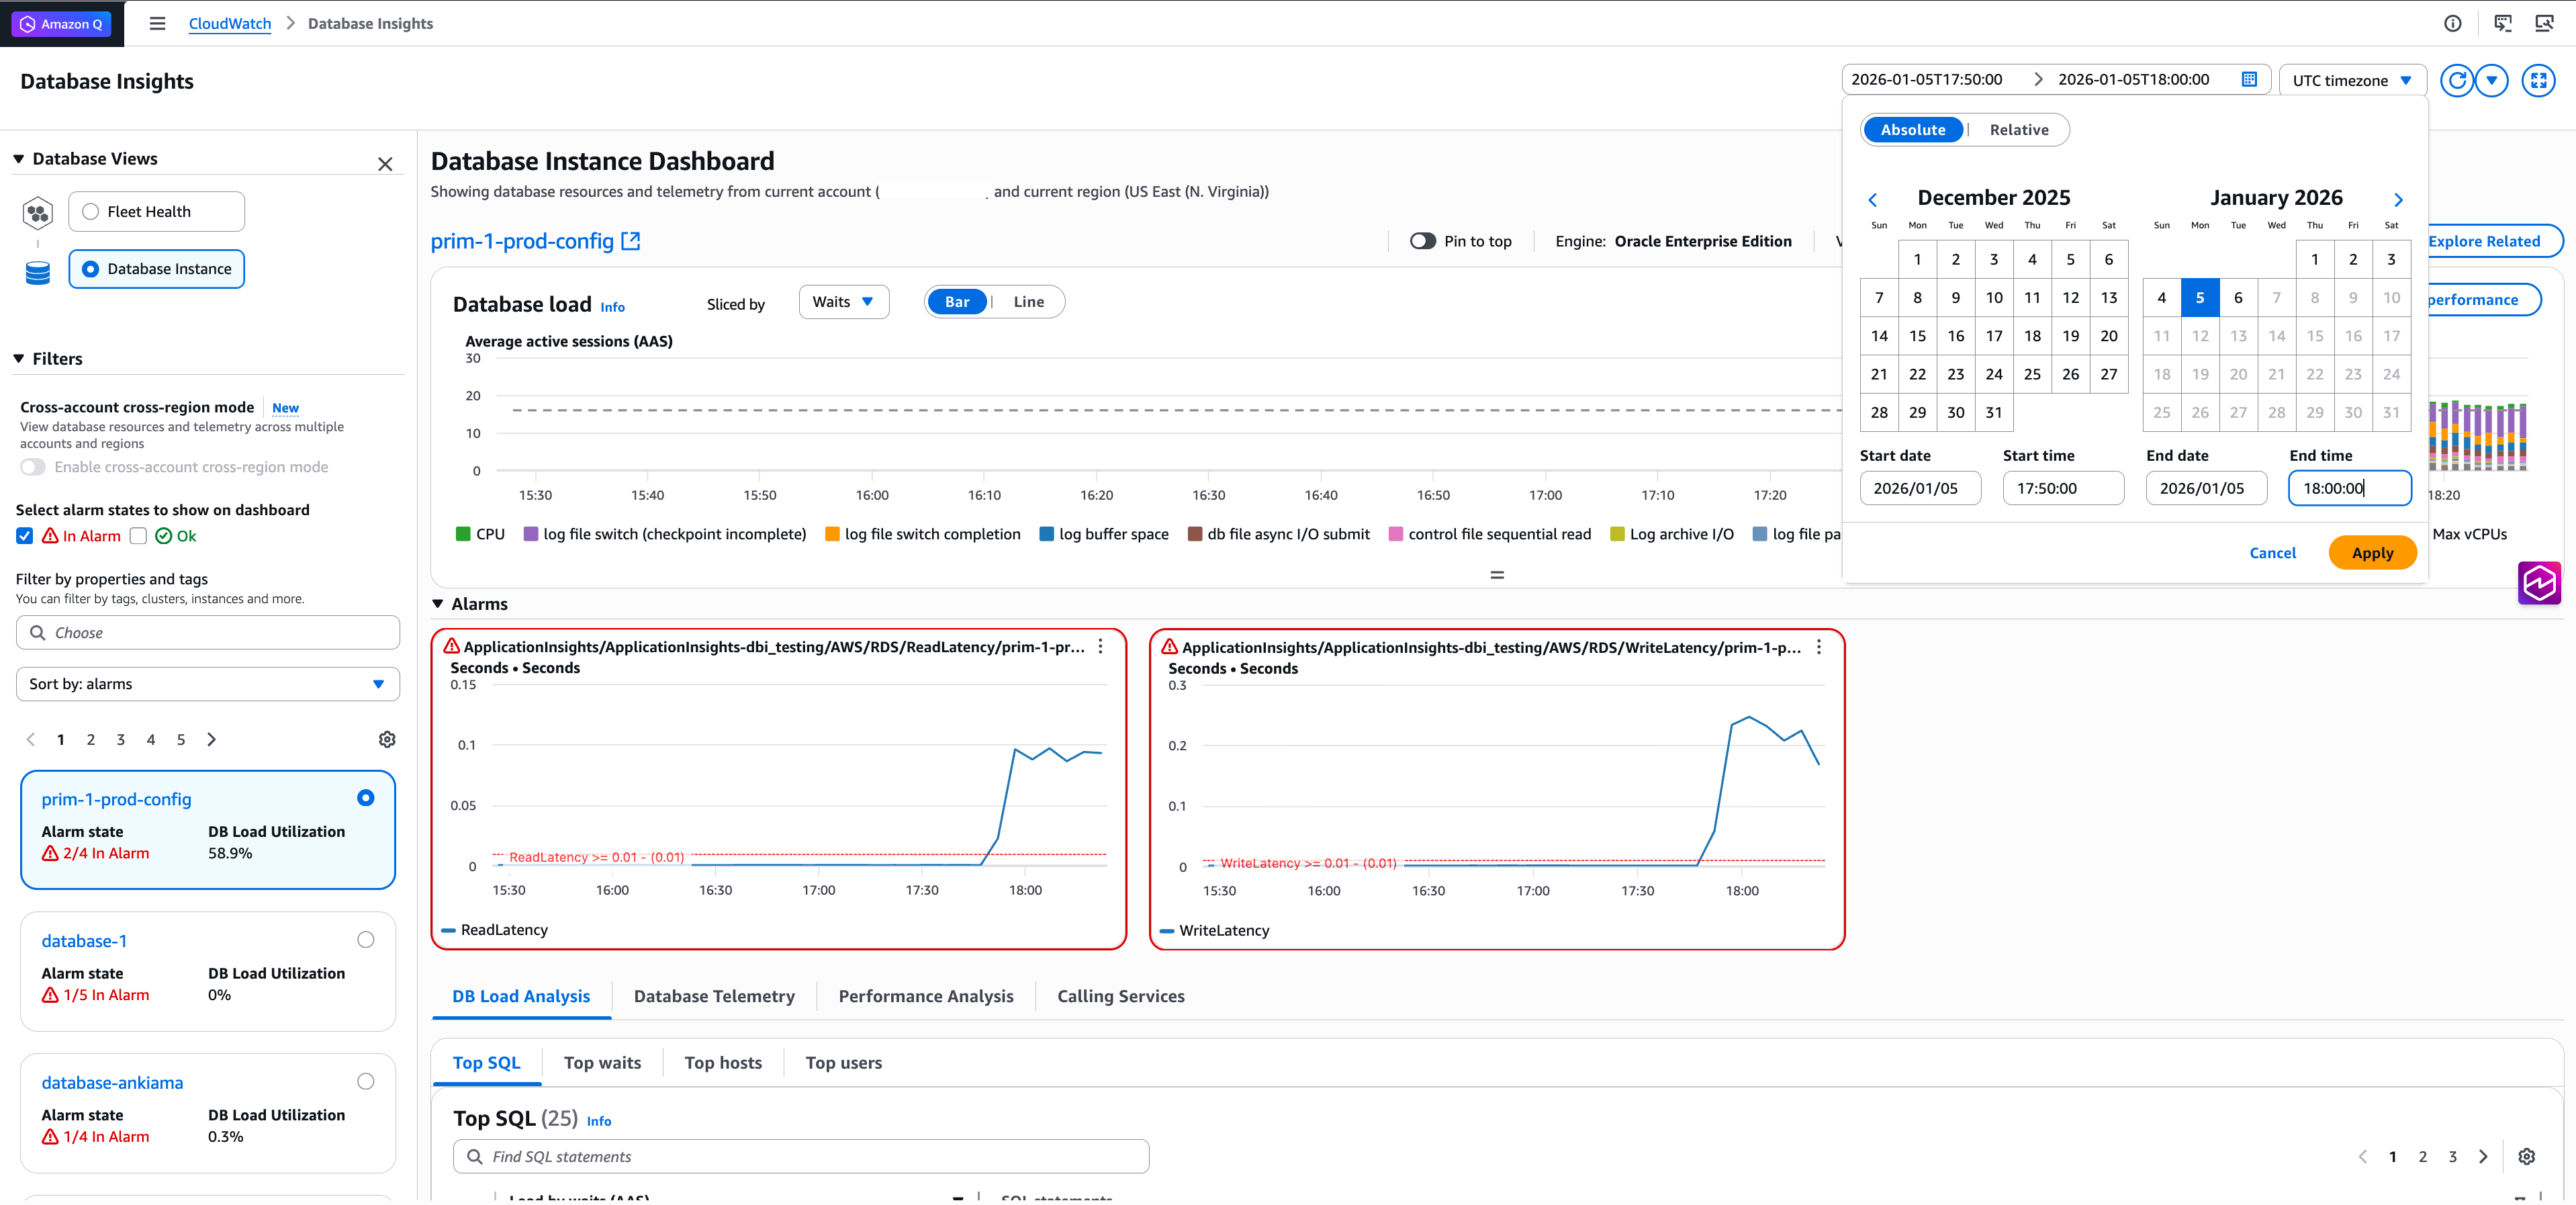
Step 3: Compare transport lag and apply lag
As discussed in the How to identify replica lag section, verify the lag metrics for ReplicaLag and ReplicaTransportLag in the monitoring section of the Read Replica in the AWS Management Console.
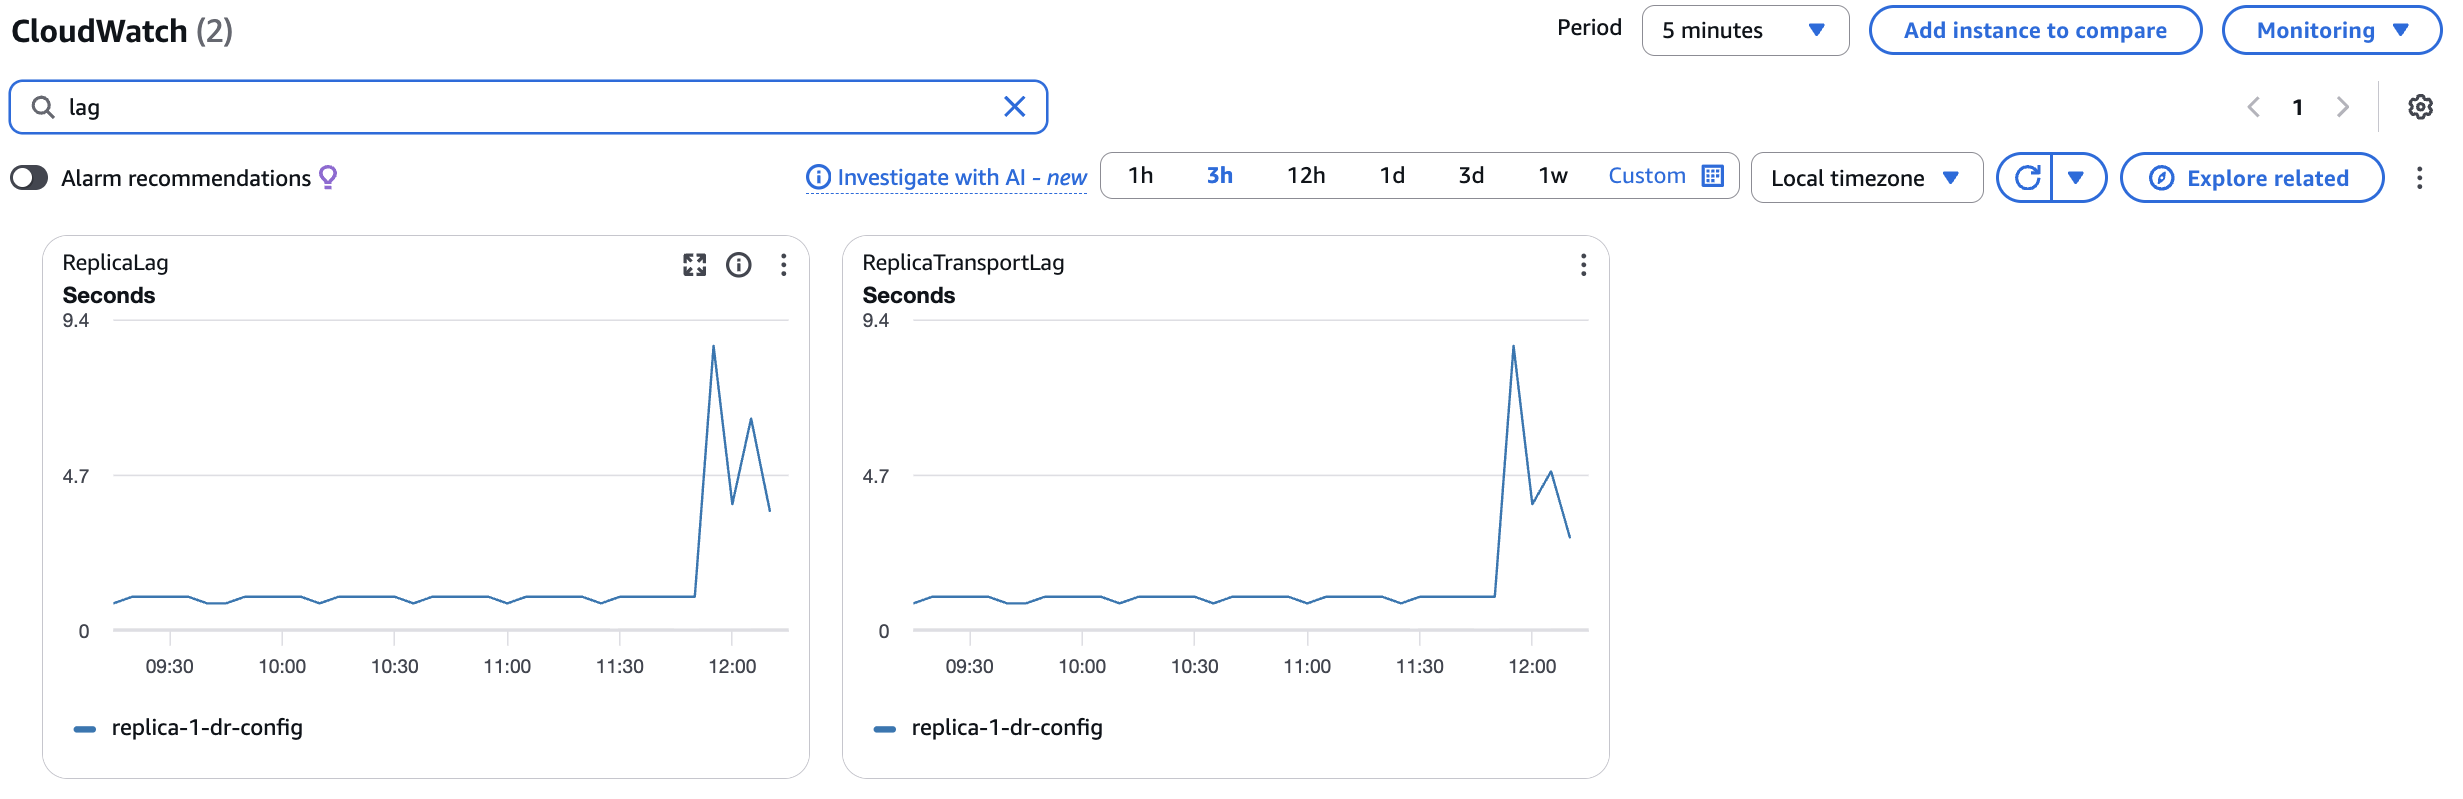
In CloudWatch metrics, compare the ReplicaTransportLag and ReplicaLag metrics to determine where the bottleneck exists.
| Scenario | Indicates |
| High TransportLag, similar ApplyLag | Shipping redo is the issue, not applying |
| Normal TransportLag, High ApplyLag | Apply process bottleneck on replica |
| Both metrics high but different | Granular analysis required |
In this scenario, Transport Lag and Apply Lag are nearly identical, indicating the bottleneck is in redo generation/shipping rather than the apply process.
Step 4: Check MRP process status on read replica
Query V$MANAGED_STANDBY on the Read Replica to check the Managed Recovery Process status:
Currently, when we see the status of MRP process, it’s showing that it’s applying the log, as next step we need to find what is the generated log sequence in the primary.
Here when we see the applied log vs the generated log in primary, we are able to see a gap of 19 log sequence. This could be result of high redo generation. We need to check the redo generated in the past hour to find what the generation looks like.
This is showing that there is redo generation of 40GB in the last hour, modify the COMPLETION_TIME filter as required for your analysis.
Note: Sometimes alert log would give important insights into why the replica lag is occurring like ORA-16055: FAL request rejected or ORA-16401: archivelog rejected by RFS. Under such circumstances, review the related my Oracle support note to take next steps.
Step 5: Analyze primary instance metrics
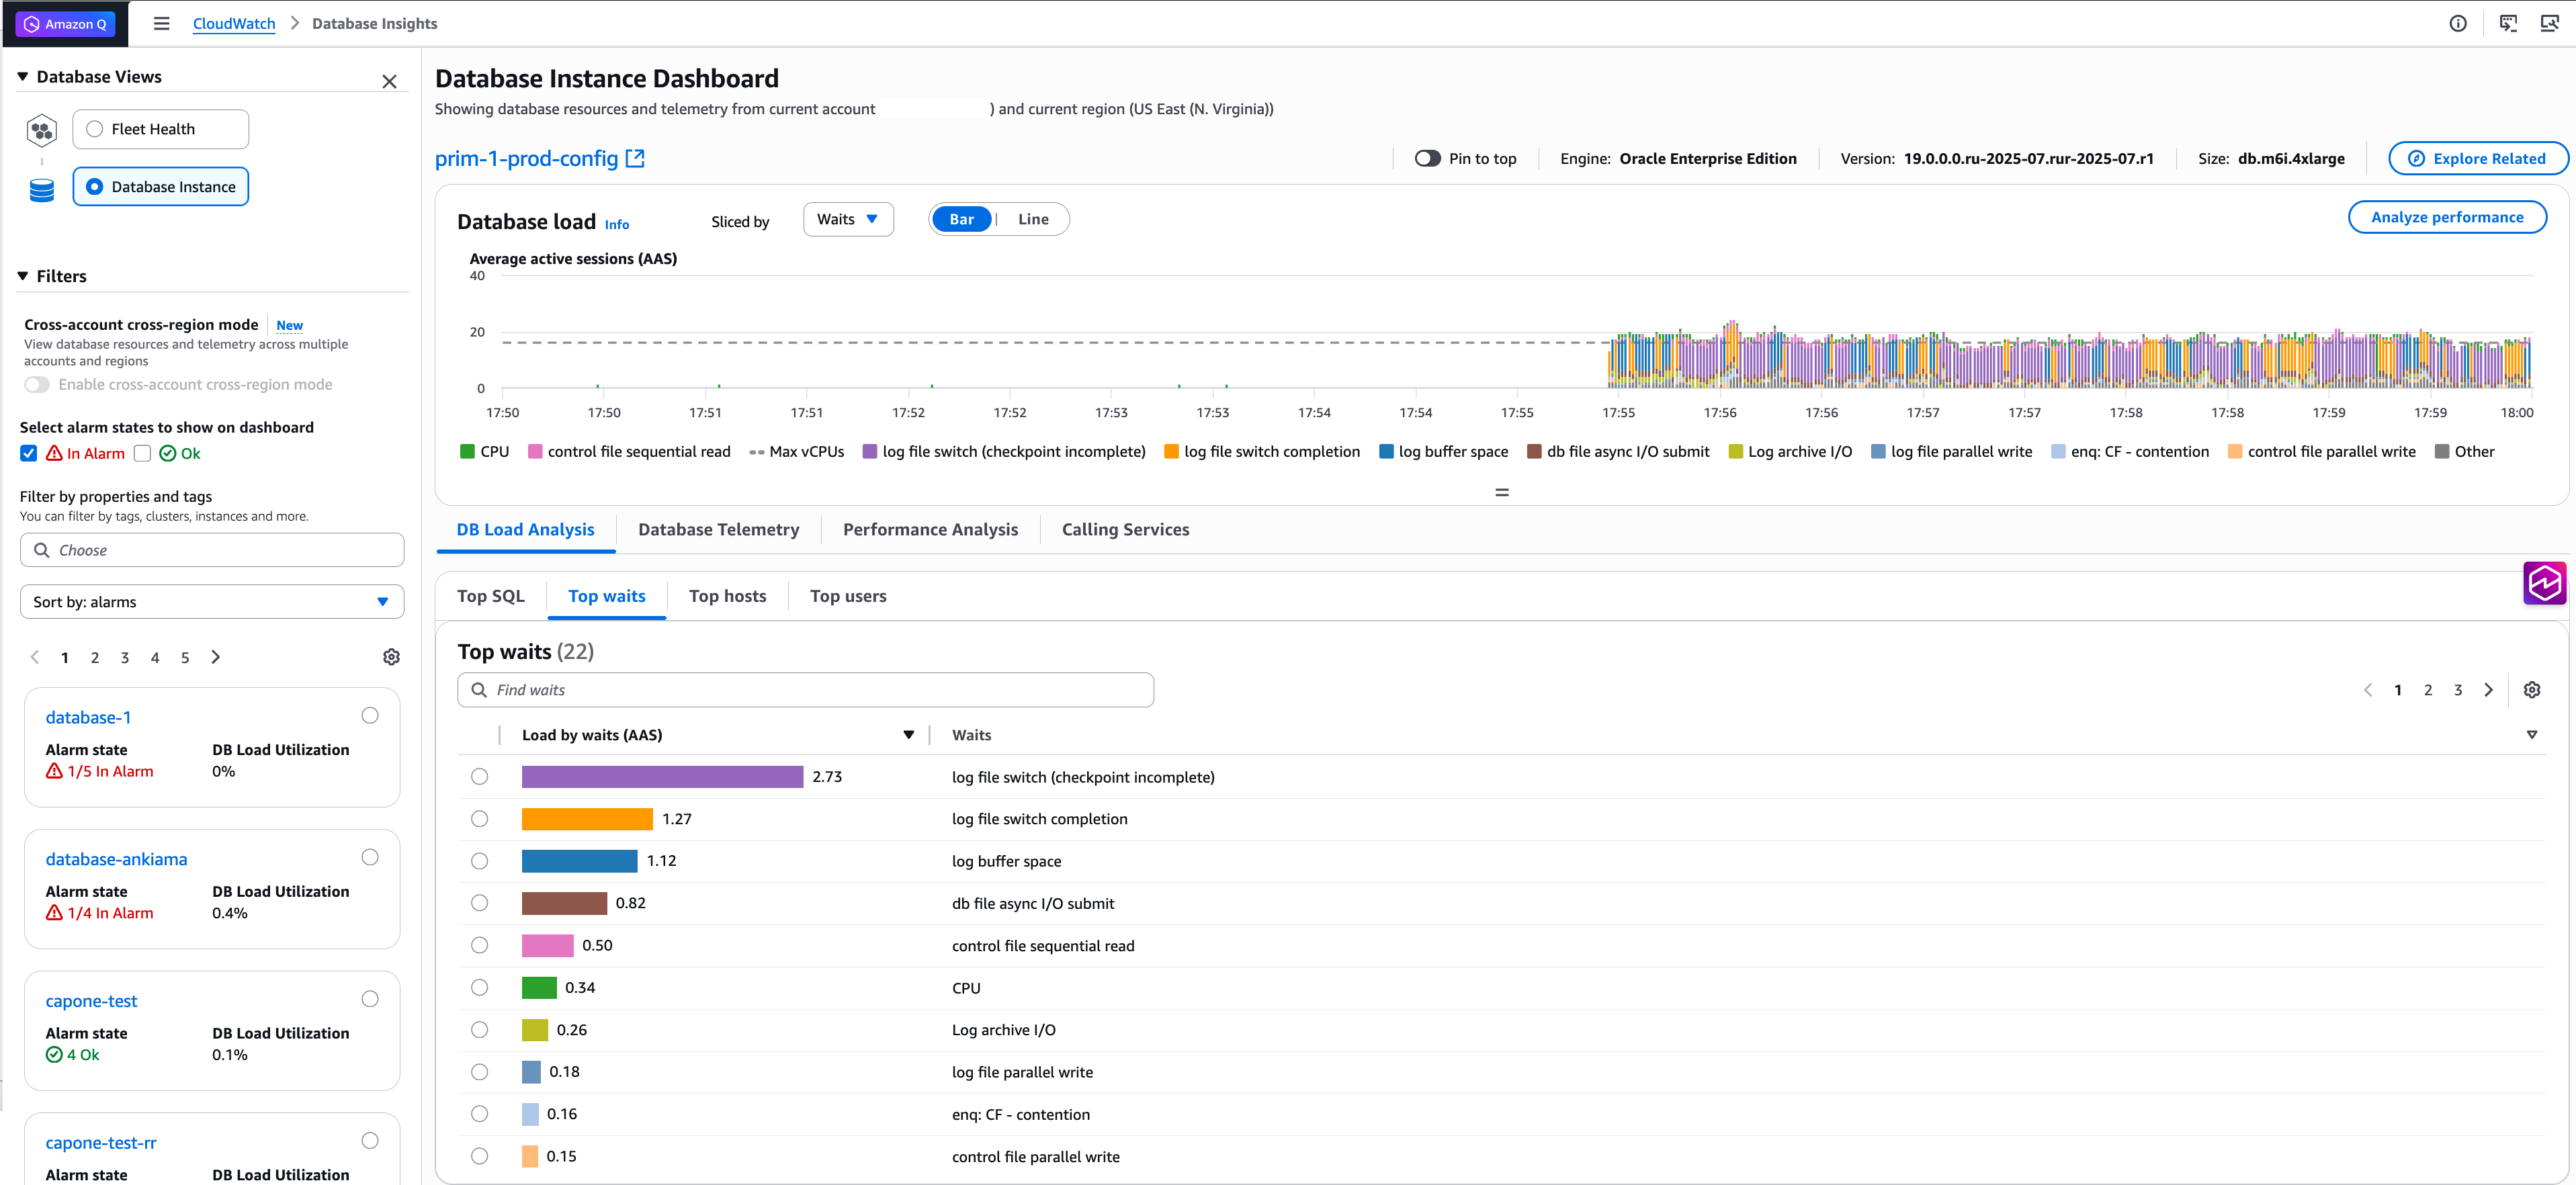
In this scenario for January 5th, 17:50–18:00 UTC, DBI alarms automatically captured:
Read and write latency above 10 milliseconds.
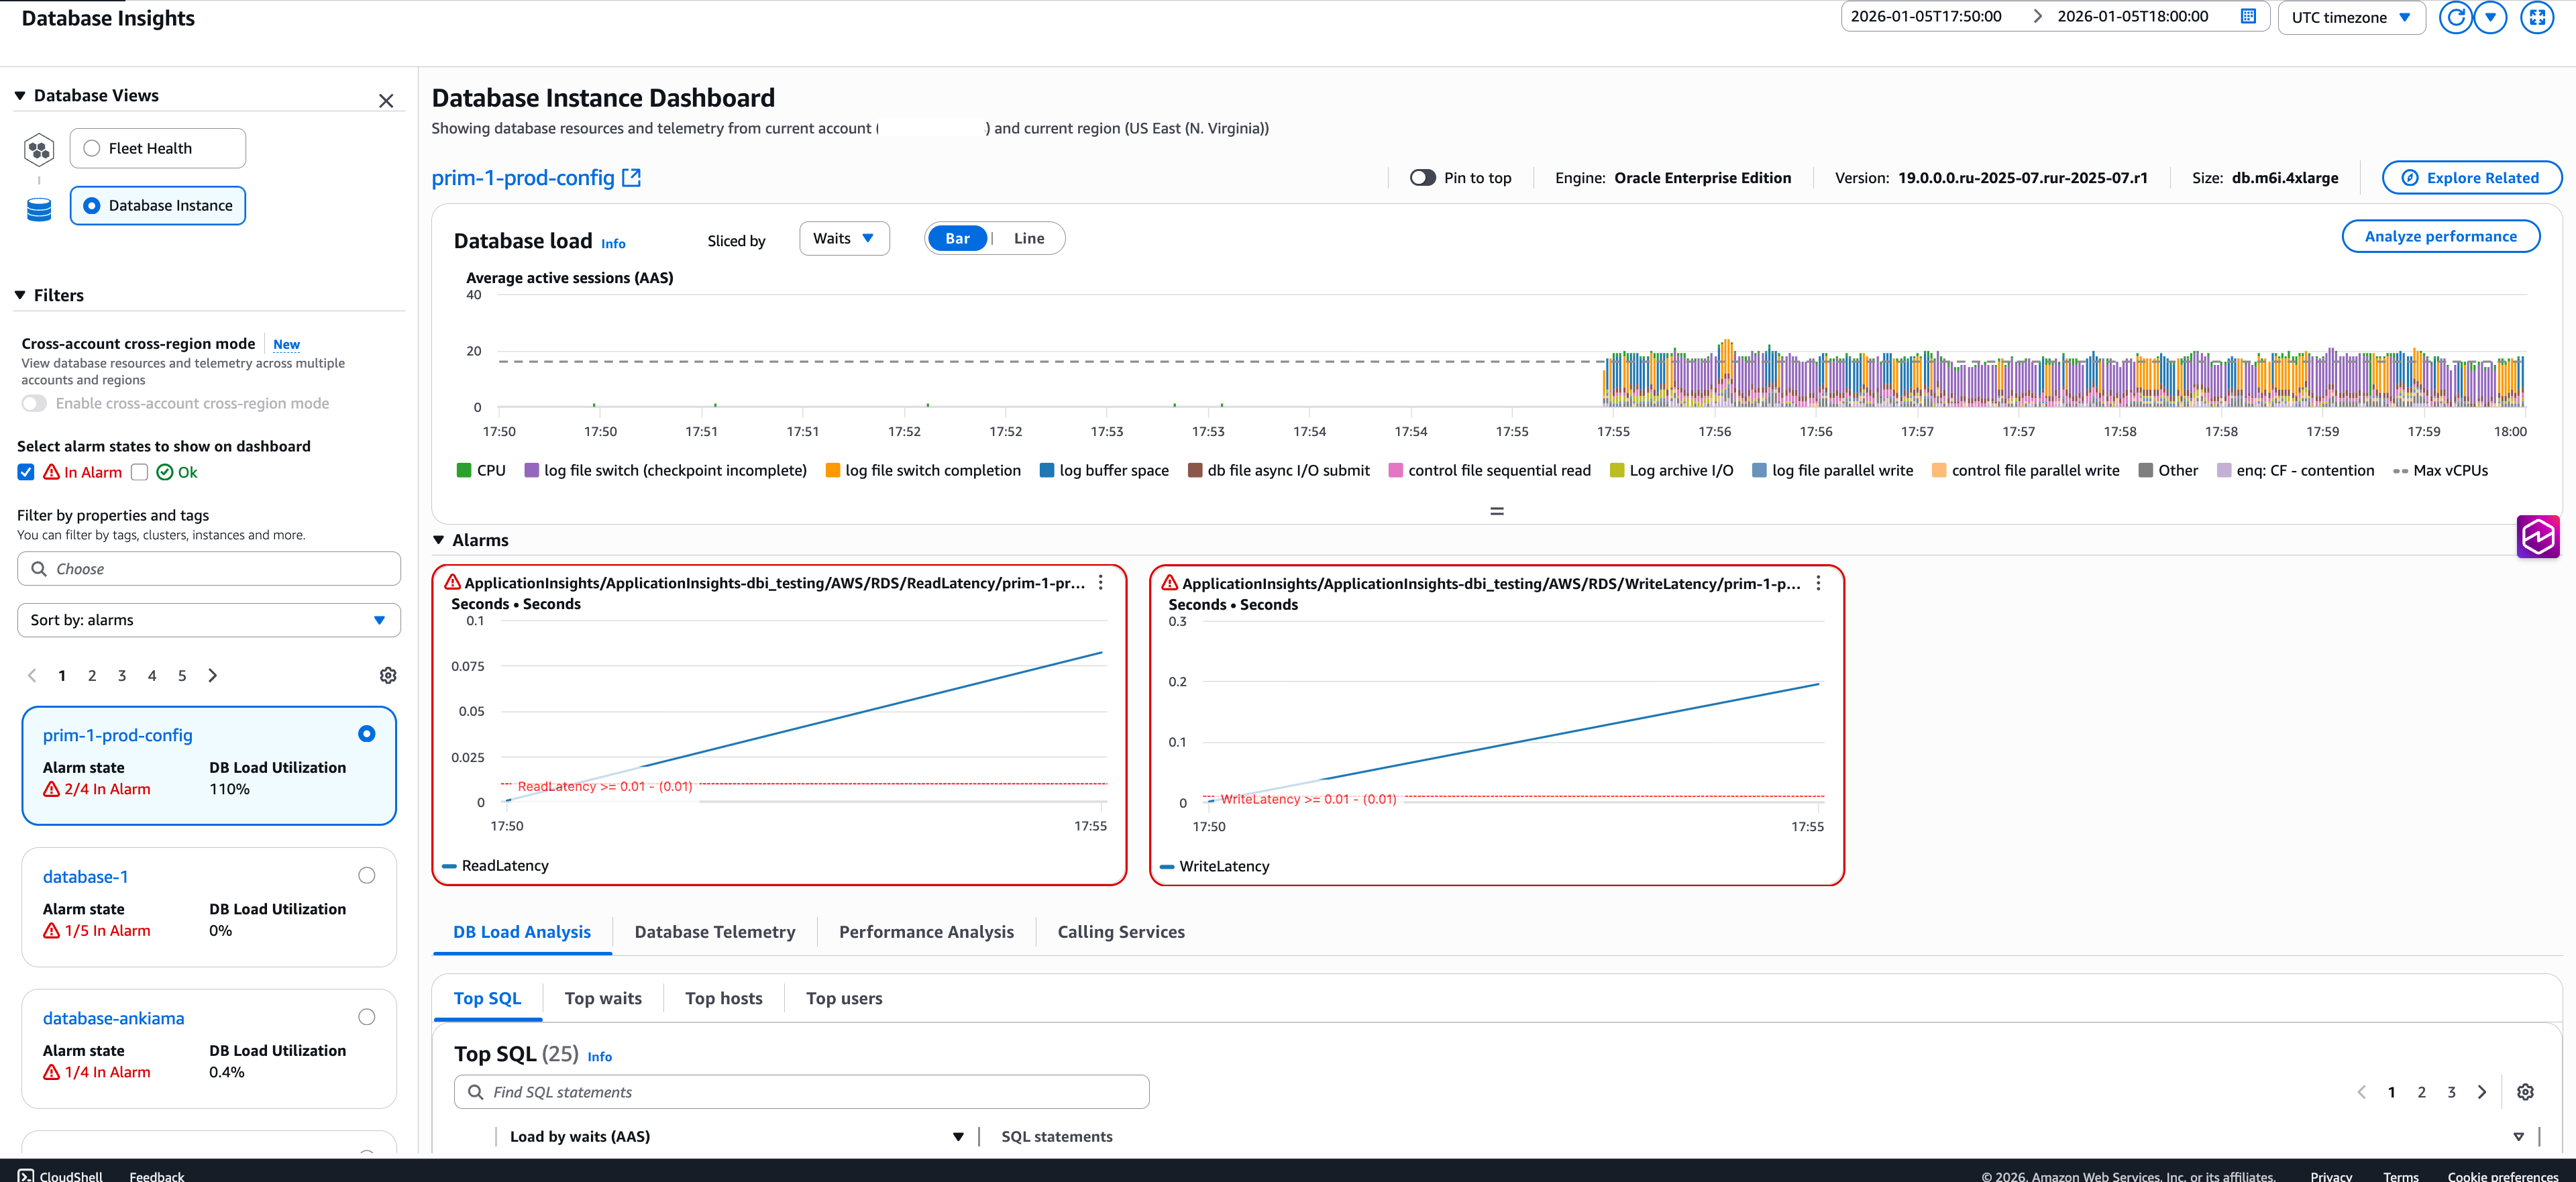
DB Load Analysis shows an UPDATE statement consuming the most CPU (5 vCPUs).
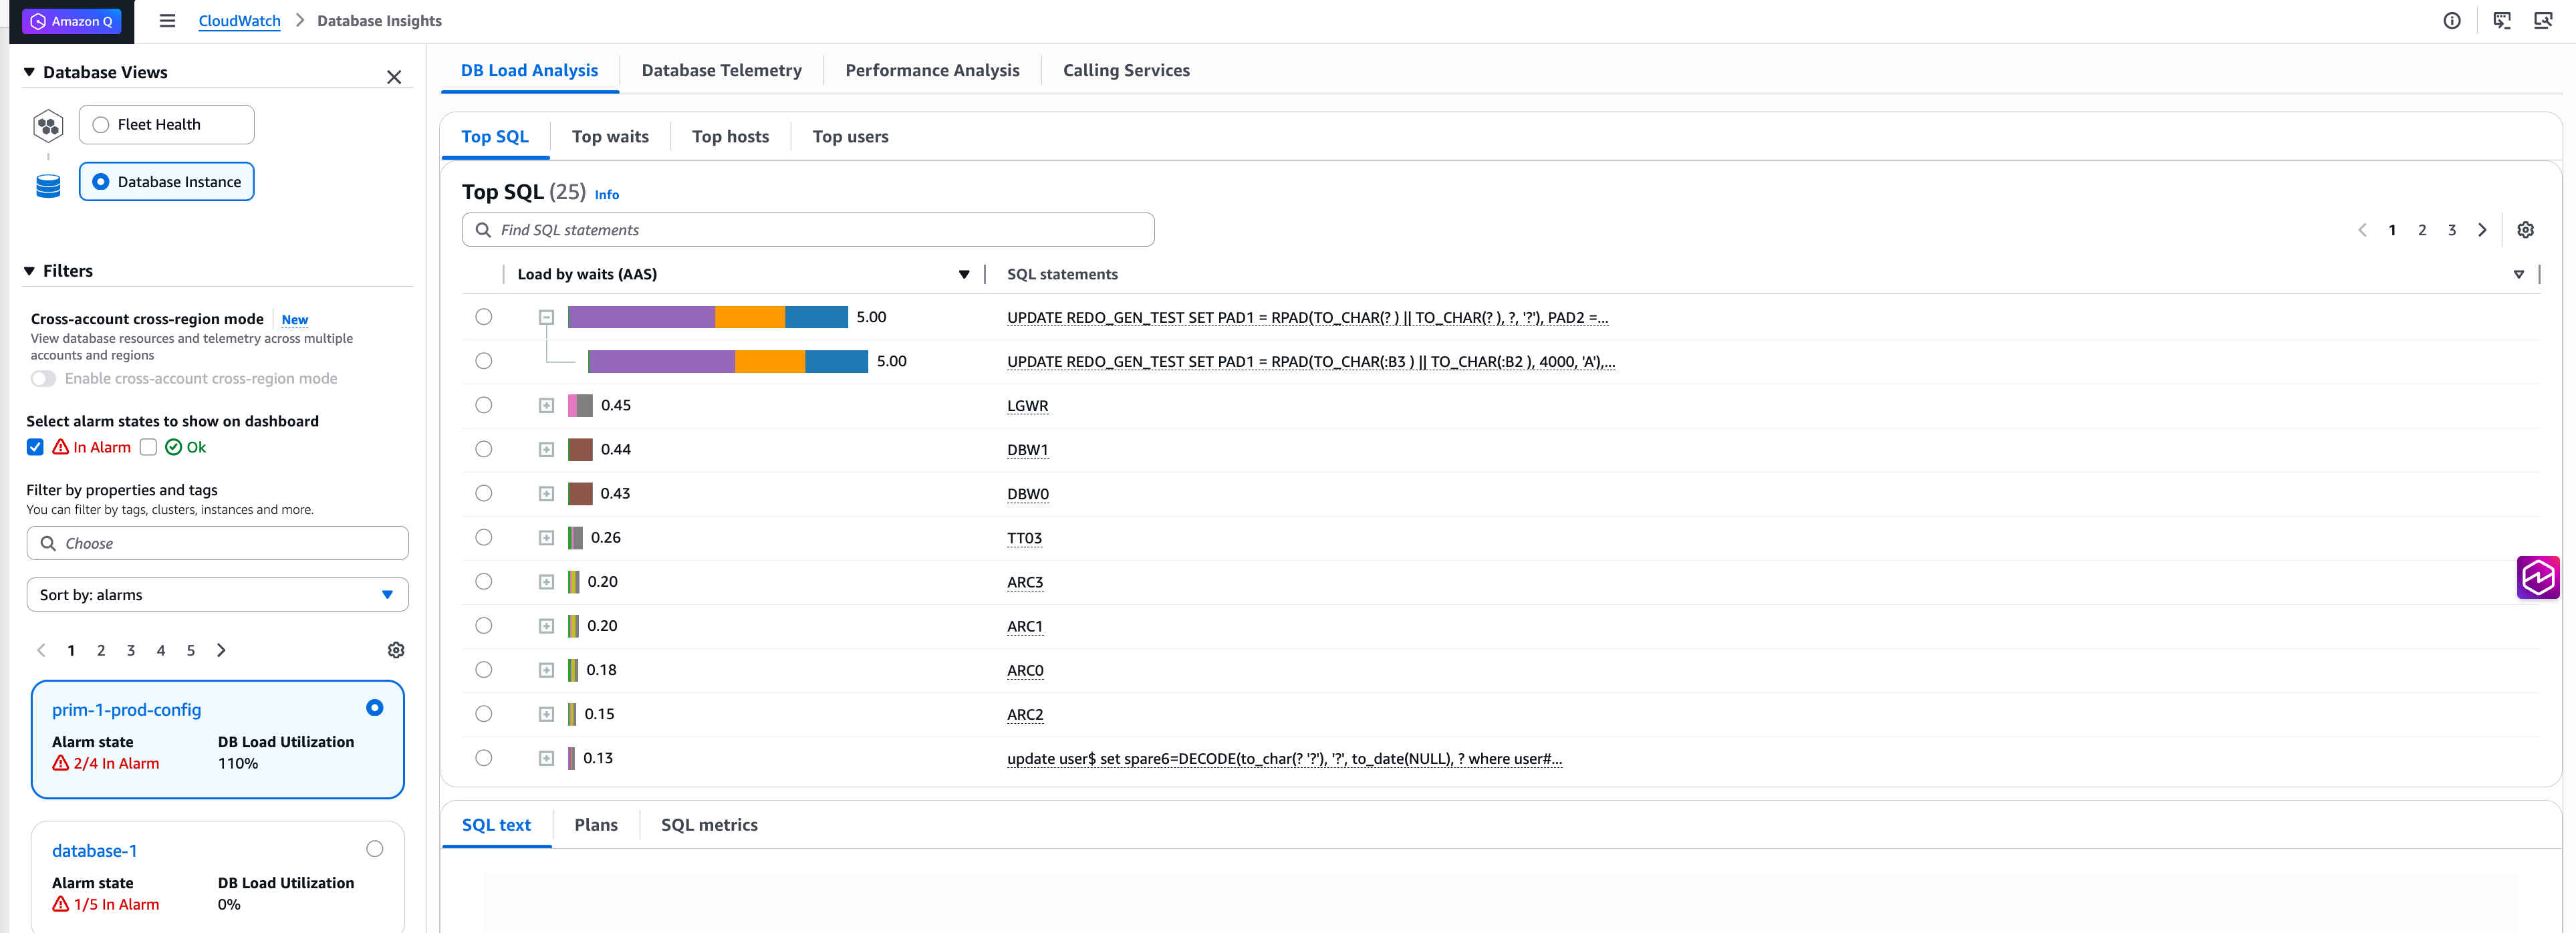
Top Waits section reveals log file switch (checkpoint incomplete) and log file switch completion as top 2 wait events in database during the time of start of replica lag.
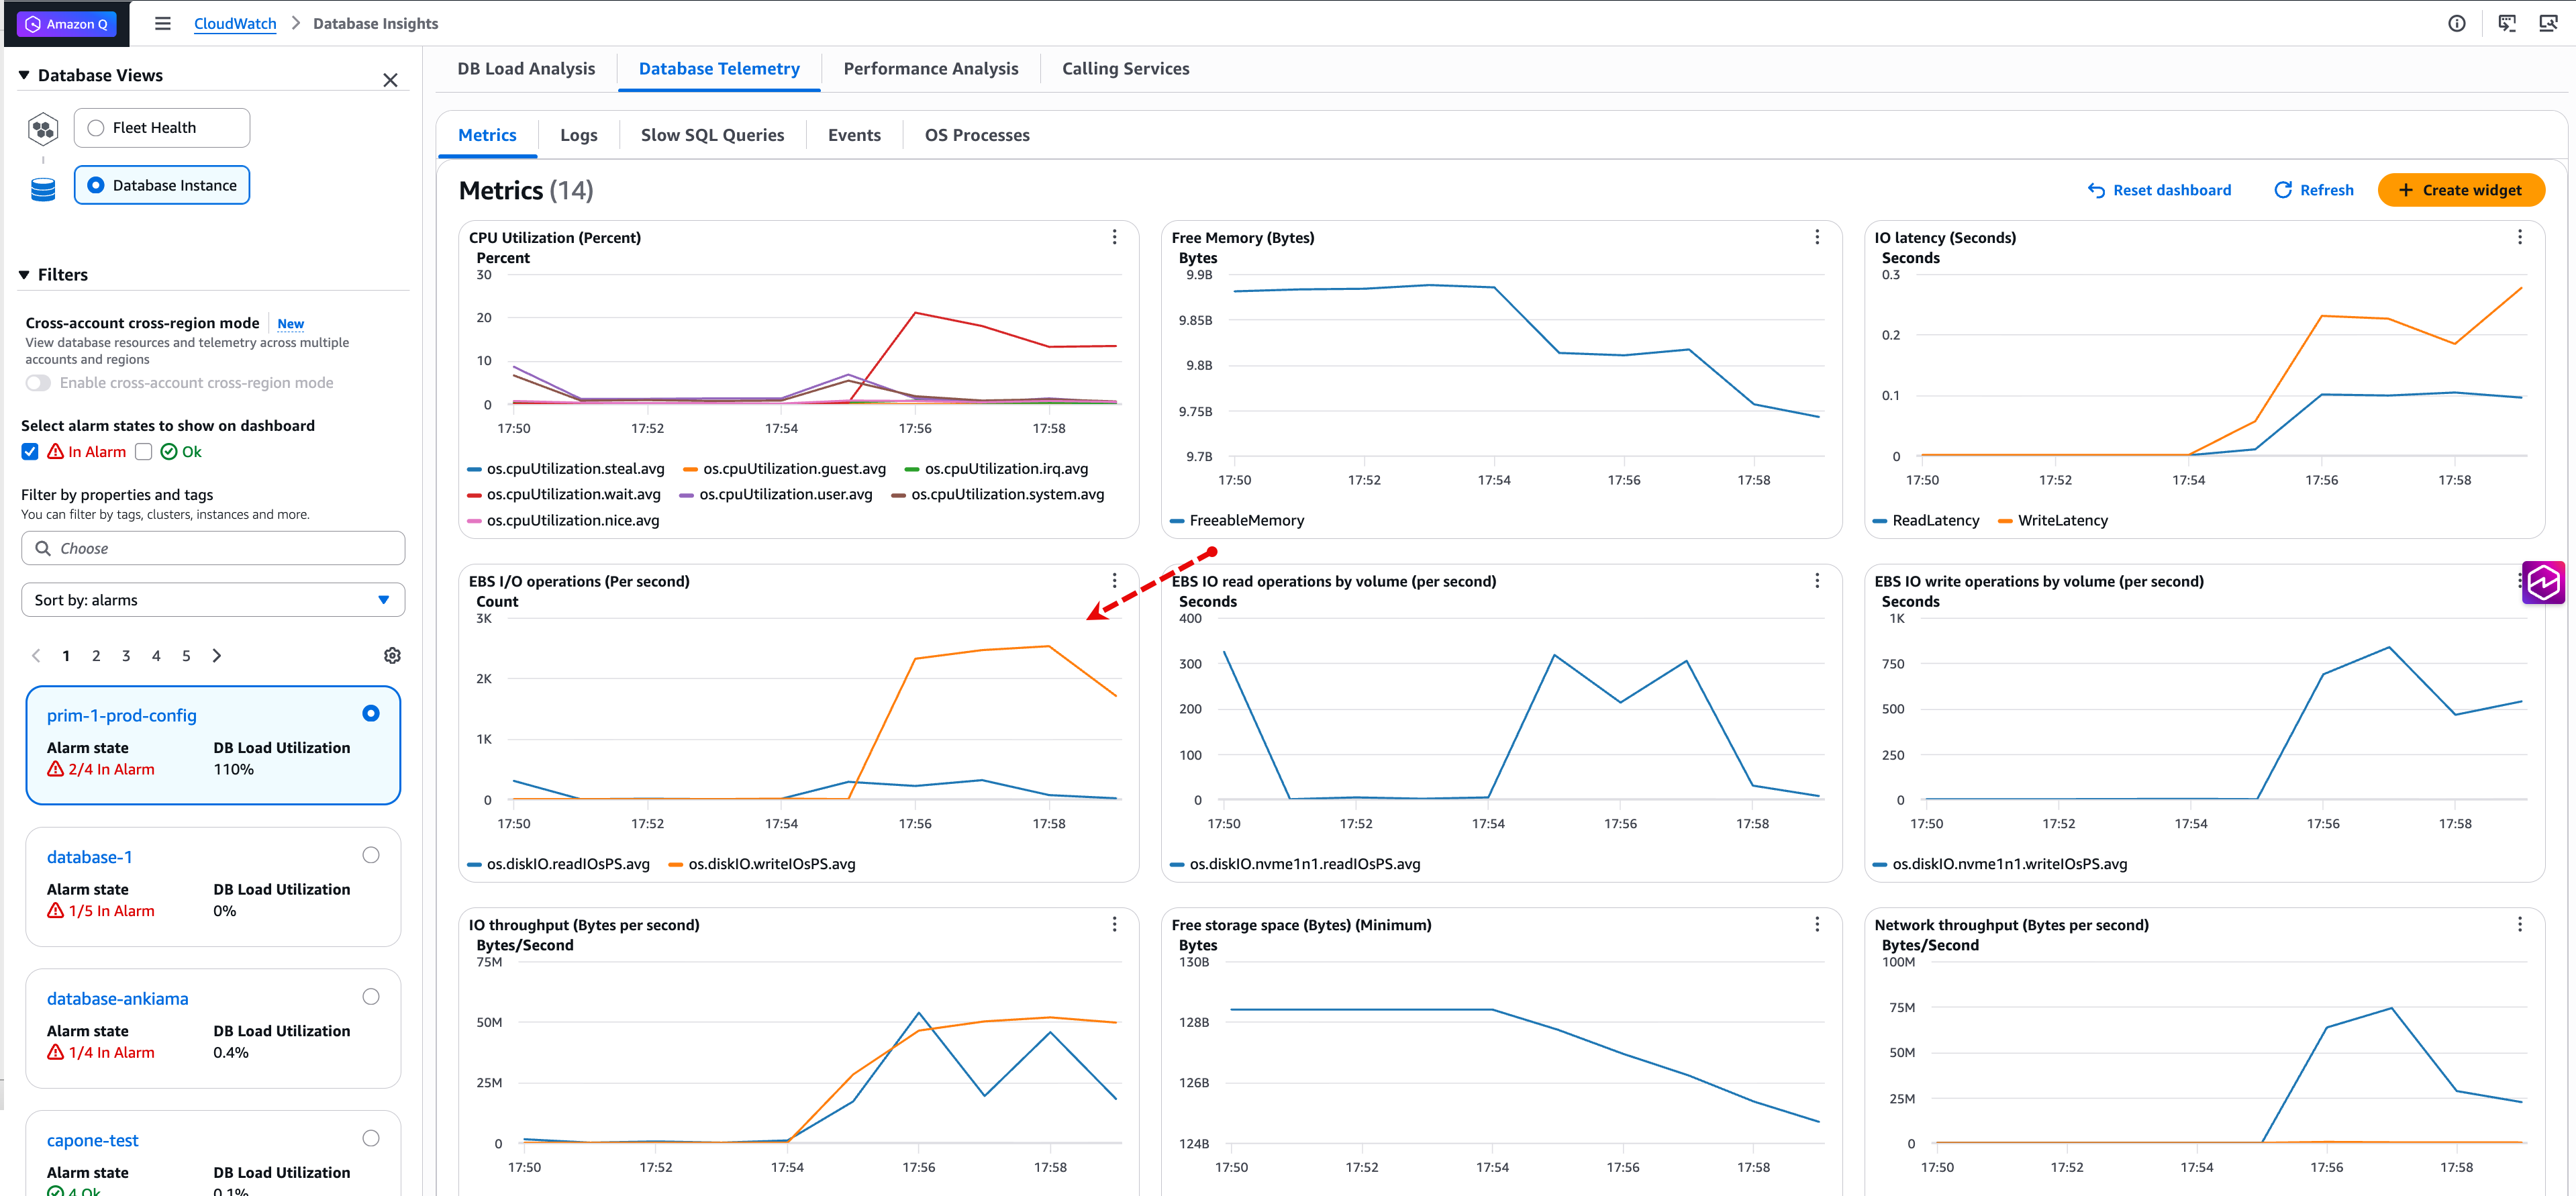
Database Telemetry Metrics shows a significant spike in I/O operations around 17:55 UTC.
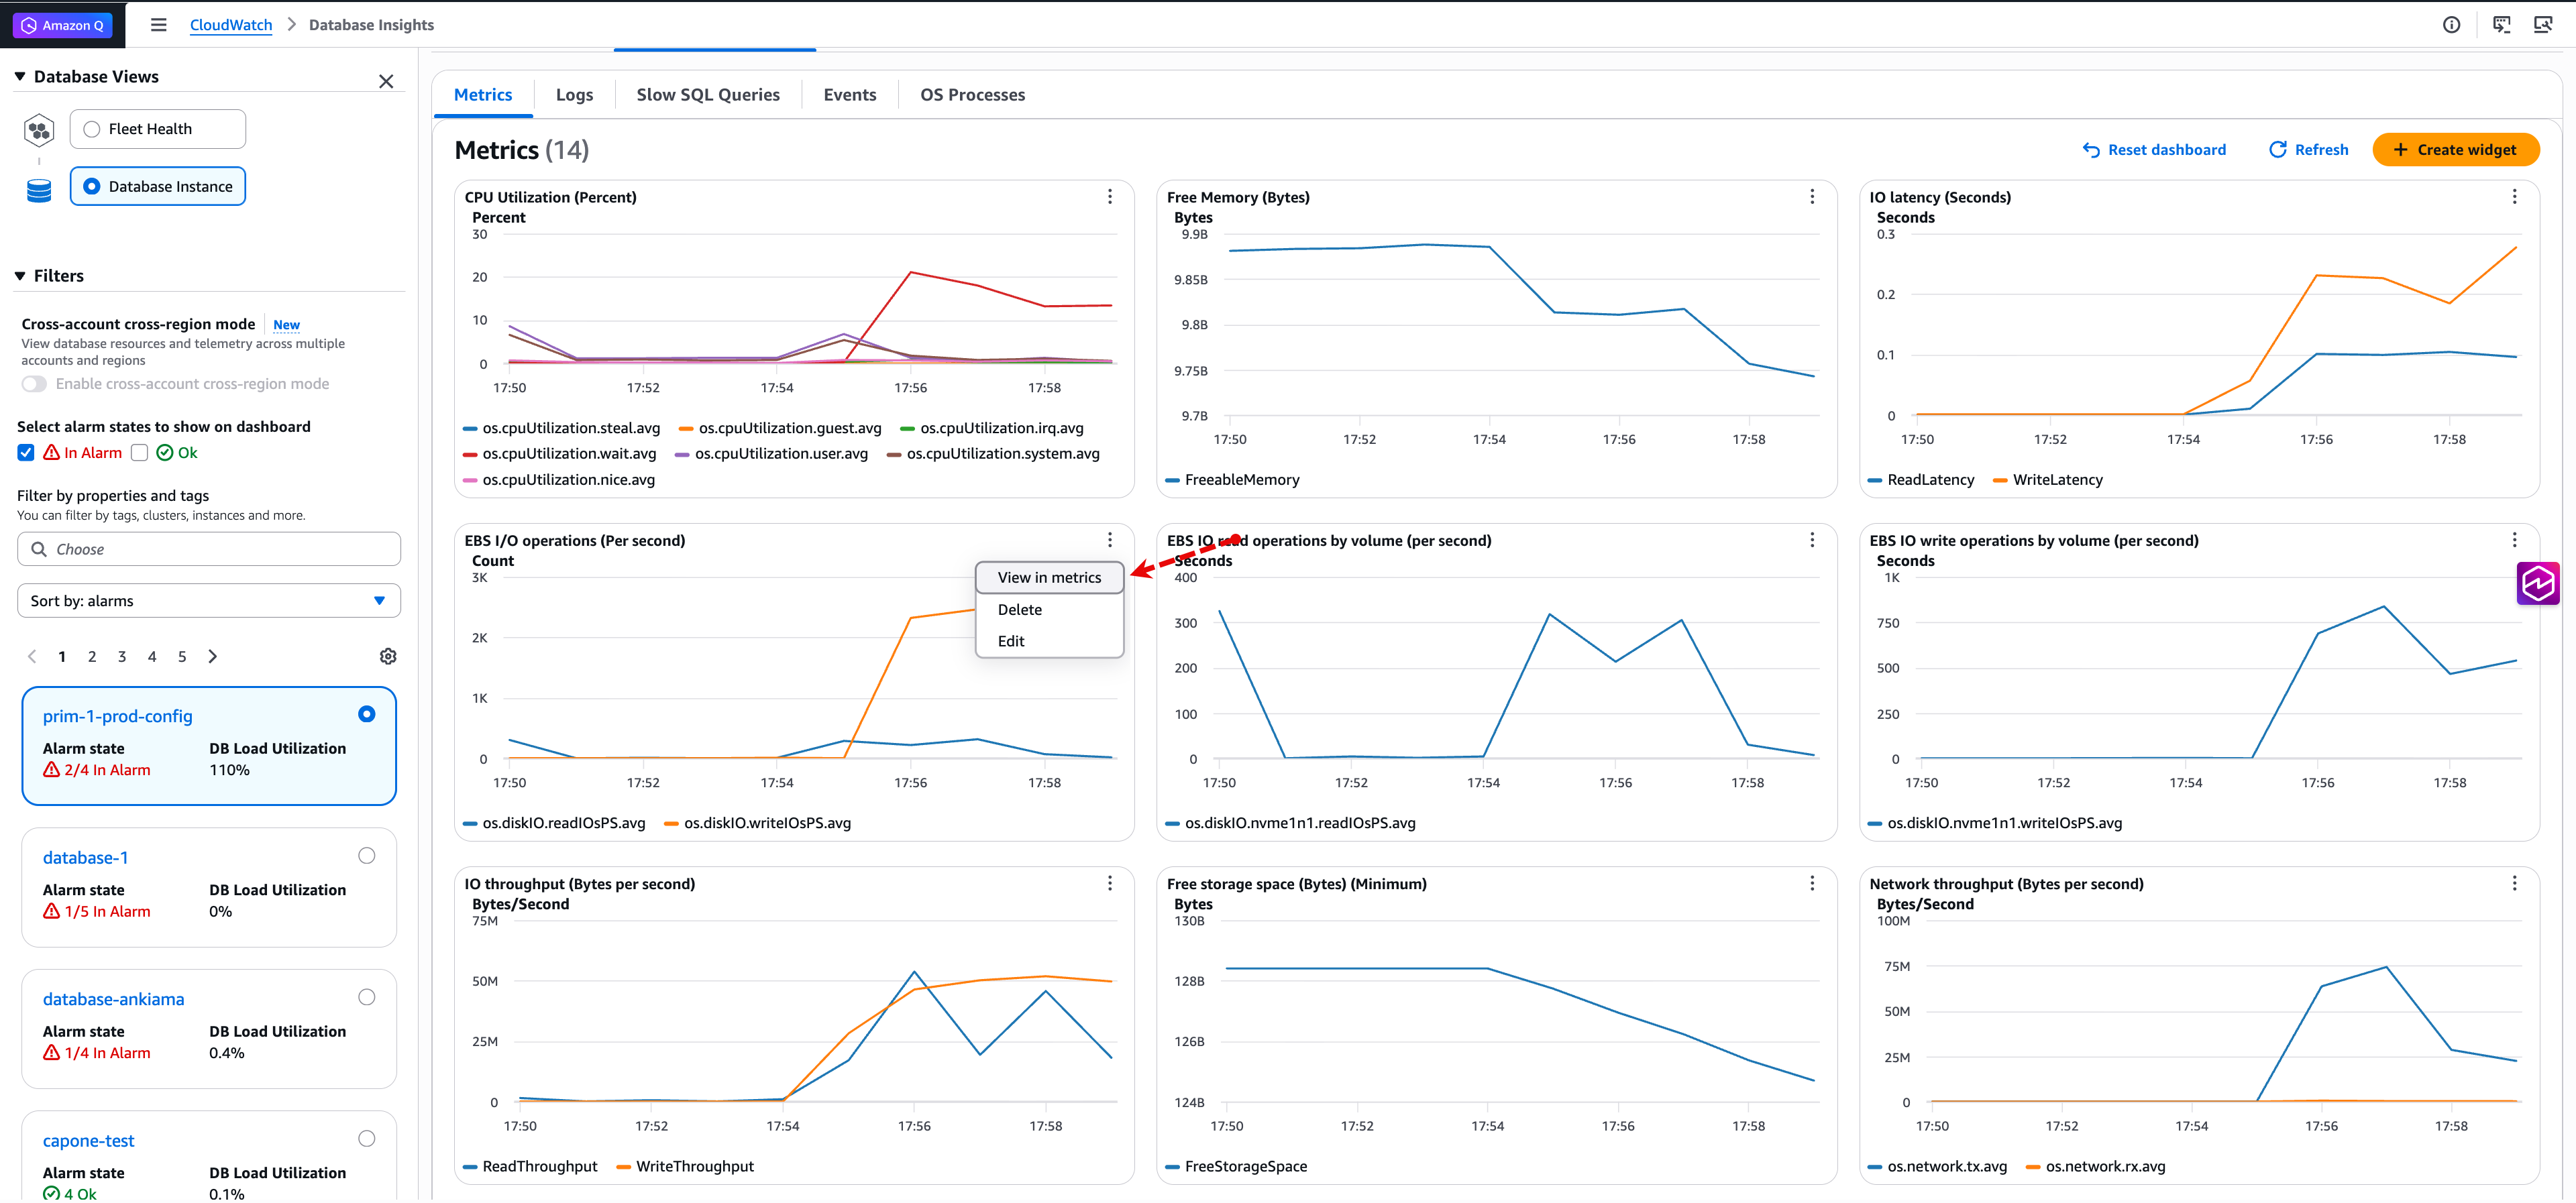
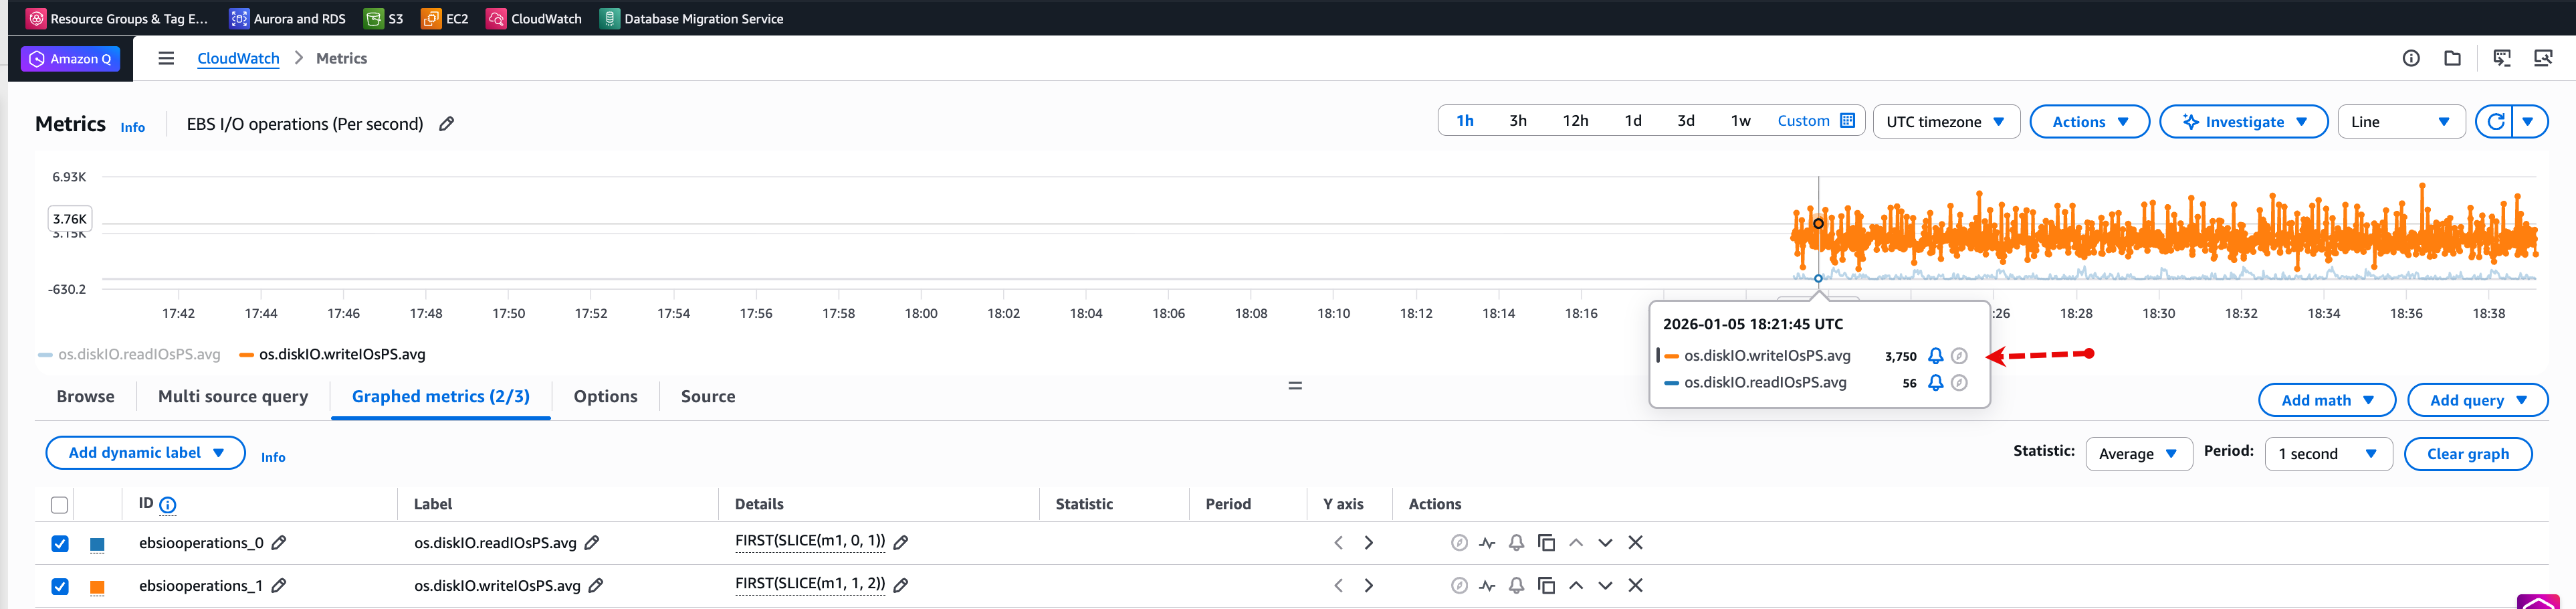
CloudWatch metrics confirm read + write IOPS is exceeding the allocated 3,000 IOPS for the Amazon RDS Primary database.
Step 6: Analyze read replica in database insights
Review the Read Replica in DBI for January 5th, 17:50–18:00 UTC.
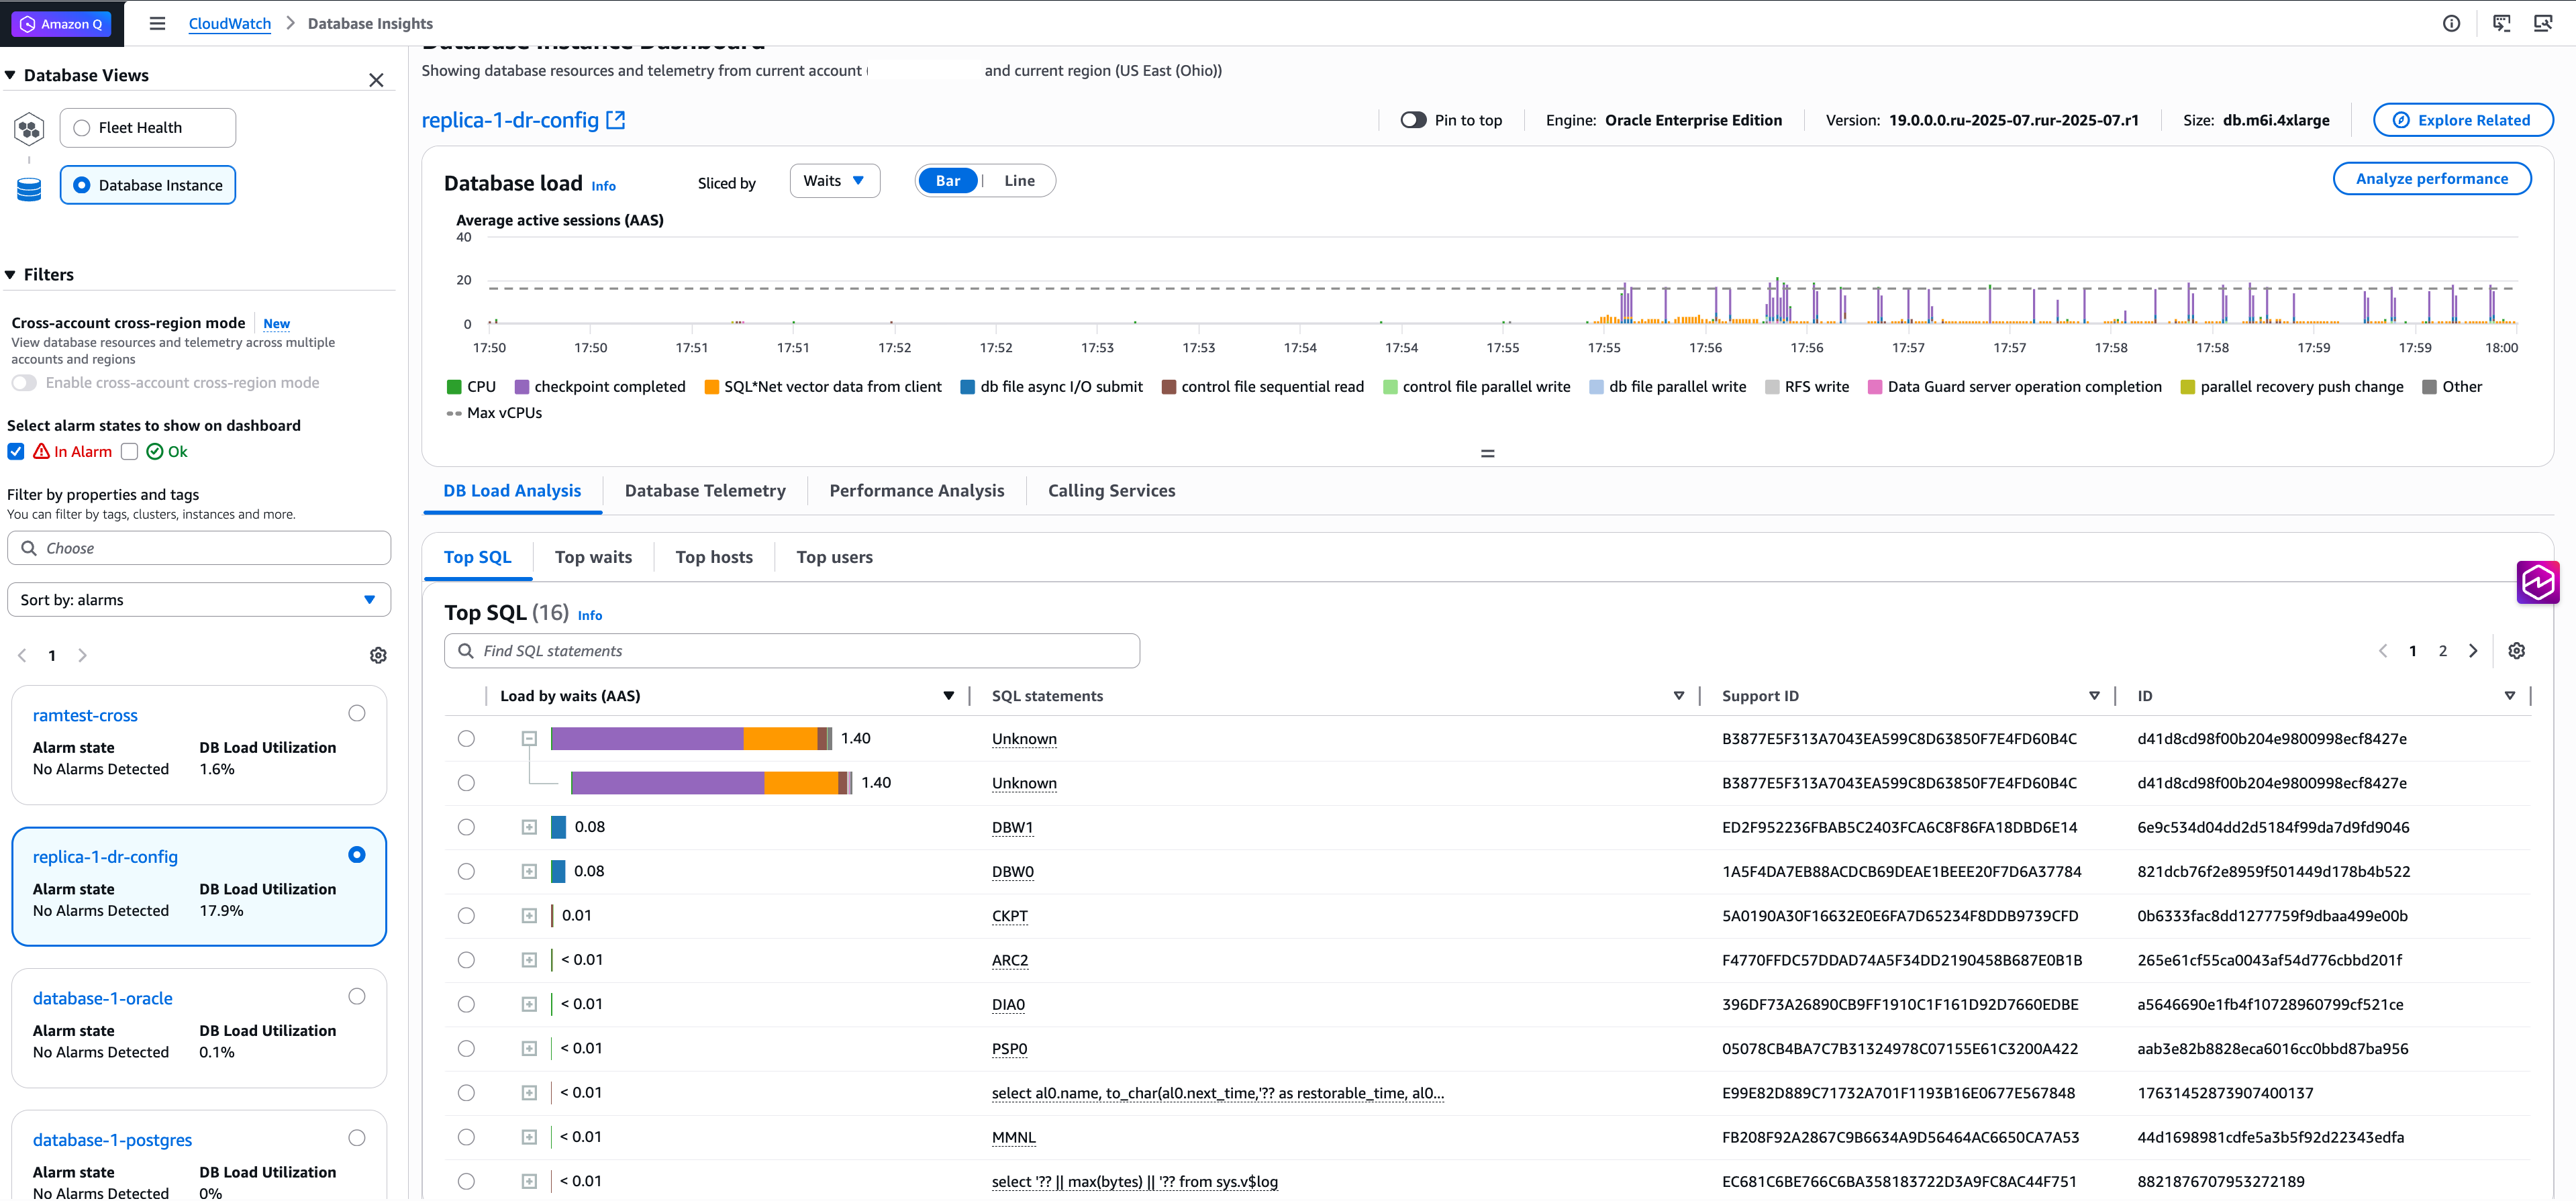
The top SQL shows as unknown. This usually occurs when the Process consuming resource doesn’t have a SQL_ID. In such situation we can find the Process ID (PID) of the OS process consuming resource and find what that process is performing.
Step 7: Identify top CPU-consuming process
To identify the consuming process:
Navigate to Database Telemetry → OS Processes.
Sort by CPU %.
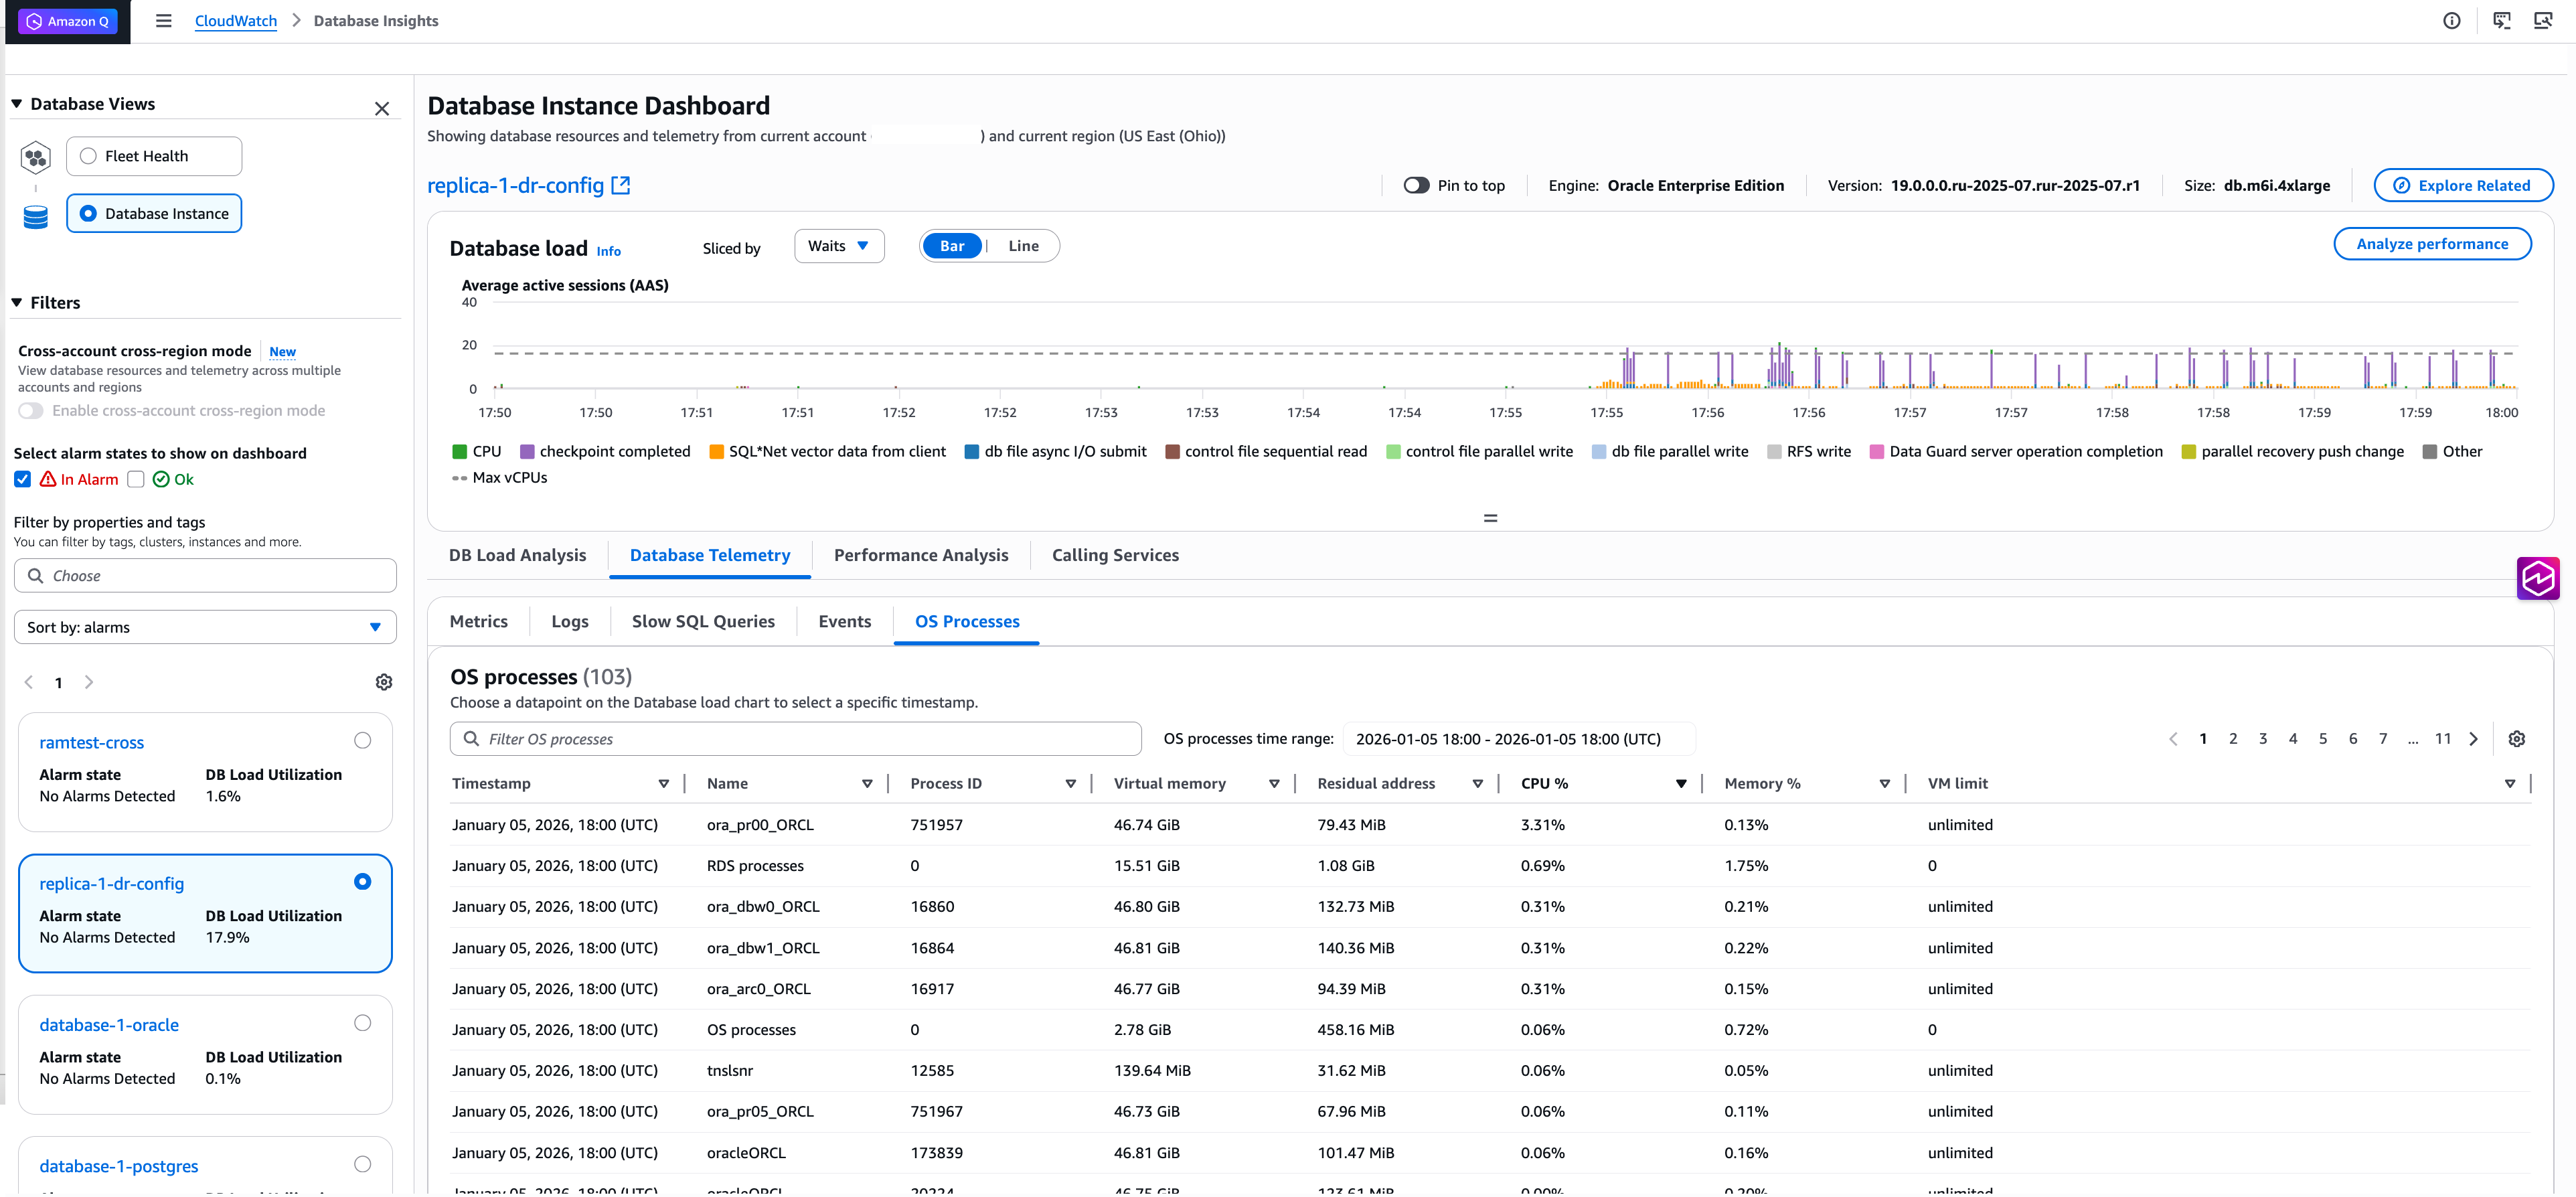
In this scenario, the top CPU-consuming process is ora_pr00_ORCL with Process ID 751957, consuming 3.31% CPU. The process name indicates it’s a Parallel Recovery (PR) worker process responsible for applying redo log changes in parallel on the target.
Step 8: Recommended actions to fix or mitigate the issue
- Increase EBS IOPS to handle the storage load.
- Increase redo log size to reduce log switch frequency.
- Add redo log groups if needed for burst handling.
- Coordinate with application and business teams to review load patterns before implementing changes.
Scenario: Apply-side bottleneck on the Read Replica
The following scenario demonstrates how to identify replica lag caused by a bottleneck on the Read Replica’s apply path rather than on the primary or network. In this example, a heavy UPDATE workload is running on the primary, which drives the apply I/O demand on the Read Replica.
Step 1: Compare ReplicaLag and ReplicaTransportLag
Navigate to the Read Replica Instance Monitoring tab and view ReplicaLag alongside ReplicaTransportLag for the same time window.
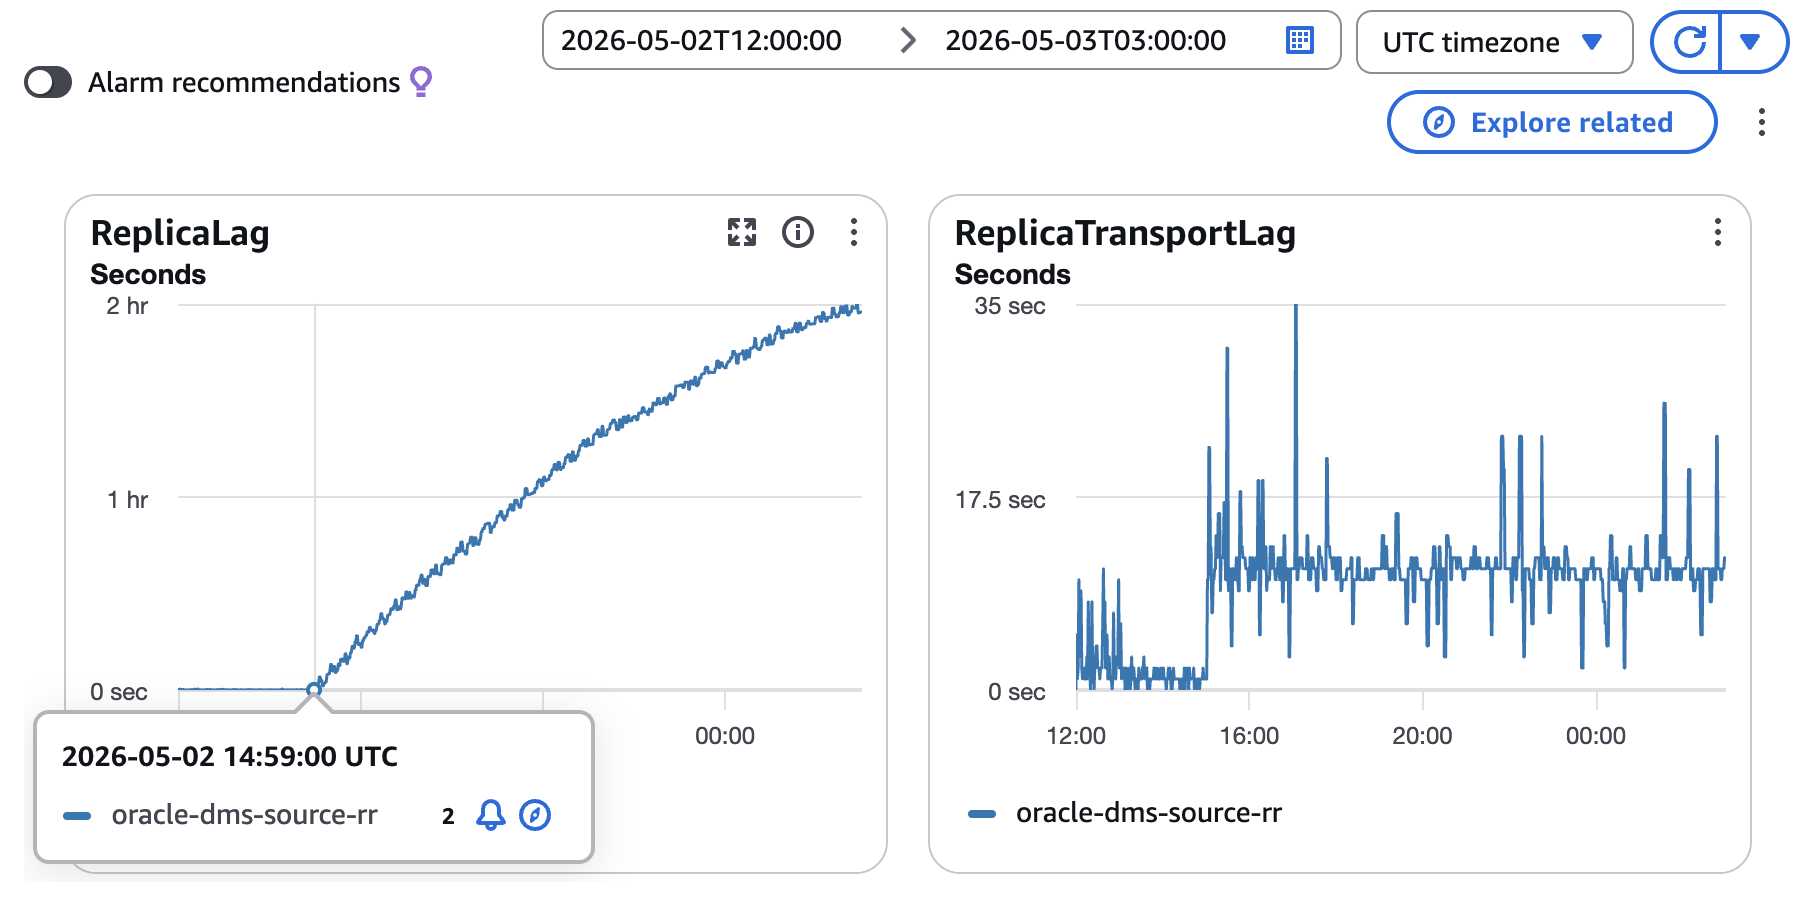
In this example, ReplicaLag starts increasing at 2026-05-02 15:00 UTC and grows to about 2 hours, while ReplicaTransportLag stays under 35 seconds throughout. Per the comparison table in the previous scenario, this pattern (normal TransportLag, high ApplyLag) points to an apply process bottleneck on the Read Replica.
Step 2: Confirm the lag pattern at the database level
Query V$DATAGUARD_STATS on the Read Replica to corroborate the CloudWatch view:
Transport lag is zero while apply lag is over 2 hours, confirming the bottleneck is on the apply side.
Compare the primary’s current log sequence with the sequence MRP is applying on the Read Replica:
MRP is 25 log sequences behind the primary, which matches the 2-hour apply lag reported by V$DATAGUARD_STATS.
Step 3: Analyze wait events on the Read Replica in Database Insights
Open the Read Replica in Database Insights and review Database load sliced by Waits for the same window.
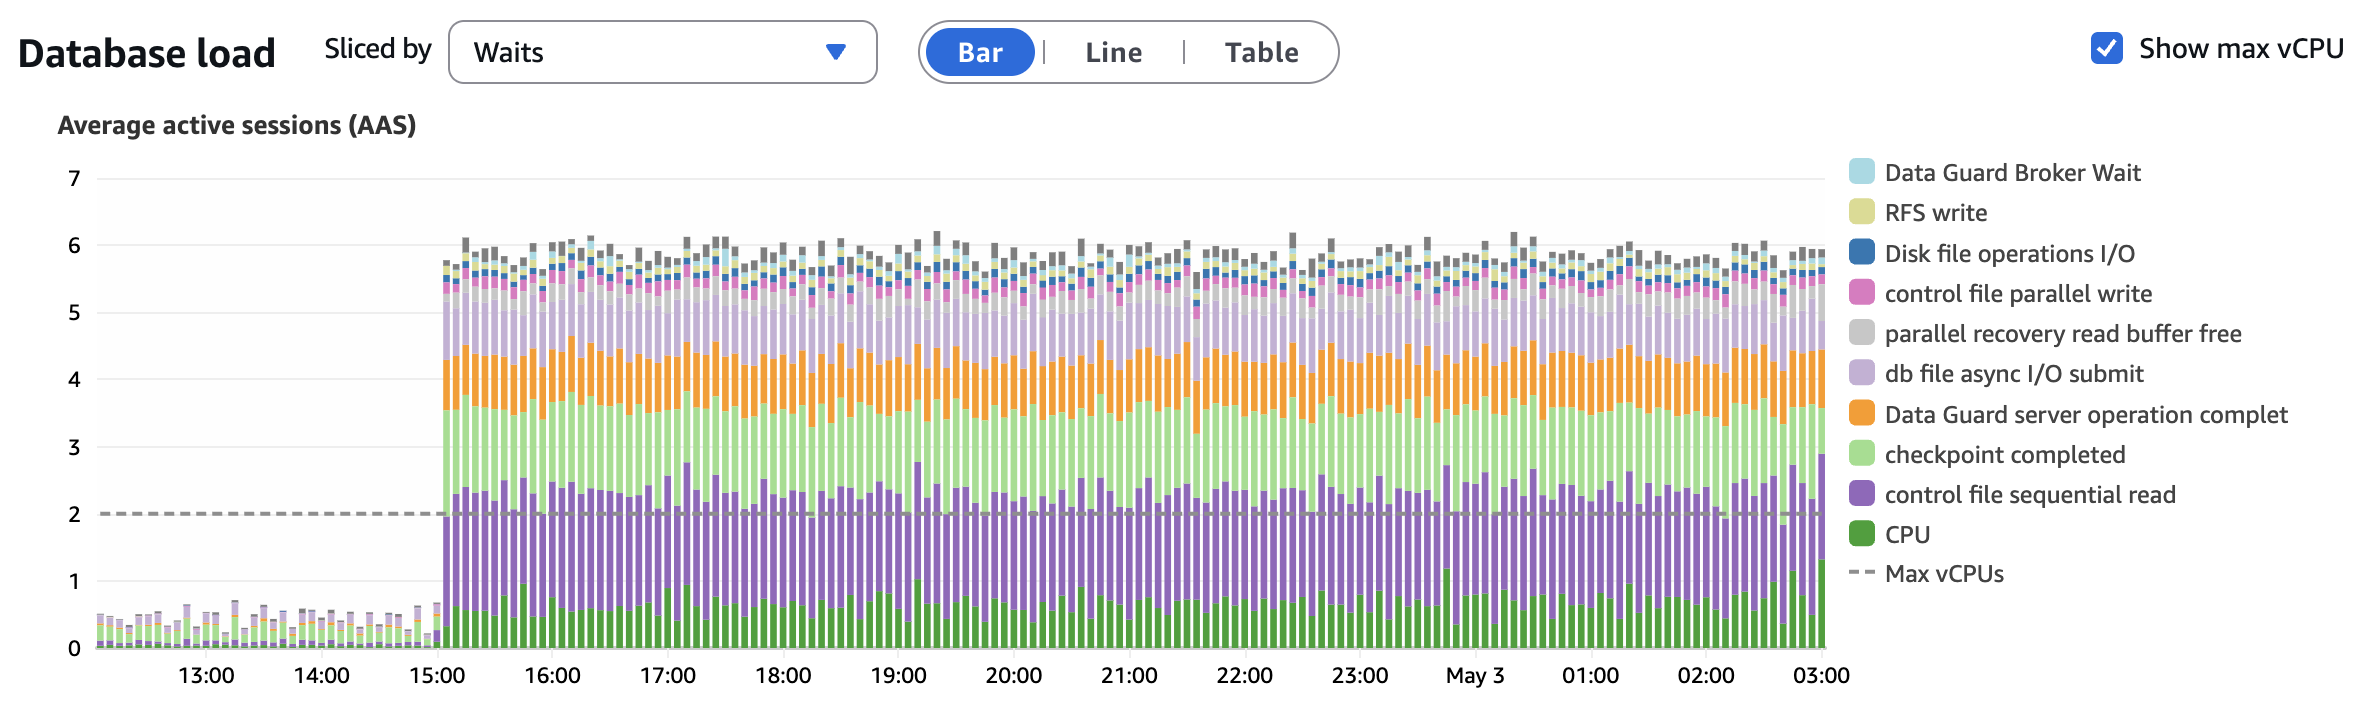
Starting at 15:00 UTC, average active sessions jumps to about 6 and is dominated by I/O-related waits: control file sequential read, checkpoint completed, db file async I/O submit, parallel recovery read buffer free, and Data Guard server operation complete. These are all on the apply / media recovery path, which indicates the Read Replica cannot persist redo changes fast enough.
Step 4: Check storage metrics on the Read Replica
Review BurstBalance and WriteIOPS for the Read Replica volume at the same time ReplicaLag started to grow.
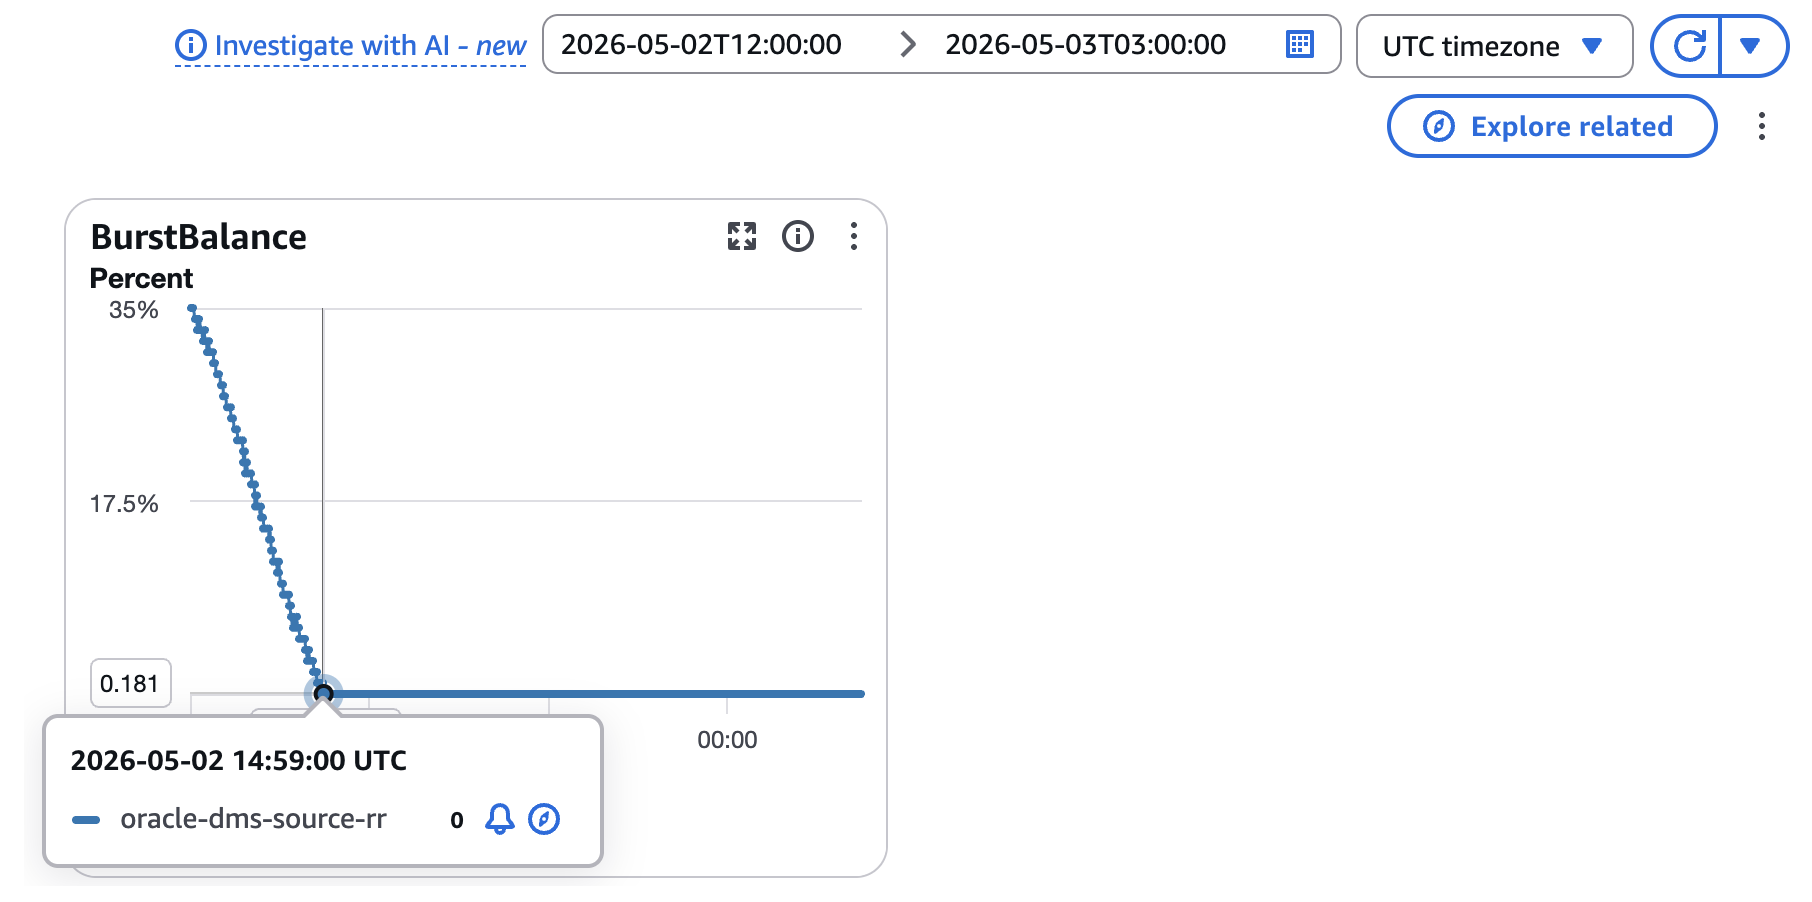
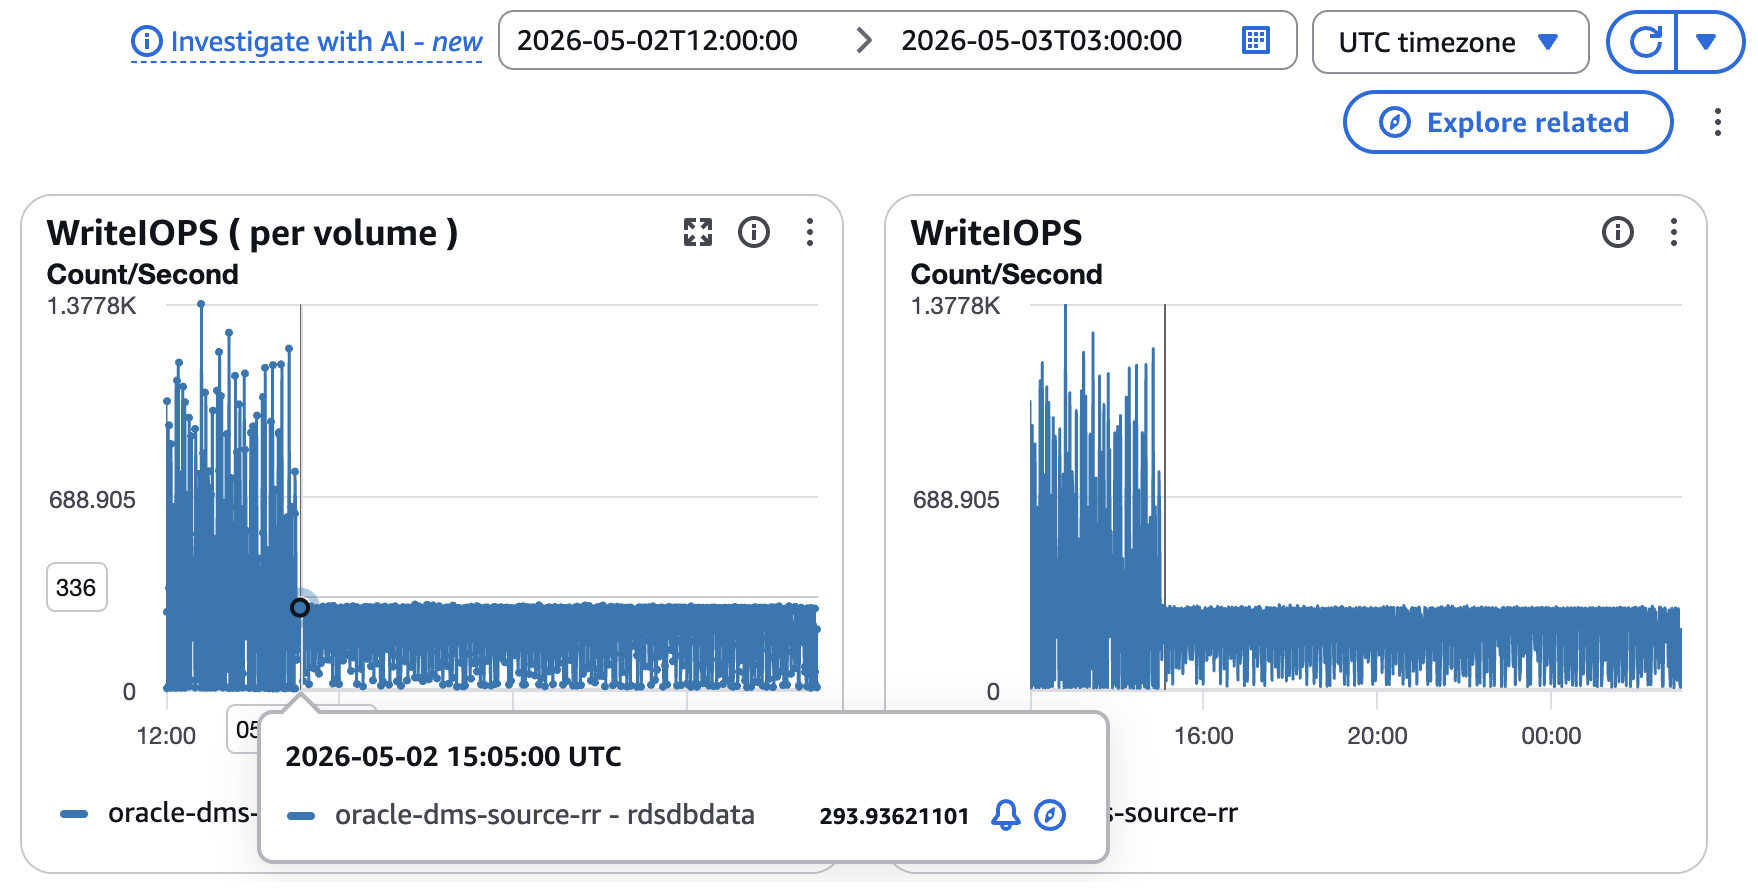
BurstBalance drops to 0% at 14:59 UTC and WriteIOPS flatlines at about 300 from 15:00 UTC onward. ReplicaLag starts climbing in the same minute. The gp2 volume exhausted its burst credits and is now throttled to its baseline IOPS, so MRP and parallel recovery workers have to wait on every write.
Step 5: Root cause
Redo ships to the Read Replica normally (ReplicaTransportLag is low), but the replica’s storage cannot keep up with apply I/O once volume exhausts burst credits. Because of this, a backlog of unapplied redo grows.
Step 6: Recommended actions to fix or mitigate the issue
- Switch the Read Replica storage to gp3 or io1/io2 with provisioned IOPS sized for sustained apply workload, or increase the gp2 volume size to raise baseline IOPS above the replica’s apply rate.
- Size Read Replica storage independently from the primary. Sustained apply can require as much or more write throughput than the primary workload.
- Use CloudWatch alarms on BurstBalance and ReplicaLag so you get notified before credits are exhausted.
Clean up
If you deployed the AWS resources or modified configuration settings while following this post, be sure to delete or revert those changes.
Conclusion
Replication lag in Amazon RDS for Oracle Read Replicas can impact your application performance and disaster recovery readiness. By enabling Database Insights and Enhanced Monitoring, understanding common wait events, and following the troubleshooting methodology discussed in this post, you can quickly identify root causes and implement appropriate solutions. For complex scenarios not resolved by these approaches, contact AWS Support or Oracle vendor support for additional assistance.