AWS Database Blog
From noise to signal: Monitoring Amazon DocumentDB like a pro
In this post, you learn best practices for building a tiered alerting strategy around a curated set of Amazon DocumentDB (with MongoDB compatibility) metrics organized by criticality. Instead of treating every metric equally, you assign each to one of three response tiers based on the action it demands. You also learn a structured approach to diagnosing slow queries using three complementary investigative lenses. You start with the profiler to identify specific slow operations, then correlate in Performance Insights to reveal wait-event patterns across the instance, and finally confirm in Amazon CloudWatch whether the issue is resource-bound or workload-bound. Finally, you learn a framework for monitoring garbage collection health, including monitoring cadence, escalation thresholds, and preventive actions before it becomes a cluster-wide incident. This post targets hands-on database administrators and DevOps engineers already running Amazon DocumentDB clusters in production. If you’re looking for initial setup guidance, refer to Monitoring metrics and setting up alarms on your Amazon DocumentDB clusters.
Monitoring architecture
Before diving into which metrics to alert on, it helps to understand how the monitoring data flows from your Amazon DocumentDB cluster to your response channels. Your Amazon DocumentDB cluster emits data to three collection services running in parallel. Amazon CloudWatch collects both instance-level metrics (such as CPUUtilization, FreeableMemory, and connections) and command-level metrics (such as AvgDuration, P100Duration, and MaxConcurrent per CRUD operation) at one-minute granularity. Performance Insights actively captures wait-event breakdowns and top query analysis, and you can view data sampled every second to understand the “why” behind load spikes. Amazon CloudWatch Logs receives profiler output containing individual slow operations that exceeded your configured duration threshold.
From these three collection points, data flows into your response channels, Critical metrics route to your on-call system, Warning metrics to ticketing or Slack, and Advisory metrics to a weekly review dashboard. The three-lens diagnosis framework described later uses all three data sources to investigate triggered alerts. The following diagram shows how monitoring data flows from your Amazon DocumentDB cluster through CloudWatch, Performance Insights, and profiler logs into the three response tiers.
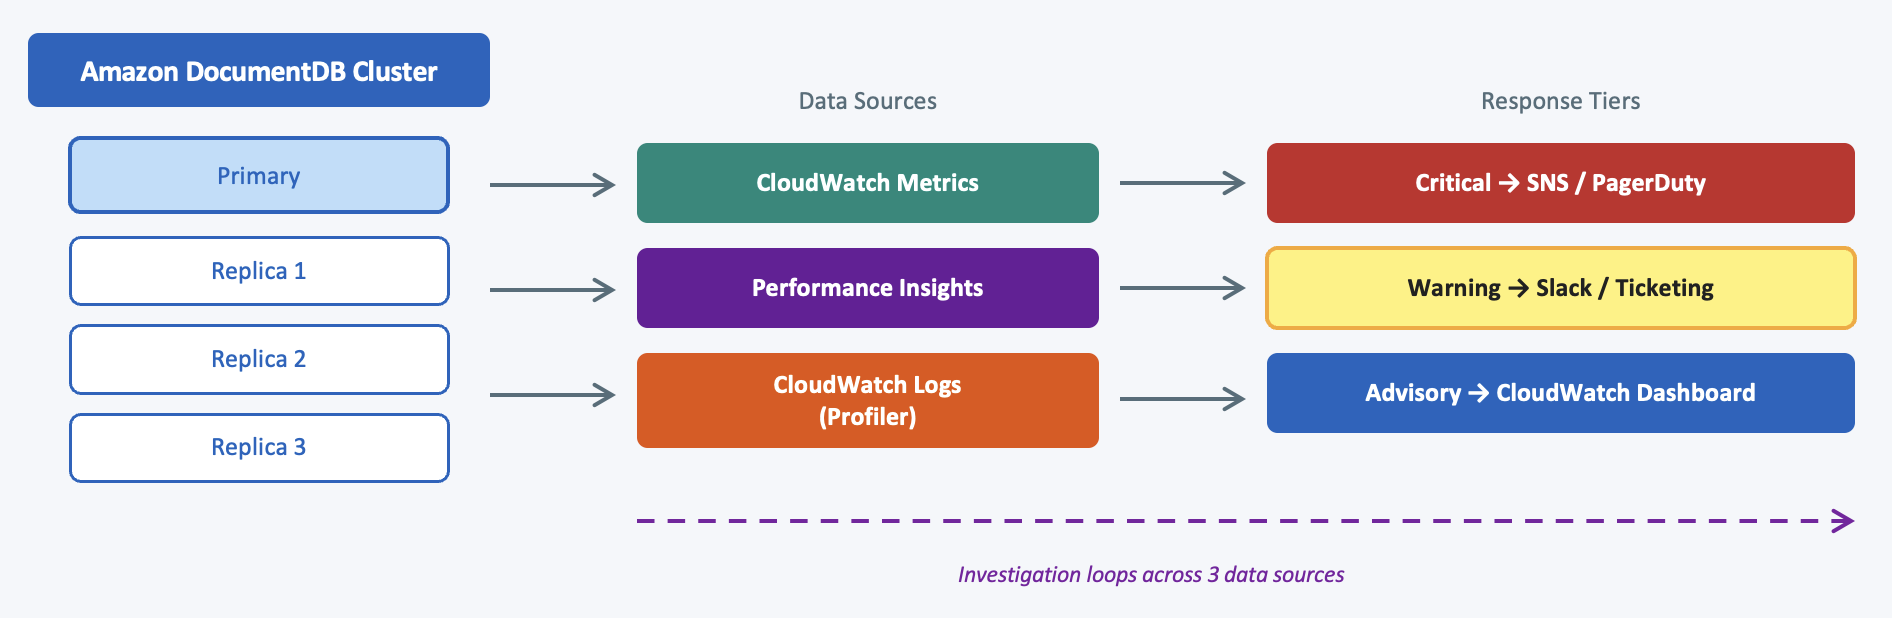
Figure 1: Architecture of monitoring and its classification of response tiers
Three tiers of operational response
A common mistake cloud engineering teams make is treating all metrics with equal urgency. A storage growth trend and a memory exhaustion event aren’t the same problem, and they should not trigger the same response channel. This post uses three tiers, categorized by the urgency of response they demand. The first tier, “Critical: minutes to impact,” covers situations where something is broken or minutes from breaking and user impact is imminent or already in progress. This tier triggers PagerDuty or Amazon Simple Notification Service (Amazon SNS) with auto-escalation. The second tier, “Warning: hours to impact,” covers degradation that’s in progress where a human must look within business hours, but the cluster isn’t falling over yet. This tier creates a ticket or sends a Slack notification. The third tier, “Advisory: review weekly,” covers capacity planning and cost signals with no urgency, reviewed in your weekly operations meeting on a dashboard with no alerts attached.
The tier you assign determines the alerting mechanism, not only the threshold. Getting this mapping right is the difference between a team that responds effectively and one that burns out on noise. The following diagram summarizes the three response tiers, their urgency levels, and the routing channels for each.
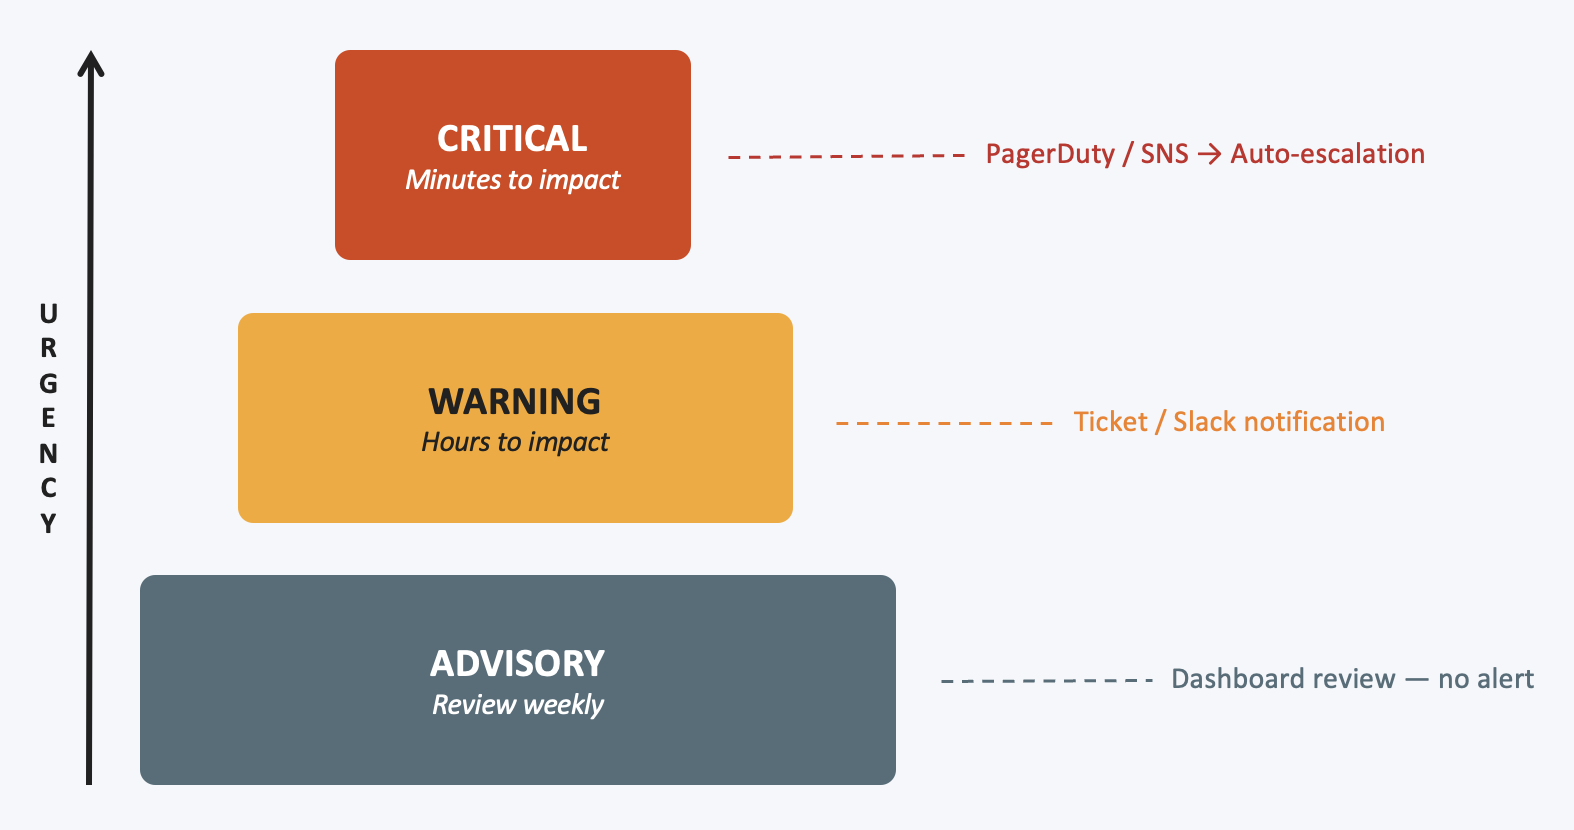
Figure 2: Three tiers of operational response: Critical, Warning, and Advisory with corresponding alerting mechanisms
Critical: Minutes to impact
The following metrics signal that your cluster is either broken or approaching failure. When one of these exceeds the defined threshold, someone should respond immediately.
CPUUtilization measures the percentage of allocated compute consumed by the instance. Sustained saturation above 80 percent for five or more minutes means operations are starving for compute cycles. Response times degrade non-linearly in this state, where small workload increases cause disproportionate latency spikes. When this alert triggers, your first question is whether the cause is query inefficiency or genuine under-provisioning. Query inefficiency is fixable with indexes or query optimization. Genuine under-provisioning requires a larger instance class. Cross-reference with the slow query diagnosis section that follows to determine which.
FreeableMemory shows available RAM on the instance. At engine startup, Amazon DocumentDB allocates approximately 65 percent of the total instance memory to the buffer cache. When FreeableMemory drops below 10 percent of total instance memory for three or more consecutive minutes, the engine’s memory pressure management activates. It begins throttling incoming operations to prevent out-of-memory crashes. This throttling manifests as sudden latency spikes across all operations and shows up as LowMemThrottle wait events in Performance Insights.
When this occurs, the Amazon DocumentDB engine actively limits operations to protect your cluster from out-of-memory crashes. Scaling up the instance class is typically the most effective immediate action because tuning parameters alone can’t resolve physical memory exhaustion. You should correlate FreeableMemory drops with BufferCacheHitRatio to understand whether the memory pressure is coming from the working set exceeding allocated buffer cache capacity.
BufferCacheHitRatio reports the percentage of read requests served from the in-memory buffer cache rather than requiring a storage-layer fetch. A well-tuned Amazon DocumentDB instance typically maintains this value above 90 percent, though optimal thresholds vary by workload. The difference between serving from memory (microseconds) and storage (milliseconds) is orders of magnitude in response time. Sustained drops indicate that either your data grew beyond instance memory or a new query pattern is scanning large portions of data not previously in the cache. Brief dips during cold starts or large analytical queries occur normally and don’t require your response. A sustained drop here means you either need a larger instance class with more memory, enable compression to reduce your in-memory footprint, or address the query patterns driving the increased scan activity. For recommended thresholds, refer to Amazon DocumentDB best practices.
The preceding three metrics (CPUUtilization, FreeableMemory, and BufferCacheHitRatio) form a tightly connected resource group. CPU saturation, memory exhaustion, and cache degradation rarely occur in isolation. When you receive a CPUUtilization alert, always check FreeableMemory and BufferCacheHitRatio simultaneously. A cluster under CPU pressure with healthy memory and cache is a query optimization problem. The same CPU pressure combined with low FreeableMemory and a dropping BufferCacheHitRatio is an under-provisioning problem that only instance scaling resolves. The following metrics shift focus from resource capacity to connectivity, latency, and storage subsystem health.
ReadLatency and WriteLatency measure the average time, in milliseconds, for read and write operations to complete at the storage layer. They are a strong signal of user-perceived performance. A good approach is to set thresholds based on your own baseline, where a 3x increase from your normal 7-day P95 is worth paging on. Where possible, use CloudWatch Anomaly Detection to learn your latency patterns automatically.
One commonly overlooked cause of elevated latency is network throughput saturation at the instance level. Each instance class has a defined network bandwidth limit, and instances smaller than 8xlarge operate with burst bandwidth allowances that can be exhausted under sustained load. When your workload pushes data transfer close to that ceiling, both read and write latency increase even though CPU and memory appear healthy. When you observe elevated latency without corresponding CPU or memory pressure, compare your NetworkThroughput and NetworkTransmitThroughput metrics against the documented network bandwidth for your instance class. If you find that network is the bottleneck, the resolution is to upscale to an instance class with higher network bandwidth allocation.
DiskQueueDepth reports the number of outstanding read and write requests waiting to be processed by the storage subsystem. In a healthy Amazon DocumentDB instance, this value remains close to zero because the storage layer processes requests faster than they arrive. When DiskQueueDepth sustains above 3x your normal baseline for three or more minutes, it indicates the storage layer is saturated and cannot keep pace with the I/O demand from the engine. Every queued request adds latency to the operation waiting behind it, and the queuing mechanism compounds this effect non-linearly as the queue grows. This metric often spikes in tandem with BufferCacheHitRatio dropping, because cache misses generate additional storage I/O that overwhelms the subsystem. When this alert triggers, cross-reference with BufferCacheHitRatio. If the cache ratio is healthy but DiskQueueDepth is elevated, the likely cause is write-heavy workloads generating more I/O than the instance class can sustain. The path forward is to upscale the instance or distribute writes across more instances.
AvailableMVCCIds reports the remaining Multi-Version Concurrency Control (MVCC) IDs available in the cluster. Amazon DocumentDB uses MVCC for transaction isolation, where every write consumes an ID, and garbage collection reclaims them. If AvailableMVCCIds reaches zero, the cluster enters a temporary read-only mode because no new write operations can assign a valid MVCC ID until the system finishes recycling older versions. Create a CloudWatch alarm with a threshold of 1.3 billion, as recommended in Amazon DocumentDB garbage collection. This gives you adequate time to take action before the metric reaches zero. Keep in mind that this metric may fluctuate based on your specific usage patterns. Some customers see it drop below 1.3 billion and then recover above 1.5 billion as garbage collection completes its work. The common causes that prevent garbage collection from keeping pace are long-running transactions, open cursors, or abandoned sessions holding MVCC snapshots.
Command-level AvgDuration provides the mean execution time for each specific CRUD command type, published directly to CloudWatch with no profiler overhead. These metrics cover find, insert, findAndModify, update, delete, aggregate, count, distinct, getMore, abortTransaction, and commitTransaction. Unlike aggregate ReadLatency and WriteLatency, which blend all operations together, command-level AvgDuration isolates exactly which operation type is degrading. A sudden increase in find.AvgDuration while insert.AvgDuration remains stable immediately tells you the problem is on the read path. This is likely a query plan regression or an index problem. Alert on greater than 2x deviation from a 7-day baseline, sustained for three minutes. When AvgDuration spikes on a specific command, your next step is the profiler and explain plan (covered in the following slow query diagnosis section) to identify the specific query and its execution plan.
DatabaseConnections, DatabaseConnectionsMax, and DatabaseConnectionsLimit must be evaluated together to give you the complete picture of connection health. DatabaseConnections shows you the current count, DatabaseConnectionsMax shows the peak reached during the sampling period, and DatabaseConnectionsLimit is the hard ceiling for your instance class (refer to Amazon DocumentDB instance limits for per-instance-class limits). Alert when DatabaseConnectionsMax exceeds 80 percent of DatabaseConnectionsLimit. When connections hit the limit, new connection attempts fail immediately with no queueing. Connection storms from retry logic can cascade across microservices within seconds. Your investigation should focus on whether connections are being leaked (not properly closed by the application), whether connection pooling is configured correctly, or whether a single service has opened too many parallel connections relative to the instance limit.
DatabaseConnectionsActiveMax reports the maximum number of active database connections on an instance in a one-minute period. Active connections are those currently running an operation, as opposed to idle connections sitting in a connection pool. This distinction matters because a cluster can have, for example, 2,000 total connections open (DatabaseConnections) but only 200 actively executing operations (DatabaseConnectionsActiveMax). If DatabaseConnectionsActiveMax is spiking while DatabaseConnections remains stable, your existing connections are suddenly all working simultaneously, which points to a burst in application concurrency or a slow query causing operations to pile up. If both DatabaseConnections and DatabaseConnectionsActiveMax spike together, your application is opening new connections and running operations on all of them, which usually indicates a retry storm or a newly deployed service flooding the database. Configure alert when DatabaseConnectionsActiveMax exceeds 70 percent of your instance’s active connection limit (refer to Amazon DocumentDB instance limits for per-instance-class limits). When this triggers, check whether slow queries are holding connections active longer than expected by cross-referencing with command-level AvgDuration and Performance Insights wait events.
ServerlessDatabaseCapacity reports the current capacity allocated to a Serverless instance, measured in Amazon DocumentDB Capacity Units (DCUs). If this metric consistently hits the maximum DCU limit configured for your cluster, incoming requests may experience throttling or increased latency because the engine cannot scale further. Alert when ServerlessDatabaseCapacity remains at the configured maximum for more than five minutes and correlate with CPUUtilization and ReadLatency to determine whether you need to raise the maximum capacity setting. For a full list of Serverless-specific monitoring metrics, see Monitoring Amazon DocumentDB Serverless.
Warning: Hours to impact
The following metrics indicate something is trending in the wrong direction. They don’t demand immediate response, but someone should investigate within business hours. These are your early indicators of degradation that, left unattended, escalate into Critical tier alerts.
OpcountersQuery and OpcountersCommand represent your workload’s heartbeat, showing the count of query and command operations per second. Query operations include find and aggregate requests, while command operations include administrative and diagnostic commands such as createIndex, listCollections, and serverStatus. Sudden spikes or drops signal that something changed in your application layer. A 3x spike in OpcountersQuery could mean several things: a deployment introduced a retry loop, a cache layer failed and is pushing all reads directly to the database, or a batch job started unexpectedly. Use CloudWatch Anomaly Detection to establish a 7-day rolling baseline that accounts for daily and weekly patterns such as morning ramp-ups and weekend dips. Alert on deviation greater than 2 to 3x from the learned baseline. When an alarm triggers, overlay the metric timeline with your deployment history and traffic graphs. The question you are answering is not “are operations high?” but rather “did something change that we did not expect?”
ReplicationLag measures how far behind your replica instances are relative to the primary, in milliseconds. If your application reads from replicas for read scaling, stale replicas mean stale data returned to your users. Whether this matters depends on your consistency requirements. Some applications tolerate seconds of lag while others need sub-100ms freshness. Set your alert threshold based on your application’s read-consistency requirements. If you serve user-facing reads from replicas, alert when lag exceeds your defined service level agreement (SLA), for example sustained above 500 ms for five minutes. Sustained replication lag usually indicates the replica is undersized relative to write throughput on the primary. Alternatively, the writer instance may be overloaded and unable to respond to the replica’s replication stream requests at the CPU or network level.
SwapUsage confirms that the operating system has started paging memory to disk. Any sustained non-zero swap usage in Amazon DocumentDB indicates the instance has exceeded physical memory and is relying on disk for memory operations, which causes severe performance degradation. This is one of the few metrics where any sustained value above zero warrants an alert and immediate attention. If swap appears, scale up your instance class.
VolumeBytesUsed tracks total storage consumed by the cluster in bytes. Do not alert on an absolute value because a 500 GB cluster is not inherently a problem. What matters is the growth rate. Use CloudWatch metric math to calculate the rate of change and configure alerts for the scenario when the growth rate exceeds 2x your normal daily rate for more than an hour. A sudden slope change indicates one of three things. First, bulk data loads, which are expected and can be correlated with application events. Second, garbage collection (GC) falling behind, which you can investigate using the following GC framework. Third, storage fragmentation from heavy update and delete patterns where dead document fragments accumulate faster than GC can reclaim them.
Command-level P100Duration captures the worst-case (maximum) execution time for each command type during the sampling period. This metric reveals the queries that make individual users wait. AvgDuration might look healthy across the board, but if one out of every thousand find operations takes 30 seconds, that represents a real user experiencing a timeout or an unacceptable response time. Monitor for P100Duration for any command that exceeds 5x its corresponding AvgDuration, sustained over five minutes. Your investigation path starts in Performance Insights: slice by waits during the elevated period. CPU-dominant waits suggest a collection scan or inefficient plan. IO-dominant waits suggest the query is reading data not in the buffer cache. DocumentLock waits suggest hot-document write contention where multiple operations target the same document.
Command-level MaxConcurrent reports the peak number of simultaneous executions of a specific command type during a sampling period. A spike from a baseline of 20 to 200 for find operations usually indicates a connection or retry storm in your application layer, or an uncontrolled bulk operation that is consuming resources. Alert on greater than 3x baseline sustained for two minutes. Correlate with DatabaseConnections to determine whether both are spiking simultaneously, which typically confirms that your application layer is in a retry loop or that a recent deployment opened too many parallel connections to the database.
Advisory: Review weekly
These metrics don’t warrant alerts. They belong on a capacity planning dashboard that you review during your weekly operations meeting to inform scaling decisions and cost optimization.
BackupRetentionPeriodStorageUsed tracks storage consumed by automated backups within the backup retention period. Amazon DocumentDB provides free backup storage equal to the size of your cluster volume. Beyond that free allocation, backup storage is billed per GB-month (refer to Understanding backup storage usage for details). Review quarterly to determine whether your compliance requirements actually need the configured retention days or whether that was a default someone set during cluster creation and never adjusted.
VolumeReadIOPs and VolumeWriteIOPs report absolute I/O operations against cluster storage. Monitor the total I/O volume to understand your workload’s storage access patterns and identify unexpected spikes. If sustained I/O levels consistently exceed your baseline, investigate whether queries are performing unnecessary collection scans or whether your working set has outgrown the buffer cache. On standard storage configurations, high I/O also impacts cost. If I/O costs exceed 25 percent of your total cluster spend, evaluate whether switching to the I/O-Optimized storage configuration makes sense for your workload.
NetworkThroughput and NetworkTransmitThroughput report data volume transferred in and out of the instance. Alert when the sum of NetworkThroughput and NetworkTransmitThroughput exceeds 80 percent of your instance type’s documented network bandwidth limit (refer to Instance class specifications for per-instance-class network bandwidth). High sustained network throughput can indicate two things: cross-Availability Zone (AZ) latency when your application servers are in a different AZ than your Amazon DocumentDB instances, or large result sets being transferred to clients that increase response times. Sometimes adding a projection to limit the fields returned in query results reduces network cost more effectively than adding bandwidth or scaling up.
LongestActiveGCRuntime reports the duration of the longest currently running garbage collection process on the cluster. Trend this weekly by reviewing the values over time. If GC runtimes are gradually increasing, the volume of dead document versions because of update or delete operations is growing faster than GC can reclaim them, meaning GC is falling behind its workload. This metric is your early warning signal before AvailableMVCCIds drops into the critical zone. An increasing trend here means you should proactively investigate which collections have high MVCCIdScale values using the approach described in the following garbage collection section.
Slow query diagnosis: The three lenses
A slow query is a symptom with multiple possible root causes. Effective diagnosis requires three complementary lenses that each reveal a different dimension of the problem. Used together, they move you from “something is slow” to a precise understanding of what is wrong and what to fix. The workflow is sequential in priority but parallel in practice. Start with Lens 1 (profiler and explain plan) because it identifies the specific query and reveals whether the plan itself is the problem. Move to Lens 2 (Performance Insights) to confirm whether the load pattern matches the plan issue or reveals contention you would not infer from the plan alone. Finally, check Lens 3 (CloudWatch infrastructure metrics) to rule out resource saturation as the true bottleneck. In an active incident, run all three lenses simultaneously, but read the results in this order because each lens narrows the hypothesis for the next. Consider a case where Lens 1 shows a healthy plan (the chosen index has high selectivity, confirmed by a low ratio of documents examined to documents returned in the explain output) and Lens 2 shows pure CPU or IO waits without lock contention. In that case, Lens 3 (infrastructure) becomes your answer: scale up. The following diagram shows the three-lens diagnostic workflow from alert to remediation.
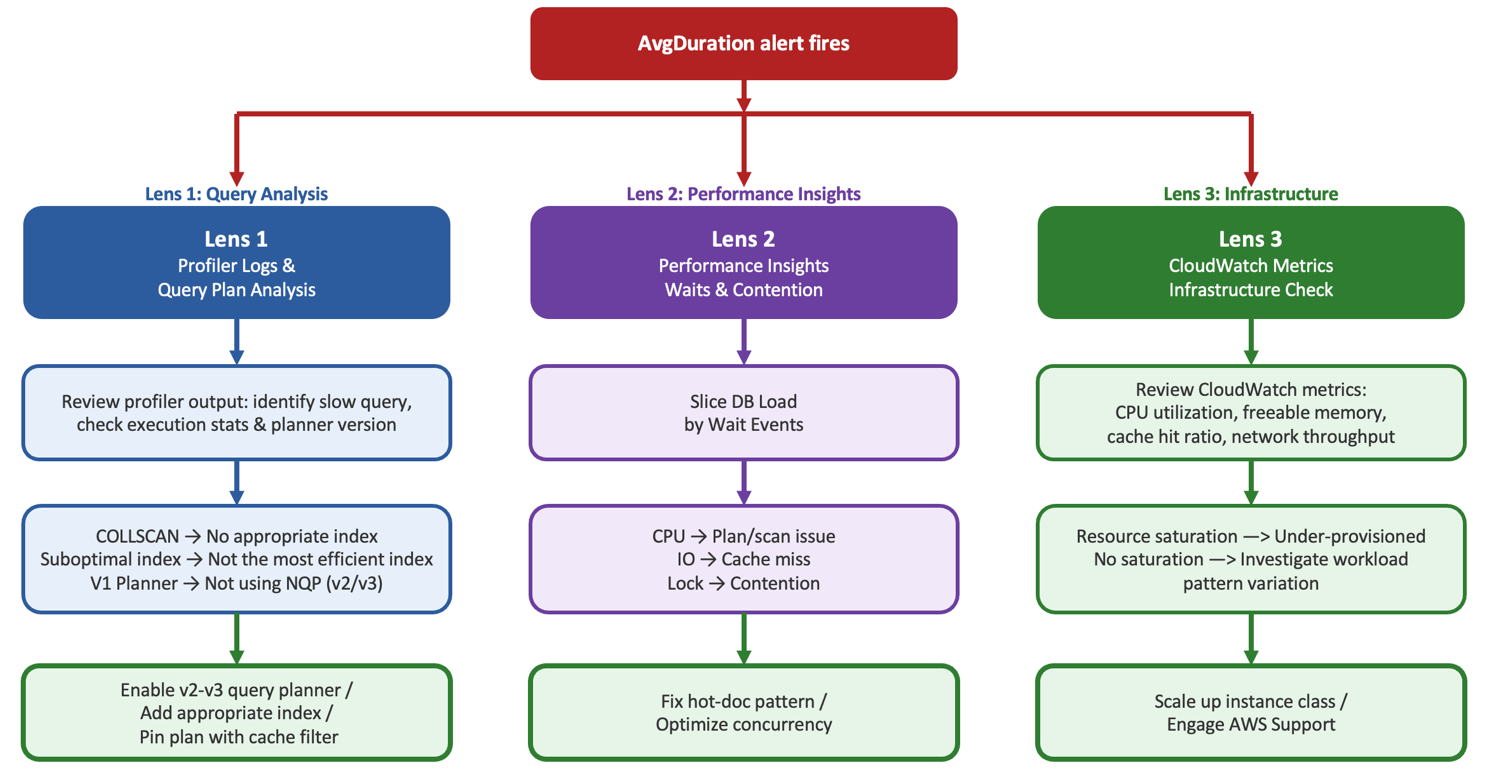
Figure 3: Slow query diagnosis flowchart: three investigation paths from an AvgDuration alert to root cause and remediation
Lens 1: Profiler logs and query plan analysis
The profiler tells you which queries are slow. Query plan analysis tells you why. The Amazon DocumentDB profiler captures operations exceeding a configurable duration threshold (default 100 ms). When you identify a slow query in the profiler output, examine the execution statistics to understand the query plan. You are looking for collection scans (COLLSCAN) where no index is used at all, suboptimal index selection indicated by a high ratio of documents examined to documents returned, and in-memory sorts identified by the presence of a SORT stage in the execution plan. If execution plans show suboptimal index selection, use Query Planner v3 (default in Amazon DocumentDB 8.0) which improves index selection across find, update, aggregate, and distinct operations. On similar lines, Query Planner v2 is also available in Amazon DocumentDB 5.0 which is opt-in through a cluster parameter group. For urgent cases where specific queries need immediate correction, use a client-side index hint or plan cache filter to specify which indexes a given query shape can use.
The connection between your CloudWatch alert and your investigation path is direct: when command-level AvgDuration increases on a specific command type (your Critical tier alert), the investigation path is profiler, then identify the slow query, analyze its explain plan and fix it to use the most effective index. For detailed guidance on interpreting execution plans, refer to Amazon DocumentDB query plan analysis. For a complete guide to identifying and remediating patterns that lead to query plan based slowness, refer to Amazon DocumentDB performance anti-patterns and the slow queries troubleshooting guide.
Lens 2: Performance Insights for waits and contention
With Performance Insights, you can visualize the load on the database. Database Load is measured in Average Active Sessions (AAS), sampled every second. The power of Performance Insights is in the wait-event breakdown, which shows what each active session is waiting on. The key wait events and their interpretations are as follows: CPU indicates sessions actively consuming compute, usually pointing to collection scans, in-memory sorts, or a suboptimal query plan. IO indicates storage-layer waits where the working set exceeds the buffer cache, and you should cross-reference with BufferCacheHitRatio. DocumentLock indicates concurrent writes to the same document, which is a hot-document write pattern. CollectionLock indicates sessions waiting on collection-level DDL operations. BufferLock indicates waiting on a shared-page lock, often caused by open cursors holding buffer pages. Latch indicates buffer-pool paging from large queries or an undersized buffer. SystemLock indicates long transactions, long queries, or high concurrency cascading from DocumentLock contention. LowMemThrottle indicates memory pressure throttling where the only resolution is scaling up.
Use command-level CloudWatch metrics as your entry point, then drill into Performance Insights for root cause. When AvgDuration rises on find or aggregate operations, slice DB Load by waits. If CPU is dominant, check the explain plan for the offending queries. If I/O is dominant, you’re likely experiencing buffer cache misses. When P100Duration spikes but AvgDuration remains stable, pivot to Top Queries in Performance Insights to isolate the specific statement causing tail latency. When MaxConcurrent spikes on one command, check for DocumentLock or SystemLock waits to understand the concurrency pattern. For additional context on using Performance Insights with Amazon DocumentDB, refer to Analyze Amazon DocumentDB workloads with Performance Insights. The following diagram illustrates how command-level metrics correlate with Performance Insights wait events to pinpoint the root cause of slow queries.
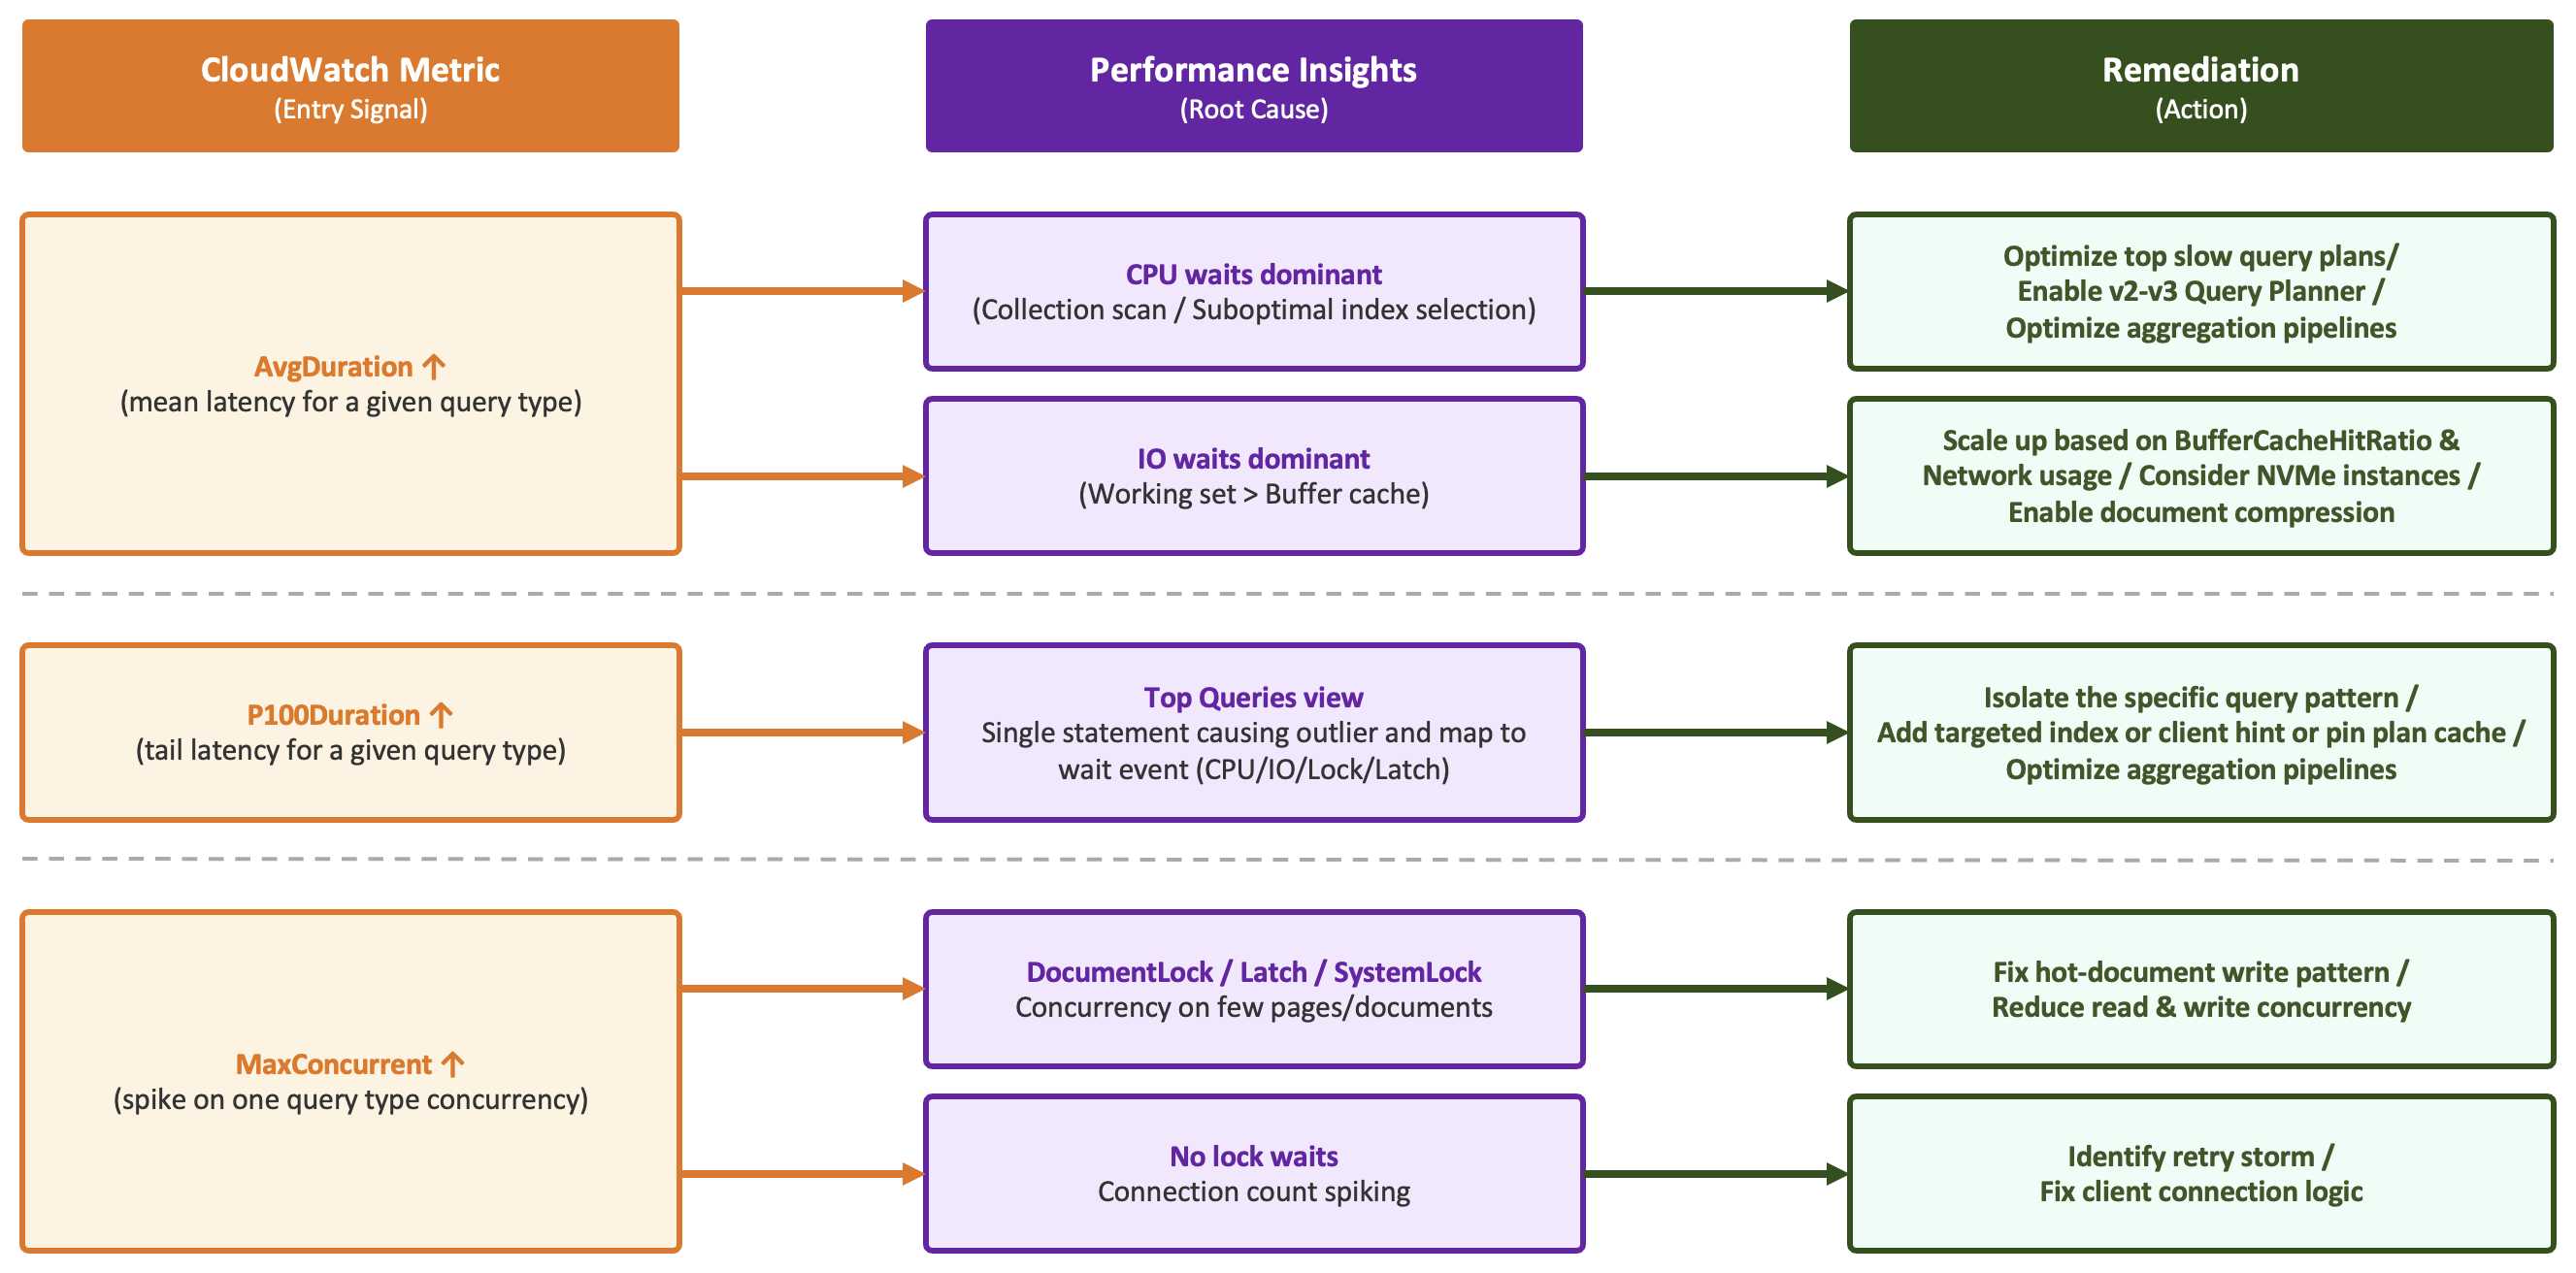
Figure 4: Command-level metrics to Performance Insights correlation: from CloudWatch signal to root cause to remediation action
Lens 3: CloudWatch metrics to determine if it is the hardware
Sometimes slow queries are not caused by bad queries. They are caused by running good queries on an undersized instance. This lens answers whether the infrastructure itself is the bottleneck rather than the query patterns. Connect back to your Critical tier metrics: CPUUtilization sustained above 80 percent combined with slow queries means the instance can’t keep up with workload volume regardless of how well optimized your queries are. Low FreeableMemory combined with dropping BufferCacheHitRatio means the working set exceeds memory. Queries that can’t be served from the buffer cache incur an I/O penalty that can be reduced but not removed through query optimization alone. NVMeStorageCacheHitRatio dropping means the tiered cache is also not sufficient for your access pattern. If Lens 1 shows reasonable query plans and Lens 2 shows pure CPU or IO waits without lock contention, the answer is to scale up.
Putting the three lenses together
The following example shows how the three lenses work in sequence for a real diagnosis.
- Your AvgDuration alarm for the find command activates. You open the profiler (Lens 1) and identify a query against the orders collection showing a COLLSCAN stage with a duration of 1,200 ms. The explain plan confirms no index covers the filter predicate on the orderDate field.
- Moving to Performance Insights (Lens 2), you see the top wait events during the same time window are I/O and CPU, which confirms that the full collection scan is reading from storage rather than cache.
- Checking Amazon CloudWatch (Lens 3), you observe that BufferCacheHitRatio dropped to 72 percent during the incident window. This confirms the working set for this scan exceeds available buffer cache capacity.
The fix: create an index on the orderDate field used in the filter predicate. After index creation, AvgDuration returns to baseline within minutes because the query now reads from the index rather than scanning the entire collection.
Without this structured approach, teams often jump directly to scaling up the instance (Lens 3 conclusion) without first checking whether an index fix (Lens 1 conclusion) would resolve the issue at zero cost.
Garbage collection: The hidden performance factor
Amazon DocumentDB uses MVCC for transaction isolation. Every write creates a new document version, and garbage collection runs in the background to reclaim versions that are no longer visible to any active transaction. Under normal conditions this is invisible. Problems start when GC falls behind, typically because of long-running transactions, abandoned sessions holding cursors open, or high update rates producing dead versions faster than GC can clean them up. The result is MVCC ID exhaustion and unbounded storage growth.
The following diagram illustrates how MVCC ID space is consumed and reclaimed, including the conditions that block garbage collection.
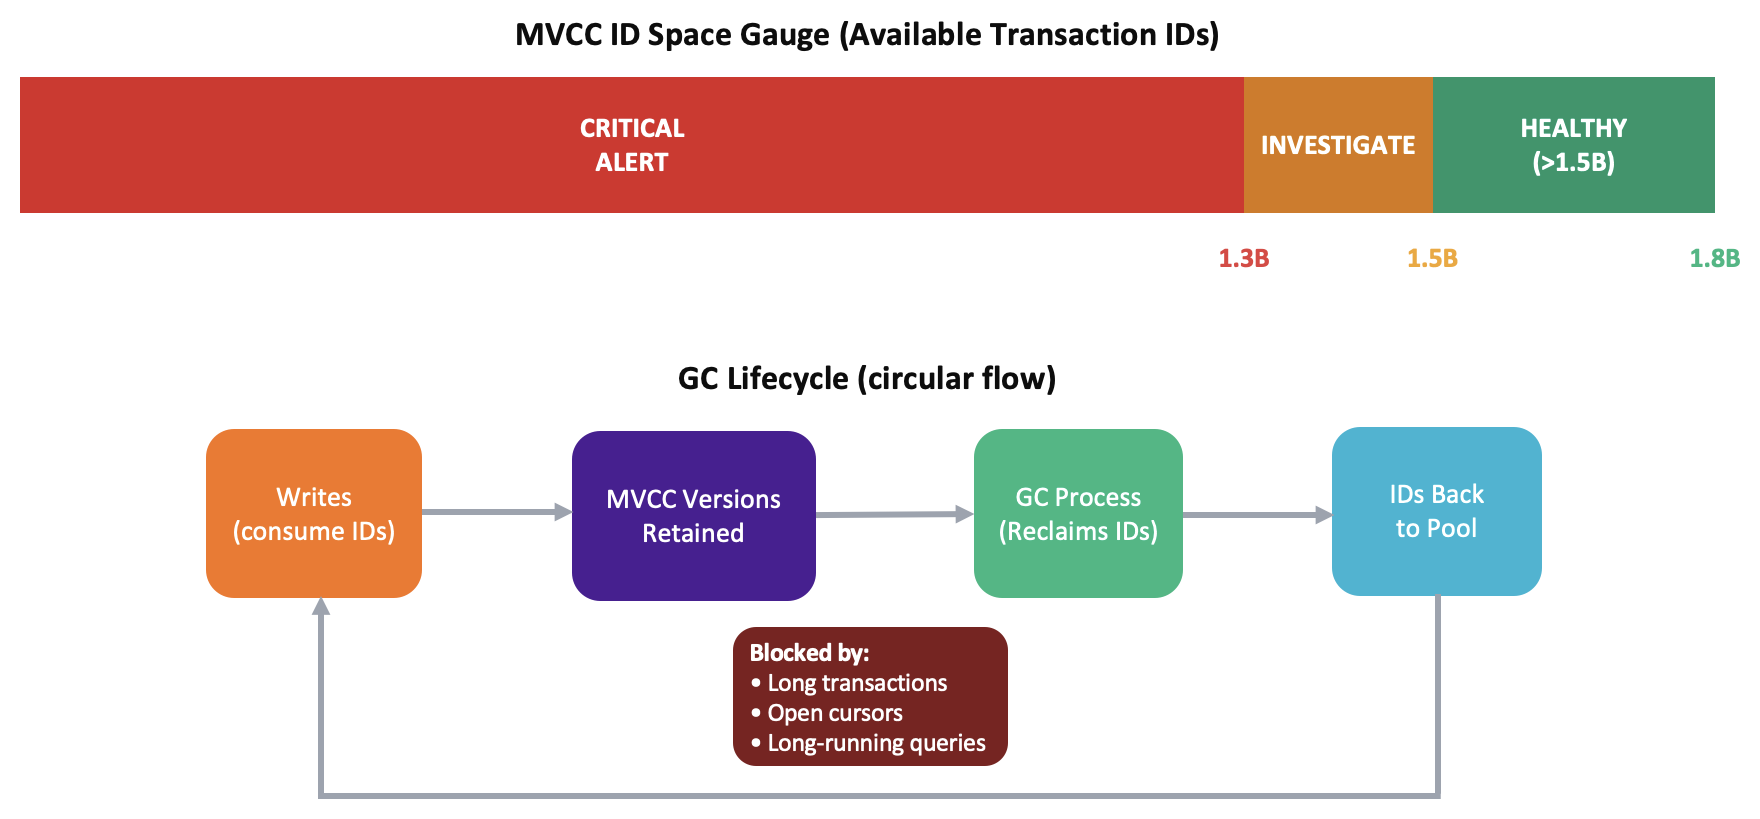
Figure 5: MVCC ID space and GC lifecycle: danger zone below 1.3B, investigation zone at 1.5B, and the write/reclaim cycle
Collection-level diagnosis with collStats
The cluster-level CloudWatch metrics (AvailableMVCCIds and LongestActiveGCRuntime) tell you that GC is struggling. They don’t tell you where. For that, run db.collection.stats() on your write-heavy collections and look at:
- MVCCIdScale (0 to 1): What proportion of the cluster’s MVCC ID consumption belongs to this collection. Keep it below 0.3. If one collection shows 0.8, that’s your primary target.
- gcRuntimeStats: Rolling two-month history of GC runs exceeding five minutes. Watch historicalAvgRuntime. If it’s increasing month over month, the collection is accumulating complexity faster than GC can handle.
- deadDocFragmentsPercent (Amazon DocumentDB 8.0): Percentage of storage occupied by dead document versions waiting to be reclaimed.
If VolumeBytesUsed is growing but your document count is stable, check deadDocFragmentsPercent and MVCCIdScale on your write-heavy collections to find which ones are responsible.
Preventive actions (before GC health degrades)
The following practices reduce the likelihood of GC falling behind in the first place.
- Set application-level transaction timeouts (for example, 60 seconds) to prevent long-running transactions from holding MVCC snapshots indefinitely.
- Configure session idle timeouts to automatically close abandoned connections before they pin old MVCC versions.
- Schedule bulk delete and update operations during low-traffic windows to give GC sufficient compute cycles to keep pace with version creation.
- Limit batch sizes for bulk writes to reduce the per-transaction MVCC footprint.
- Use explicit
cursor.close()calls in application code to release read snapshots as soon as processing completes, rather than waiting for cursor timeout. - Track your weekly write volume growth (OpcountersInsert, OpcountersUpdate, OpcountersDelete) against the AvailableMVCCIds consumption trend. If write volume is growing month-over-month but AvailableMVCCIds is declining at a faster rate, GC is not keeping pace. Proactively scale your instance or redistribute write-heavy collections before the gap becomes critical.
For detailed guidance on garbage collection mechanics and monitoring, refer to Amazon DocumentDB garbage collection.
Conclusion
In this post, we presented best practices for building a tiered alerting strategy for Amazon DocumentDB, selecting curated metrics for their predictive value rather than completeness. The core approach is to alert less but alert on the right signals, investigate with the appropriate lens for the problem type, and review capacity and cost signals on a weekly cadence rather than routing them through alert channels that demand immediate attention. In our experience, teams adopting this approach see a significant reduction in alert noise. The structured three-lens workflow replaces ad hoc investigation with a repeatable, faster path to root cause. We also explored how garbage collection health directly impacts cluster stability, and how monitoring MVCC consumption alongside collection-level stats provides early warning before GC-related incidents occur.
If you implement only the Critical tier metrics and establish the three-lens framework for slow query investigation, you have a monitoring strategy that catches the problems that matter before they become customer-visible incidents. Start with the Critical tier. Add the Warning tier when your team has the operational maturity to respond to non-urgent signals without treating them as emergencies. Review the Advisory tier when you are ready to optimize cost and plan capacity proactively rather than reactively.