AWS Database Blog
Monitor Amazon Aurora DSQL costs with the Aurora DSQL console and CloudWatch alarms
As your Amazon Aurora DSQL workload scales and Distributed Processing Unit (DPU) consumption grows, how do you keep an eye on your costs? With the right monitoring in place, you can stay ahead of spending and maintain full visibility into your serverless database costs. You keep that visibility even without fixed instance charges acting as a natural ceiling.
In this post, we show how to monitor your Aurora DSQL usage and cost so you fully realize the benefit of its on-demand pricing. You pay only when you use Aurora DSQL. We walk through the built-in Usage and cost panel in the Aurora DSQL console and Amazon CloudWatch alarms. The CloudWatch alarm described in this post evaluates your hourly DPU rate (not cumulative month-to-date spend) on an hourly schedule, so alerts arrive subject to the normal near-real-time CloudWatch metric delay rather than instantaneously. You will learn how to:
- Understand the Aurora DSQL DPU pricing model and how CloudWatch metrics map to your bill.
- View DPU usage and estimated cost in the Aurora DSQL console’s built-in Usage and cost panel.
- Set up CloudWatch alarms with Amazon Simple Notification Service (Amazon SNS) notifications that fire when your hourly DPU usage approaches the hourly share of your budget. This includes the console’s built-in Create alarm flow that prefills a recommended alarm.
- Deploy monitoring alarms consistently as infrastructure as code (IaC) using AWS CloudFormation.
This post is intended for AWS developers and database administrators at an advanced (300) level who are using or evaluating Aurora DSQL and want proactive cost governance.
Prerequisites
Before getting started, confirm that you have the following:
- An active Aurora DSQL cluster (single-Region or multi-Region).
- The AWS Command Line Interface (AWS CLI) configured with appropriate permissions.
- Permissions to create AWS Identity and Access Management (IAM) roles and CloudWatch alarms.
- An AWS account with access to the AWS CloudFormation console.
Understanding Aurora DSQL pricing
Aurora DSQL is a serverless, PostgreSQL-compatible distributed SQL database with an active-active multi-Region architecture, designed for 99.99% single-Region and 99.999% multi-Region availability. Aurora DSQL uses a request-based, usage-driven pricing model with no instances to provision and no hourly charges when the database is idle. This model scales to zero when not in use, so you pay only for what you consume.
Aurora DSQL meters two primary components: database activity, measured in Distributed Processing Units (DPUs), and storage, measured in GiB-month. It consolidates active database usage into the single DPU billing unit and normalizes DPUs at the same rate regardless of whether they represent compute, read, write, multi-Region write, or change data capture (CDC) streaming activity. Instead of tracking and billing separately for vCPU, memory, network bandwidth, and I/O operations per second (IOPS), Aurora DSQL unifies active database usage into this single metric. Aurora DSQL bills storage separately and does not include it in DPU calculations.
For single-Region clusters, Aurora DSQL calculates total DPU as the sum of three components:
Two optional components are added only when the corresponding feature is in use. Multi-Region clusters add a MultiRegionWriteDPU component, and clusters with change data capture (CDC) enabled add a StreamDPU component:
Note: You incur StreamDPU only when you enable CDC on the cluster, and you incur MultiRegionWriteDPU only on multi-Region clusters. On a single-Region cluster with no CDC stream, both are zero and neither contributes to your bill.
Table 1 summarizes Aurora DSQL pricing components in the US East (Ohio) Region. Rates vary by Region. For current rates, see the Aurora DSQL pricing page.
Table 1: Aurora DSQL pricing components
| Component | Rate (US East, Ohio) | Description |
| DPU | $8 per million DPUs | All compute, read, write, multi-Region write, and CDC streaming activity |
| Storage | $0.33 per GiB-month | Replicated across 3 Availability Zones. You pay for one logical copy per Region |
| AWS Free Tier | 100,000 DPUs + 1 GiB/month | Available each month at no charge. Automatically applied to your bill |
Aurora DSQL charges $0.33 per GiB-month for storage. Aurora DSQL replicates storage across three Availability Zones in each Region, but you pay for only one logical copy per Region.
Only if you create a multi-Region cluster does Aurora DSQL automatically replicate writes to each peered cluster in the other AWS Regions. These replicated writes incur additional DPU charges equal to the cost of the originating writes, and CloudWatch displays them as MultiRegionWriteDPU. There are no separate data transfer charges for this replication. Single-Region clusters do not incur MultiRegionWriteDPU.
On your bill, you see only two line items: one for storage and one for DPU, which represents the sum of the individual components.
Key CloudWatch metrics for Aurora DSQL
Aurora DSQL publishes near-real-time usage metrics to CloudWatch under the AWS/AuroraDSQL namespace with the ClusterId dimension. CloudWatch retains these statistics for 15 months, so you can access ample historical data for trend analysis.
Table 2: DPU metrics that map to billing (ClusterId dimension)
| Metric | Unit | Description |
| ComputeDPU | DPU | Compute (query processing) active-use component |
| ReadDPU | DPU | Read active-use component |
| WriteDPU | DPU | Write active-use component |
| MultiRegionWriteDPU | DPU | Multi-Region write component (multi-Region clusters only) |
| TotalDPU | DPU | Total active-use DPU usage (sum of all applicable components) |
If you enable CDC streaming, you can monitor each stream independently using the additional per-stream metrics that Aurora DSQL publishes with both the ClusterId and StreamId dimensions. Table 3 lists the CDC stream metrics most relevant to cost.
Table 3: CDC stream metrics (ClusterId and StreamId dimensions)
| Metric | Unit | Description |
| StreamDPU | DPU | DPUs consumed by the CDC stream (clusters with CDC enabled only) |
| BytesStreamed | Bytes | Total bytes streamed through the CDC pipeline, used for billing |
| PublishedBytes | Bytes | Bytes written to the target Amazon Kinesis Data Streams stream |
| IsImpaired | None | 1 when the stream is impaired, 0 when healthy |
Table 4 lists observability metrics that help you understand resource consumption patterns.
Table 4: Observability metrics
| Metric | Unit | Description |
| BytesRead | Bytes | Total bytes read from storage by transactions |
| BytesWritten | Bytes | Total bytes written to storage by transactions |
| ClusterStorageSize | Bytes | Current storage size of the cluster |
| ComputeTime | Milliseconds | Query processor compute time consumed |
| OccConflicts | None | Transactions aborted because of optimistic concurrency control (OCC) conflicts |
Important: When tracking costs, use the Sum statistic for DPU metrics. This gives you total consumption over a time period, which corresponds directly to your bill. To convert DPU counts to dollar estimates, use CloudWatch metric math:
Note: Replace the placeholder with your Region’s per-DPU rate. For example, $0.000008 per DPU corresponds to $8 per million DPUs in the US East (N. Virginia), us-east-1, and US East (Ohio), us-east-2, Regions. Rates vary by Region. Refer to the Aurora DSQL pricing page for the rate in your Region.
Viewing costs in the Aurora DSQL console
The Aurora DSQL console includes a built-in Usage and cost panel that displays your DPU consumption and estimated cost directly. No separate dashboard configuration is required. This panel is available from the cluster detail page on the AWS Management Console.
The panel displays total DPU consumption for the last 24 hours, 7 days, and 30 days, estimated cost in your Region, and cluster storage size (with the cost of that storage for 30 days). It does not break down by read, write, or compute DPUs. That level of detail is available in the CloudWatch metrics view.
The following screenshot shows the Usage and cost panel for an Aurora DSQL cluster on the console.
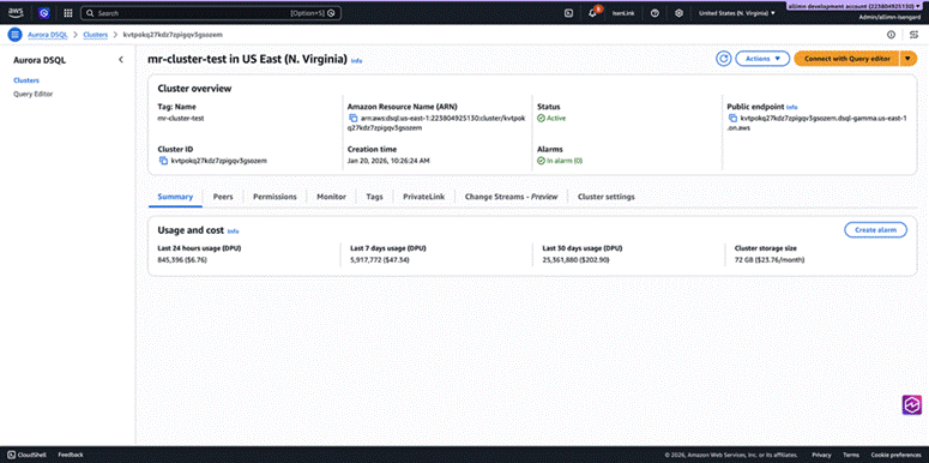
Figure 1: The Usage and cost panel on the Aurora DSQL console cluster Summary tab, showing last 24 hours, 7 days, and 30 days DPU usage with estimated cost, cluster storage size, and a Create alarm button
To access this panel, open the Aurora console, choose Clusters in the navigation pane, select your Aurora DSQL cluster, and then choose the Summary tab on the cluster detail page. By default, the panel shows DPU consumption and estimated cost for the last 24 hours, 7 days, and 30 days side by side.
For granular breakdowns by DPU component (read, write, compute, and multi-Region write), choose the Monitoring tab on the cluster detail page, which provides a detailed CloudWatch metrics view with per-component graphs and configurable time ranges.
For multi-Region clusters, you view each peered cluster from its own Region’s console: the Usage and cost panel for a given cluster shows the DPU consumption and estimated cost for that Region. By opening the panel for each peered Region, you can compare consumption across Regions and identify unexpected asymmetry in write replication costs.
Setting up CloudWatch alarms for cost alerts
With CloudWatch alarms, you can respond automatically when your Aurora DSQL hourly DPU usage approaches or exceeds a threshold that you define. Each alarm monitors a single metric and changes state based on its value relative to that threshold.
Alarm states use the following definitions:
- OK: The metric is within the defined threshold.
- ALARM: The metric has crossed the defined threshold.
- INSUFFICIENT_DATA: Not enough data points are available to determine the alarm state.
Three key settings control how alarms evaluate metrics:
- Period: The length of time over which to evaluate the metric (for example, 3,600 seconds for hourly evaluation).
- Evaluation periods: How many consecutive periods to evaluate.
- Datapoints to alarm: How many of those periods must breach the threshold to change the alarm state.
Note: CloudWatch alarms evaluate a metric over a fixed period. They do not track cumulative month-to-date spend, and there is no native 30-day alarm period. The alarm in this post is an hourly alarm: it watches the Sum of TotalDPU over each 1-hour period and enters the ALARM state when that single hour exceeds the hourly share of your budget. A spiky workload can therefore trigger the alarm in a given hour even if the full month stays under budget. For cumulative month-to-date tracking, pair this alarm with AWS Budgets (see Best practices). If you use CDC, note that Aurora DSQL publishes StreamDPU as a separate per-stream metric that uses the ClusterId and StreamId dimensions, whereas the TotalDPU metric in this alarm is cluster-level. To monitor streaming cost reliably, create a separate alarm on StreamDPU for each stream.
Step 1: Calculate your threshold
Because the alarm evaluates one hour at a time, the value that you enter is an hourly DPU threshold. Table 5 derives that hourly threshold from a monthly budget target. We divide the monthly DPU allowance evenly across the 730 hours in an average month (the convention the AWS Pricing Calculator uses) and then take 80% of that hourly share as an early-warning threshold.
Table 5: Example hourly alarm threshold calculations
| Monthly budget | Monthly DPU allowance | Hourly share (DPUs) | Hourly warning – 80% (DPUs) |
| $50 | 6,250,000 | ~8,562 | ~6,849 |
| $100 | 12,500,000 | ~17,123 | ~13,699 |
| $500 | 62,500,000 | ~85,616 | ~68,493 |
Note: The Hourly warning (80%) column is the value you set as the alarm threshold in the following steps. For example, ~13,699 corresponds to 80% of the hourly share of a $100/month budget.
Step 2: Create an Amazon SNS topic for notifications
Create an Amazon SNS topic and subscribe your team’s email address to receive alarm notifications:
Step 3a: Create the alarm from the Aurora DSQL console (recommended)
The fastest path is the Aurora DSQL console itself. On the cluster’s Summary tab, the Usage and cost panel includes a Create alarm action. Choosing it opens the CloudWatch alarm creation flow with the TotalDPU metric, the AWS/AuroraDSQL namespace, and your cluster’s ClusterId already prefilled. You then set the Sum statistic, a 1-hour period, and your hourly warning threshold from Table 5, and attach the SNS topic from Step 2. This recent console enhancement saves you from browsing the metric tree manually.
To build the alarm manually or script it, use the CloudWatch console or AWS CLI steps that follow.
Step 3b: Create the CloudWatch alarm (CloudWatch console)
To create the alarm manually using the CloudWatch console, complete the following steps:
- Open the CloudWatch console and choose Alarms, All alarms in the navigation pane.
- Choose Create alarm, and then choose Select metric.
- In the metrics browser, choose
AWS/AuroraDSQL, thenClusterId. Select your cluster and theTotalDPUmetric. - Under Specify metric and conditions, set Statistic to Sum, Period to 1 hour (3,600 seconds), and the threshold type to Static.
- For Whenever TotalDPU is, choose Greater than, and enter your calculated hourly warning threshold (for example, 13699 for a $100/month budget at an 80% warning).
- Set Evaluation periods to 1 and Datapoints to alarm to 1. Set Missing data treatment to Treat missing data as not breaching.
- Under Notification, select your SNS topic (
dsql-cost-alerts) to notify when the alarm enters the ALARM, OK, or INSUFFICIENT_DATA state. - Give the alarm a descriptive name such as
DSQL-Hourly-DPU-Budget-Warning, review the configuration, and choose Create alarm.
Step 3c: Create the CloudWatch alarm (AWS CLI)
Alternatively, create the same alarm using the AWS CLI:
This configuration supports the following:
- Email alerts to database administrators and finance teams.
- Automated AWS Lambda function triggers for cost remediation workflows.
- Integration with incident management systems through Amazon SNS subscriptions.
Consider the following best practices when configuring Aurora DSQL cost alarms:
- Set a warning alarm at 70% of budget and a critical alarm at 90%.
- Include OK actions to notify your team when costs return to normal.
- Use a Datapoints to alarm of 2 out of 3 evaluation periods to reduce false alarms from transient spikes. This approach is best suited to short evaluation periods such as 1 hour. For longer periods such as daily evaluations, a 1-of-1 configuration is typically more appropriate.
- For multi-Region clusters, create a separate alarm for each Region’s cluster so that you can attribute cost to the Region where it is incurred.
Deploying monitoring alarms with AWS CloudFormation
Deploying your alarm infrastructure as code promotes consistency, repeatability, and version control. AWS CloudFormation provides native resource types for the components: AWS::CloudWatch::Alarm and AWS::SNS::Topic.
CloudFormation template
Save the following template as dsql-cost-alarms.yaml. It creates an SNS topic for notifications and a CloudWatch alarm on the TotalDPU metric with a parameterized threshold:
Deploying the template
Deploy the CloudFormation stack using the AWS CLI:
Use !Ref to connect parameters to resource properties. For example, Threshold: !Ref AlarmThreshold and AlarmActions: [!Ref DSQLCostAlertTopic] let teams deploy the same template with different thresholds per environment.
Multi-Region deployment with StackSets
For organizations that run multi-Region Aurora DSQL clusters, with AWS CloudFormation StackSets you can deploy the monitoring stack consistently from a single template across multiple Regions. We recommend the following practices when organizing CloudFormation stacks for monitoring infrastructure:
- Separate monitoring infrastructure from application resources for independent lifecycle management.
- Use cross-stack references to share resource ARNs (such as SNS topic ARNs) between stacks.
- Parameterize thresholds so that you can update limits without redeploying the entire stack.
- Use CloudFormation modules to package the alarm configuration as a reusable module.
- Use AWS CloudFormation Guard for policy-as-code validation of your templates.
Best practices for Aurora DSQL cost management
- Monitor DPU trends over time. Use the Aurora DSQL console Usage and cost panel and CloudWatch to identify patterns in DPU consumption and correlate them with application events or deployments.
- Use graduated alerts. Set multiple alarm thresholds (warning at 70%, critical at 90%) rather than a single alarm at 100% of budget.
- Use the AWS Free Tier for development. The monthly Free Tier of 100,000 DPUs and 1 GiB of storage is ideal for development and testing environments.
- Analyze query costs with EXPLAIN ANALYZE VERBOSE. Run
EXPLAIN ANALYZE VERBOSEto see a statement-level DPU estimate and understand the costs associated with each operation. Use it directionally for tuning rather than as a billing-grade number, and rely on CloudWatch metrics or billing reports for authoritative cost data. - Pinpoint high-resource queries with Database Insights. Amazon CloudWatch Database Insights is automatically enabled for every Aurora DSQL cluster at no additional cost. It uses the DSQL Active Session History (DASH) metric,
db.active_sessions.avg, broken down by wait event and by SQL statement, so you can quickly identify the queries that consume the most resources and alert on load spikes. Use it to find costly queries fast, then confirm their cost impact with the DPU metrics andEXPLAIN ANALYZE VERBOSE. - Combine with AWS Budgets. Use AWS Budgets for cumulative month-to-date spend tracking alongside CloudWatch for hourly operational alerting. The hourly alarm in this post catches spikes quickly. AWS Budgets tracks month-to-date spend against your budget. Together, they cover both views.
Cleaning up
To avoid incurring future charges, remove the resources that you created in this walkthrough. Complete the following steps.
Delete the CloudWatch alarm:
Alternatively, delete the entire CloudFormation stack, which removes the alarm, SNS topic, and subscriptions:
Note: Deleting the CloudFormation stack also removes the Amazon SNS email subscriptions, so subscribers no longer receive notifications after deletion.
Conclusion
The unified Aurora DSQL DPU pricing model simplifies cost management, but proactive monitoring remains essential for budget governance. By using the built-in Usage and cost panel in the Aurora DSQL console and CloudWatch alarms, you gain comprehensive visibility into your Aurora DSQL costs for single-Region or multi-Region deployments.
In this post, you learned how to do the following:
- Understand how DPU metrics map directly to your bill and use the Sum statistic for accurate cost tracking.
- View DPU consumption and estimated cost in the Aurora DSQL console’s Usage and cost panel. No dashboard configuration is required.
- Configure CloudWatch alarms on the hourly DPU rate, with appropriate evaluation periods and SNS notifications, to alert your team when a single hour exceeds the hourly share of your budget.
- Deploy the entire alarm stack as infrastructure as code with CloudFormation, and use StackSets if you operate Aurora DSQL clusters across multiple Regions.
To get started, deploy the CloudFormation template against your Aurora DSQL clusters, customize the alarm thresholds for your budget, and explore the Aurora DSQL documentation for query optimization techniques that reduce DPU consumption. For organization-wide, month-to-date cost governance, consider AWS Budgets. Leave any questions in the comments section.
Additional resources
- Amazon Aurora DSQL pricing
- How billing works in Aurora DSQL
- Monitoring Aurora DSQL with Amazon CloudWatch
- Using Amazon CloudWatch alarms
- Working with AWS CloudFormation StackSets
- Using metric math with CloudWatch