AWS Database Blog
Understand memory management in Amazon RDS for PostgreSQL to avoid out of memory
When a PostgreSQL database runs out of memory, the Linux OOM killer terminates backend processes, causing a full database restart and disconnecting all active sessions. Even before OOM occurs, insufficient memory management leads to queries spilling to disk and swap exhaustion. These issues are difficult to diagnose in real time without knowing which tools to use and what signals to look for.
PostgreSQL memory issues from excessive disk spilling to Out Of Memory (OOM) triggered restarts are among the most common production incidents on Amazon Relational Database Service (Amazon RDS) for PostgreSQL and Amazon Aurora PostgreSQL. In this post, we show you how to identify memory-intensive queries, interpret the diagnostic signals across both engines, and take immediate action to prevent or recover from OOM events.
You will also learn how PostgreSQL allocates and consumes memory in Amazon RDS for PostgreSQL and Amazon Aurora PostgreSQL, and how to identify, diagnose, and resolve Out of Memory (OOM) issues using the monitoring and diagnostic tools available on both engines. How memory is allocated, distributed, and managed directly determines whether your PostgreSQL database operates efficiently or encounters failures, including being terminated by the OS Out of Memory (OOM) killer.
Prerequisites
Following along is optional, but if you want to reproduce the examples, you need:
- An Amazon RDS for PostgreSQL or Amazon Aurora PostgreSQL-Compatible Edition DB instance (version 14 or higher recommended for full feature availability)
- A database user with
rds_superuserprivileges. - Access to the AWS Management Console with Amazon CloudWatch and Enhanced Monitoring enabled on your DB instance.
- Advanced CloudWatch Database Insights enabled.
PostgreSQL memory configuration
PostgreSQL is a process-based database where every client connection to postgres spawns a new backend process dedicated to that connection. Every query that is parsed, planned, and executed (every row fetched, every index scanned, every sort and hash operation performed) relies on memory. PostgreSQL allocates memory across two broad regions. Shared memory is collectively accessed by all backend processes for caching data, tracking transactions, and managing the write-ahead log (WAL). Local memory is privately allocated to each backend process for operations like sorting, hashing, and maintaining temporary buffers. Beyond what PostgreSQL manages internally, the operating system’s memory, particularly the file system cache and page tables, plays an equally vital role in overall database performance. When this memory is well-tuned, queries execute efficiently, I/O is minimized, and the system remains stable. When it is not, the consequences range from degraded performance and excessive disk spilling to the OS OOM killer terminating PostgreSQL processes entirely. Understanding how PostgreSQL distributes, consumes, and interacts with memory at every layer is therefore not only a performance optimization exercise. It is fundamental to keeping your database available, stable, and predictable under any workload.
Shared memory
shared_buffers is the primary page cache of PostgreSQL. It holds copies of table and index data pages (8 KB each) in shared memory so that backends can read and write data without going to disk on every access. This memory is allocated once at startup and shared across all connections.
PostgreSQL uses two in-memory caches (double buffering): the shared_buffers cache and the OS page cache. When data isn’t in either cache, a physical disk read occurs. The effective_cache_size parameter helps the query planner estimate total available cache (shared_buffers plus OS cache) for cost calculations. It doesn’t allocate memory. Aurora PostgreSQL has no OS page cache because of its storage architecture.
On RDS for PostgreSQL, the default is approximately 25 percent of instance RAM, following the community recommendation to leave room for per-backend allocations and the OS file system cache. RDS uses a traditional architecture where PostgreSQL reads and writes data through a local file system backed by Amazon Elastic Block Store (Amazon EBS). The OS kernel maintains a page cache of recently accessed file system pages, and reserving memory for this cache significantly improves read performance by avoiding repeated Amazon EBS round-trips. On Aurora PostgreSQL, shared_buffers is approximately 75 percent of instance RAM because the Aurora storage architecture is fundamentally different: there’s no local data volume or file system layer on the database instance. The Aurora storage subsystem manages data pages directly over the network, so there is no OS page cache to benefit from. The memory that would otherwise be reserved for it can be allocated to shared_buffers instead.
You can check how effectively your shared_buffers is being used with the pg_buffercache extension:
Note that shared_buffers is the largest component of shared memory, but PostgreSQL also allocates several other shared memory areas at startup (WAL buffers, transaction status caches, lock tables, and more; see PostgreSQL memory structures). You can see the full breakdown using the pg_shmem_allocations system view (PostgreSQL 14+).
Local memory (per-backend)
Each client connection’s backend process allocates local memory independently. As connections increase, total local memory grows linearly, making max_connections a significant factor in overall memory usage.
At the OS level, each PostgreSQL backend is a regular Linux process with the standard memory regions: text (executable code, shared across processes), stack (function call frames), shared library mappings, and heap (dynamically allocated memory). The heap is where PostgreSQL does most of its per-backend work, and PostgreSQL manages heap memory through a hierarchy of MemoryContexts, named regions allocated for different purposes such as sorting, hashing, catalog caching, and expression evaluation.
A common misconception is that a backend’s local memory consumption is determined solely by work_mem. In reality, work_mem and maintenance_work_mem only govern memory limits for specific operations: sort nodes, hash joins, and maintenance commands like VACUUM and CREATE INDEX. Many other MemoryContexts (catalog caches, expression evaluation, parser/planner state, and so on) grow independently based on workload characteristics and are not bounded by any user-configurable parameter. You can inspect these contexts using the pg_log_backend_memory_contexts() function (RDS for PostgreSQL) and the aurora_stat_memctx_usage() function (Aurora PostgreSQL) as shown in the troubleshooting later in this post. These unbounded contexts rarely require intervention. They are managed internally by PostgreSQL and typically remain small relative to the sort and hash memory controlled by work_mem.
Amazon RDS for PostgreSQL provides pg_log_backend_memory_contexts(pid), which outputs memory context information to the PostgreSQL log. Note that this function writes to the log file rather than returning results directly, so there is a slight delay compared to the aurora_stat_memctx_usage() function on Aurora, which returns results as a queryable set in real time.
The key local memory parameters that you can control:
Query operations (sort, hash): Controlled by work_mem. This value applies to each individual query execution node, not the query as a whole (see PostgreSQL documentation for work_mem). A single query with multiple Sort or Hash nodes consumes work_mem independently for each node. For hash-based operations, the limit is work_mem x hash_mem_multiplier.
Parallel queries: When the planner chooses a parallel plan, max_parallel_workers_per_gather worker processes are launched, each consuming its own work_mem. With 4 parallel workers, a single sort node can use up to 5x work_mem (1 leader plus 4 workers). max_parallel_workers limits the total parallel workers system-wide.
Maintenance operations (VACUUM, CREATE INDEX, and so on): Controlled by maintenance_work_mem. For parallel CREATE INDEX or parallel VACUUM, max_parallel_maintenance_workers controls the number of workers. Unlike parallel queries where each worker gets its own full work_mem, parallel utility commands treat maintenance_work_mem as a limit applied to the entire command regardless of the number of parallel workers. The total is shared, not multiplied. For parallel CREATE INDEX, workers share the sort memory. For parallel VACUUM, the leader collects dead tuple IDs within the maintenance_work_mem limit while workers process index cleanup.
Temporary tables: Controlled by temp_buffers. Session-local buffers for accessing temporary tables. Memory is allocated on demand, so sessions that never use temporary tables do not consume this memory.
Autovacuum workers: Each autovacuum worker’s memory is controlled by autovacuum_work_mem (falls back to maintenance_work_mem when set to -1). Up to autovacuum_max_workers workers run in parallel, so total memory consumption can be autovacuum_work_mem x autovacuum_max_workers.
WAL sender processes (logical replication): When using logical replication, each replication connection uses logical_decoding_work_mem to buffer decoded changes before writing to disk. This can safely be set higher than work_mem. If you aren’t using logical replication, this parameter has no effect on memory consumption.
The impact of max_connections and idle backends: Every backend process, even an idle one, consumes baseline memory: the cost of a Linux process itself, plus PostgreSQL heap allocations such as catalog caches (CacheMemoryContext) that grow as the session accesses more objects. Idle backends don’t consume work_mem (no active sort or hash operations), and individually this overhead is modest. On a db.r7g.large instance, idle backends typically show 10 to 40 MB of Resident Set Size (RES) each. However, in environments with hundreds or thousands of mostly idle connections, the aggregate baseline reduces the memory headroom available for active queries. This is one reason why we recommend connection pooling with Amazon RDS Proxy. It keeps the actual backend count low and predictable, reducing the risk of OOM from sudden connection surges.
Note: None of these parameters pre-allocate memory at connection time. Memory is allocated on demand only when the corresponding operation is actually performed. A backend that never executes a sort does not consume work_mem, and a session that never accesses temporary tables doesn’t consume temp_buffers.
Understanding Resident Set Size (RES) in Enhanced Monitoring
Enhanced Monitoring shows Resident Set Size (RES) per process. This primarily reflects the physical memory attributed to each backend by the OS, though some portion (such as shared library pages) may be physically shared across processes. Both RDS for PostgreSQL and Aurora PostgreSQL have huge pages enabled by default (except micro, small, and medium instances on RDS, and t3 and t4g small instances on Aurora). When huge pages are enabled, shared_buffers is allocated using 2 MB pages and is not included in RES. This means a backend with noticeably higher RES than others (for example, hundreds of megabytes when others are in the tens of megabytes) is likely executing a memory-intensive query consuming large amounts of work_mem.
On instance classes where huge pages are not supported (such as db.t3.medium and db.t4g.medium on Aurora PostgreSQL), shared memory pages are charged to the backend process that first accesses them rather than to the postmaster. This can cause individual backends’ RES to appear unexpectedly high or uneven. This doesn’t indicate a memory leak, but rather how the OS accounts for shared memory without huge pages.
A large VIRT (Virtual Memory Size) value does not indicate a memory problem. It includes shared memory mappings and regions not yet backed by physical memory. Focus on RES for actual memory consumption.
OOM troubleshooting
When local memory is not well managed, the consequences can range from degraded performance because of excessive disk spilling to the most severe outcome, the OS OOM killer terminating PostgreSQL processes and causing a database restart. In this section, we walk through how to identify memory-intensive queries, demonstrate an actual OOM scenario, and show how the built-in memory management of Aurora PostgreSQL can help prevent it.
Identifying memory pressure
Several signals surface memory pressure before and during an incident. Start with the CloudWatch metrics for a high-level view, then drill into query-level detail with Database Insights and the PostgreSQL logs.
Amazon CloudWatch metrics: FreeableMemory and SwapUsage
The first indicators of memory pressure are the CloudWatch metrics FreeableMemory (available RAM) and SwapUsage. When memory-intensive queries consume large amounts of work_mem, FreeableMemory drops. However, a drop in FreeableMemory alone isn’t necessarily a problem. If there is no application-level performance degradation, it may be safe to observe without taking action. PostgreSQL and the OS naturally use available memory for caching, so low FreeableMemory can be normal during steady-state operation. That said, a rapid decline in FreeableMemory combined with increasing SwapUsage may indicate the instance is approaching OOM and may require investigation. We recommend setting a CloudWatch alarm when FreeableMemory drops below 10 percent of total instance memory as a starting point. You may need to adjust this threshold based on your workload characteristics and tolerance for memory pressure.
We demonstrated this on Aurora PostgreSQL 17.4 (db.r7g.large, 16 GB). We ran 10 concurrent sessions with work_mem = 512 MB, each sorting 20 million generated rows. The following CloudWatch graph shows the result. FreeableMemory (blue) plummeted from approximately 4 GB to under 200 MB within one minute of the queries starting, while SwapUsage (orange) simultaneously surged from 0 to over 6 GB. After the queries completed, both metrics recovered to baseline within two minutes. All sessions completed successfully without OOM in this case, but the instance was in a dangerously low memory state during execution.

Figure 1: FreeableMemory and SwapUsage during 10 concurrent memory-intensive sessions
CloudWatch Database Insights
CloudWatch Database Insights (DBI) advanced mode is a generally available feature for both Amazon RDS for PostgreSQL and Amazon Aurora PostgreSQL. DBI extends Performance Insights by providing deeper query-level analysis, including SQL plan inspection, OS-level process views, and application-layer tracing, which you can use to diagnose memory-intensive workloads directly from the AWS console.
On Aurora PostgreSQL, DBI adds a capability: you can view SQL execution plans directly within the DBI console without running EXPLAIN manually on the database.
The Top SQL tab in DBI ranks queries by resource consumption metrics. When investigating memory pressure, focus on:
- Temp files created / Temp bytes written – Queries that generate temporary files have exceeded their allocated
work_mem(orwork_memxhash_mem_multiplierfor hash operations) and spilled intermediate results to disk. These are your primary suspects. - Rows examined compared to rows returned – A large ratio suggests the query is processing significantly more data than it returns, which often correlates with large hash tables or sort operations in memory.
- Shared blocks hit/read – High values can indicate large sequential scans feeding into hash join build phases, which consume
work_memproportionally to the data volume. Sort the Top SQL view by Temp bytes written (descending) to surface the queries most likely driving memory pressure.
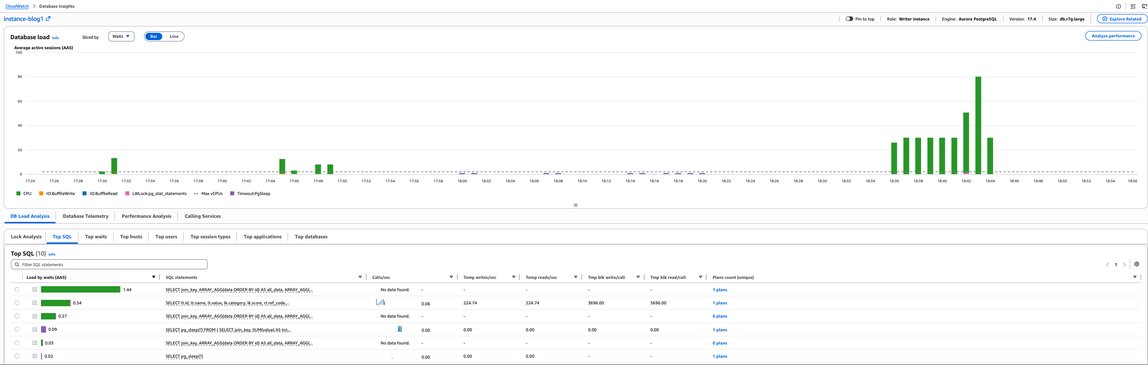
Figure 2: DBI Top SQL ranked by resource consumption
SQL Plan Viewer (Aurora PostgreSQL): On Aurora, choose a query in Top SQL to open the built-in SQL Plan viewer. This shows the plan tree with node types (Hash Join, Sort, Seq Scan, Gather), estimated rows, and cost estimates, giving you immediate visibility into the query’s structure and potential memory consumers.
What DBI shows and what it doesn’t: By default, the DBI plan viewer captures plans using EXPLAIN (with costs), not EXPLAIN ANALYZE. This means:
| DBI Plan Shows | DBI Plan Does NOT Show (by default) | |
| 1 | Plan node types (Hash Join, Sort, Gather, Seq Scan) | Batches count (spill indicator) |
| 2 | Estimated row counts per node | Actual Memory Usage per hash node |
| 3 | Join strategies and conditions | Sort Method (quicksort vs external merge) |
| 4 | Parallel worker count (Workers Planned) | Actual execution time per node |
This is because the parameter aurora_stat_plans.with_analyze defaults to off. When set to on, Aurora captures the plan with EXPLAIN ANALYZE on the first execution of each new plan, which would include runtime statistics like Batches and Memory Usage. However, this adds execution overhead and is only captured once per plan. See the Aurora PostgreSQL query plan monitoring documentation for details.
- DBI SQL Plan – Identify the query and count memory-consuming nodes (Hash Joins, Sorts, Gather nodes). This tells you the structure and lets you estimate the theoretical memory budget.
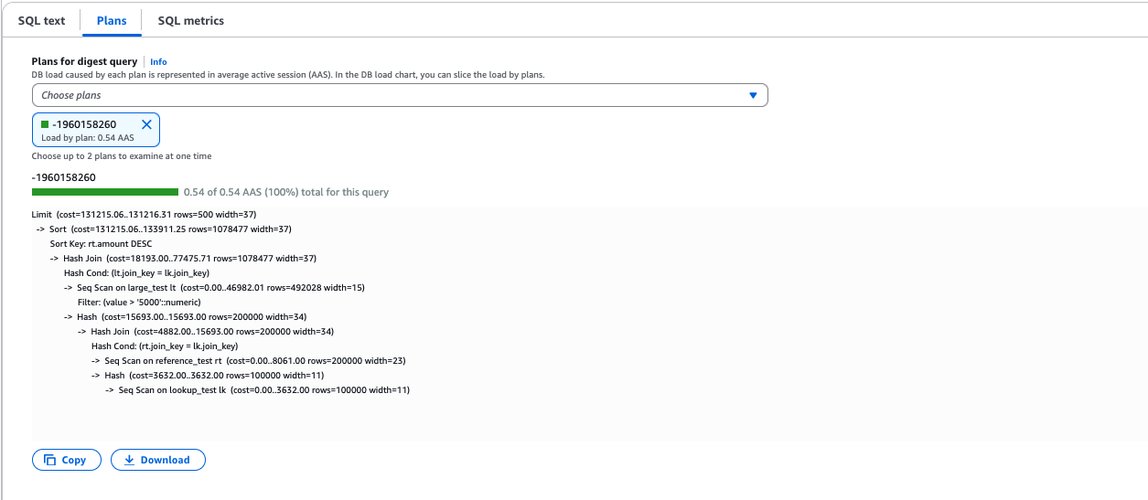
Figure 3: DBI SQL Plan viewer for a memory-intensive query
- EXPLAIN (ANALYZE, BUFFERS) in psql – Run the suspect query manually to confirm actual spill behavior (
Batches> 1), realMemory Usage, and sort method.
Estimating work_mem usage from the plan
Each Hash Join or Hash Aggregate node independently allocates up to work_mem x hash_mem_multiplier. Each Sort node allocates up to work_mem. Count the memory-consuming nodes in the plan:
For a query with 2 Hash Join nodes at work_mem = 4MB and hash_mem_multiplier = 2.0:
When the actual hash table data exceeds this budget, Batches > 1 appears on the Hash node, indicating the hash table spilled to temporary files on disk. Parallel workers multiply memory consumption. If the plan shows a Gather or Gather Merge node with Workers Planned: N, each parallel worker gets its own work_mem allocation per plan node:
LIMIT and the top-N heapsort optimization. When a LIMIT clause is present with ORDER BY, PostgreSQL uses a bounded top-N heapsort, maintaining only the top-N rows in a small in-memory heap. This means the Sort node consumes minimal memory regardless of the result set size. Note that the optimizer uses bounded heapsort only when the LIMIT is sufficiently small relative to total rows. For very large LIMIT values, it might still perform a full sort. Without LIMIT, the full result must be sorted, and if it exceeds work_mem, the sort spills to disk with Sort Method: external merge Disk. The key signal: temp_files > 0 in a query’s DBI metrics means that query ran out of allocated memory and spilled to disk. Cross-reference the number of hash and sort nodes in the plan with your current work_mem and hash_mem_multiplier settings to determine whether a session-level work_mem increase or a query optimization is the better fix.
OS Processes view: DBI provides an OS Processes view that surfaces operating system-level process information. During a memory pressure event, this shows which PostgreSQL backends have elevated memory consumption, complementing the Enhanced Monitoring process list within the same console where you’re already analyzing queries.
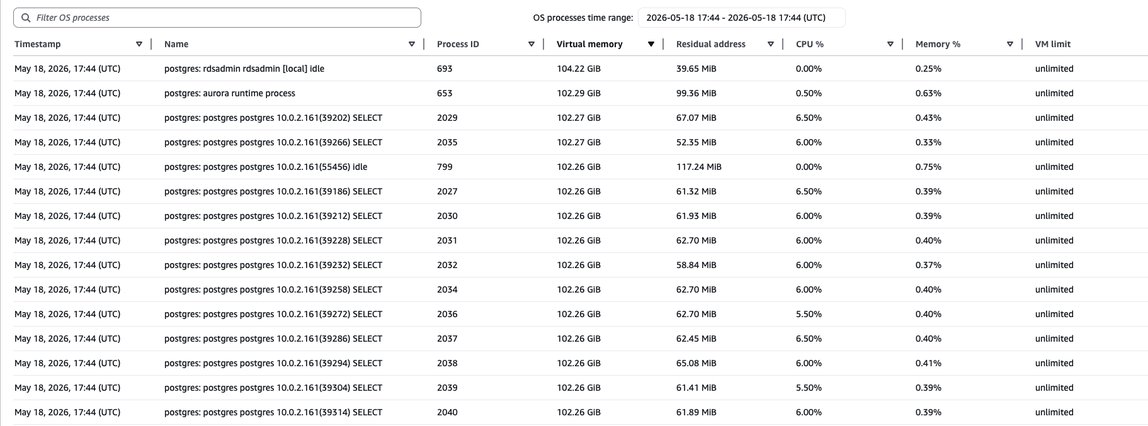
Figure 4: DBI OS Processes view during memory pressure
RDS for PostgreSQL DB logs
The PostgreSQL error log is one of the most direct sources of evidence when diagnosing OOM events. Although DBI helps detect memory pressure in real time, the DB logs tell you what already happened.
Temp file logging: the work_mem exceeded indicator. With log_temp_files = 0 set in the parameter group, every temporary file creation is logged. When a hash join’s hash table exceeds work_mem x hash_mem_multiplier, or a sort exceeds work_mem, PostgreSQL writes the overflow to temporary files. Each temp file creation generates a log entry with the file path, size, and the full query text. During concurrent workloads, you see multiple backends spilling simultaneously, each identified by a unique PID, so you can correlate with pg_stat_activity and Enhanced Monitoring.
The following log excerpt shows multiple LOG: temporary file: entries for concurrent PIDs spilling at the same timestamp, with STATEMENT lines showing the culprit query.
From the preceding output, you can draw three conclusions. Multiple PIDs at the same timestamp confirm that concurrent sessions are all exceeding their work_mem budgets simultaneously (aggregate memory pressure). Temp file sizes tell you how much data overflowed beyond the hash budget. The STATEMENT: line identifies the exact query without needing to cross-reference pg_stat_activity.
Memory context inspection
When a backend is consuming more memory than expected, you need to see where inside that process the memory is going. PostgreSQL organizes per-backend memory into a hierarchy of memory contexts, named Regions that track allocated bytes, used bytes, and instance count.
On Aurora PostgreSQL, aurora_stat_memctx_usage() provides the same memory context breakdown as a queryable SQL result set, with no log parsing required, and it is accessible to the primary user.
Inspecting a specific backend:
| Context | What It Means | |
| 1 | ExprContext (large allocated) | Expression evaluation context that holds ARRAY_AGG accumulated arrays, function results, and per-row computations. Dominant consumer when aggregation functions build large in-memory results. |
| 2 | CacheMemoryContext | System catalog cache – table definitions, index metadata. Persists for the backend’s lifetime and grows as more objects are accessed. |
| 3 | ExecutorState | The executor’s plan tree and node state structures. Relatively small – the heavy data lives in ExprContext and hash contexts. |
| 4 | Miscellaneous | Internal bookkeeping, hash table overhead, and other allocations. |
| 5 | TupleSort | Memory consumed by sort operations. |
| 6 | HashBatchContext | Memory consumed by hash join or hash aggregate hash tables (when present). |
Broad overview across all backends
This gives you a ranked list of backends by total memory consumption, a quick way to find the memory culprit during an incident.
Per-process memory: Enhanced Monitoring process list
Enhanced Monitoring’s process list shows per-process RES and VIRT. As explained earlier, with huge pages enabled, RES excludes shared_buffers and primarily reflects each backend’s local memory consumption. On Aurora, every backend shows a large VIRT (for example, 102 GB on this db.r7g.large instance) because shared_buffers is mapped into each process’s address space. This is shared, not duplicated in physical RAM. The exact VIRT value varies by instance class and shared_buffers size. Sort by RES descending to spot memory-heavy backends. In the following screenshot, backends show RES ranging from approximately 50–120 MB, while platform processes (rdsadmin, Aurora runtime) show 40–100 MB. A backend with RES significantly higher than this baseline is likely running a memory-intensive query. Cross-reference its PID with pg_stat_activity to identify the culprit.
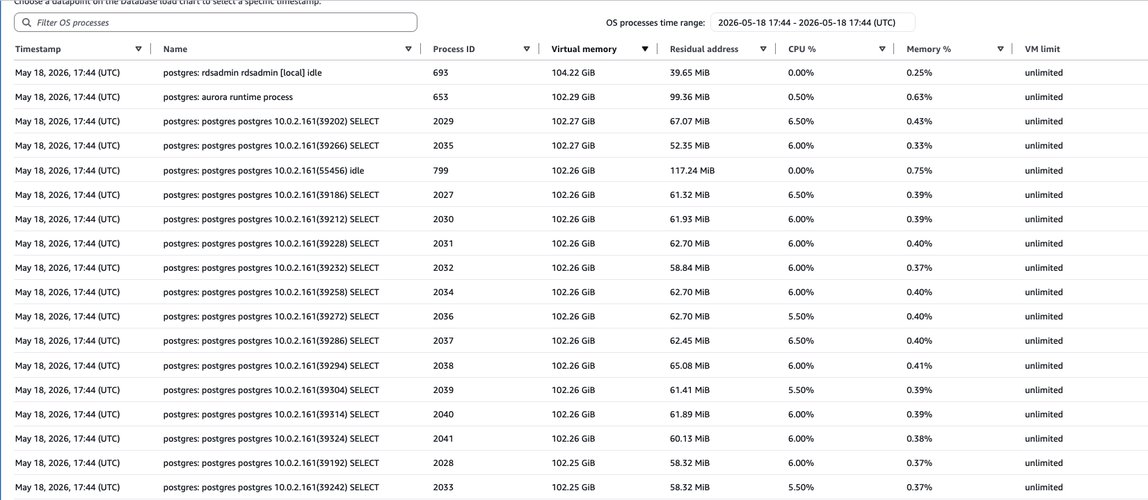
Figure 5: Enhanced Monitoring process list
Note: Platform processes (rdsadmin, Aurora runtime) maintain a steady 26-105 MB, which is normal operational overhead.
Aurora peak memory: aurora_stat_plans() and aurora_stat_activity()
Aurora PostgreSQL provides aurora_stat_plans() and aurora_stat_activity() to track peak memory usage during query planning and execution phases.
Prerequisite: aurora_compute_plan_id = on must be set in the DB parameter group. To verify, run SHOW aurora_compute_plan_id;.
Peak memory per query with aurora_stat_plans():
| Column | What It Means |
| max_plan_peakmem | Highest memory consumed during planning. Non-zero on queries with many joins, partitions, or CTEs. |
| max_exec_peakmem | Highest memory consumed during execution – hash tables, sort buffers, aggregation state at their peak. Primary driver of OOM risk. |
| temp_blks_written | Non-zero = query spilled to disk (safety valve). Zero + high max_exec_peakmem = memory held in RAM (OOM risk). |
| calls | Multiply max_exec_peakmem x concurrent_calls to estimate aggregate memory pressure. |
Classifying queries: plan-heavy or execution-heavy
| Profile | Meaning | Tuning Action |
| Plan-heavy | Query structure is complex (many joins, partitions, CTEs) | Simplify the query, reduce partition count, or break into smaller steps |
| Execution-heavy | Query processes large data volumes at runtime | Tune work_mem / hash_mem_multiplier at session level, add indexes, optimize joins |
| Balanced | Both planning and execution are memory-intensive | Restructure the schema or materialize intermediate results |
Correlating active queries with historical peak memory
During a live incident, correlate currently active backends with their historical memory profile:
This tells you: “The query currently running on PID X has historically consumed up to Y MB of peak execution memory,” which helps you decide which active backend to cancel first during memory pressure.
For more details on Aurora query plan monitoring, see the Aurora PostgreSQL Monitoring Query Plans documentation.
Reproducing an OOM scenario
To demonstrate what happens when memory pressure exceeds the system’s capacity, we ran 15 concurrent sessions with work_mem = 1 GB sorting 30 million rows on Aurora PostgreSQL 17.4 (db.r7g.large, 16 GB). Physical memory was exhausted, swap surged to over 7 GB, and the OOM killer terminated PostgreSQL processes, causing a full database restart.
OOM detection (signal 9: Killed). When the Linux OOM killer terminates a PostgreSQL backend, the postmaster logs a specific sequence:
The key indicator is “was terminated by signal 9: Killed”. Signal 9 (SIGKILL) is sent by the Linux OOM killer when the system runs out of available memory. The postmaster then terminates all other backends to protect shared memory integrity, and the database enters crash recovery. On Aurora, the engine auto-restarts within 1–2 minutes.
During the same time, RDS Events shows you the DB restart event:

Figure 6: RDS Events showing the database restart
Preventing OOM with rds.enable_memory_management
Aurora PostgreSQL includes rds.enable_memory_management (enabled by default) which is designed to monitor memory pressure and cancel transactions that are requesting memory allocations before the OOM killer is invoked. When critical memory pressure is detected, the offending transaction receives:
The transaction is canceled, but the database remains available. Essential background processes (autovacuum) are always protected. As shown in the preceding OOM scenario, without this feature (rds.enable_memory_management = off), excessive memory consumption leads to the OOM killer terminating PostgreSQL processes and a full database restart. With this feature enabled (the default), Aurora PostgreSQL can detect memory pressure and cancel the offending transactions before the situation becomes unrecoverable, keeping the database available for other connections.
This feature is most effective when memory consumption increases gradually (such as real-table queries with I/O). For workloads that allocate large amounts of memory instantaneously across many concurrent sessions, the cancellation might not trigger in time to prevent OOM.
Taking immediate action
When you identify a memory-intensive query:
1. Set work_mem at session/transaction level
Rather than increasing work_mem globally, scope it to specific operations:
SET LOCAL is preferred to limit scope to a single transaction.
2. Cancel or terminate the query
3. Tune the query
- Add appropriate indexes to avoid full table sorts.
- Use more selective
WHEREclauses to reduce data volume. - Review
max_parallel_workers_per_gather. Each parallel worker uses its ownwork_mem. - Consider
LIMITclauses to enable top-N heapsort optimization.
4. Use connection pooling to stabilize backend connections
Because local memory consumption scales linearly with the number of backend connections, reducing and stabilizing the connection count directly reduces the memory baseline. Connection poolers like Amazon RDS Proxy and PgBouncer pool and reuse database connections, keeping the number of active backends predictable. This makes total local memory consumption more stable and easier to capacity-plan, reducing the risk of unexpected memory spikes from connection surges.
Considerations and limitations
rds.enable_memory_managementis Aurora-only. RDS for PostgreSQL doesn’t have an equivalent built-in OOM prevention mechanism. On RDS, you must rely on proactive monitoring andwork_memtuning.aurora_stat_memctx_usage()andaurora_stat_plans()are Aurora-only. On RDS for PostgreSQL, usepg_log_backend_memory_contexts()(output goes to PostgreSQL logs, not a queryable result set).- The OOM prevention feature has timing limitations. It’s most effective when memory consumption increases gradually. For workloads that allocate large amounts of memory instantaneously across many concurrent sessions, the cancellation may not trigger in time.
- Enhanced Monitoring RES interpretation varies by instance class. On instance classes without huge page support (db.t3.medium, db.t4g.medium on Aurora),
shared_bufferspages are charged to individual backends, making RES appear uneven. This doesn’t indicate a memory leak. - CloudWatch FreeableMemory is not a direct OOM predictor. Low FreeableMemory alone may be normal. Investigate only when combined with rising SwapUsage or application-level performance degradation.
Summary
The following table compares key memory management features across both engines:
| Feature | RDS for PostgreSQL | Aurora PostgreSQL | |
| 1 | shared_buffers default | ~25% of RAM | ~75% of RAM |
| 2 | File system cache | Yes (OS page cache) | No (storage layer handles I/O) |
| 3 | rds.enable_memory_management | Not available | Available (default: on) |
| 4 | Memory context inspection | pg_log_backend_memory_contexts() (log output) | aurora_stat_memctx_usage() (real-time query) |
| 5 | Peak memory tracking | Not available | aurora_stat_plans() / aurora_stat_activity() |
| 6 | SQL Plan in DBI | Not available | Available |
Conclusion
In this post, you learned how PostgreSQL manages memory across both the shared memory layer (primarily shared_buffers) and the per-backend local memory controlled by work_mem, maintenance_work_mem, and related parameters. You also learned how to identify memory-intensive queries, reproduce an OOM scenario, and use the diagnostic tools available on Amazon RDS for PostgreSQL and Aurora PostgreSQL.
To prevent and diagnose memory issues:
- Monitor FreeableMemory and SwapUsage with CloudWatch alarms (alert below 10 percent of total RAM).
- Identify memory-intensive queries using DBI Top SQL,
aurora_stat_memctx_usage(), andlog_temp_files= 0. - Analyze query plans to count memory-consuming nodes and estimate total memory budget.
- Protect with
rds.enable_memory_management(Aurora, enabled by default). - Tune
work_memat the session level for heavy queries rather than increasing the global default.
For more details, see Improved memory management in Aurora PostgreSQL and Aurora PostgreSQL query plan monitoring.