Desktop and Application Streaming
Ingest and visualize Amazon AppStream 2.0 usage reports in Amazon OpenSearch Service
Amazon AppStream 2.0 provides detailed usage reports that are generated daily and delivered to an Amazon S3 bucket. These reports include information including user ID, session duration, and client IP address. For a complete list of the report fields, review AppStream 2.0 usage report fields.
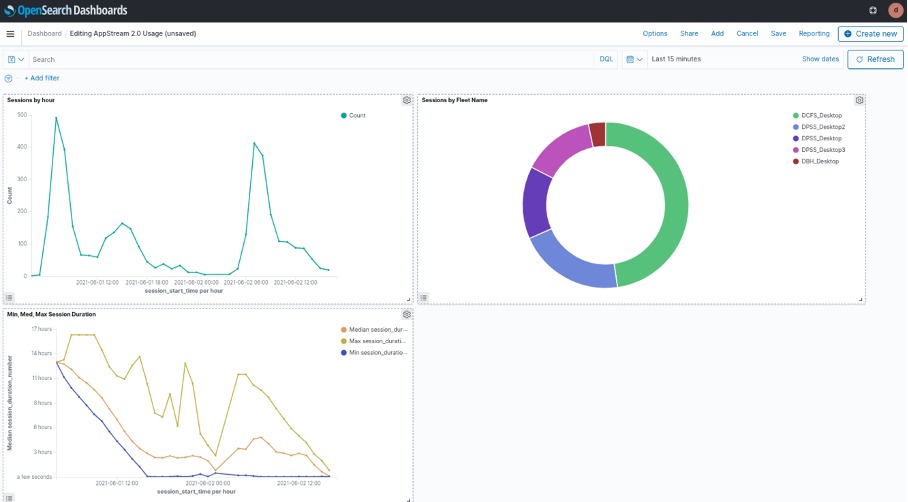
AppStream 2.0 provides usage reports in CSV format. You can ingest this data into your Amazon OpenSearch Service domain for visualization. Using OpenSearch dashboards to visualize this data allows AppStream 2.0 administrators to answer questions like, “How long are my user sessions on average?”, “At what time of day are my users most active on AppStream 2.0?”, and “Which of my fleets are most used and which are least used?”
In this blog, we’ll provide automation to deploy the pipeline that allows you to ingest AppStream 2.0 usage reports into OpenSearch Service. We’ll provide a sample dashboard that you can import into OpenSearch Dashboards to visualize your usage reports. Finally, we’ll describe how you can enrich usage reports with external datasets for richer analytics.

Figure 1: OpenSearch Dashboard we’ll configure in this blog to visualize AppStream 2.0 usage report data.
Solution overview
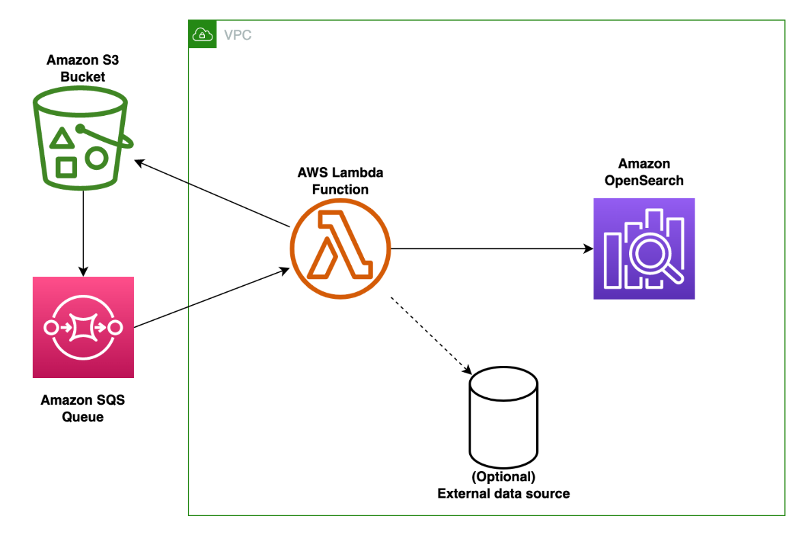
The solution can be deployed in your environment using the provided AWS CloudFormation template available from our Amazon S3 bucket and the AWS Lambda function available from the same S3 bucket. During the stack creation process, the following resources are created (review figure 2 for a description of the components):

Figure 2: Architectural diagram of the solution described in this blog. The major components are an Amazon S3 bucket, Amazon SQS Queue, AWS Lambda function, and Amazon OpenSearch Service cluster.
- Your Amazon S3 bucket that receives daily AppStream 2.0 usage reports. To enable usage reports review enable AppStream 2.0 usage reports in the Amazon AppStream 2.0 Administration Guide.
- An Amazon SQS queue that is a destination for S3 Event Notifications. When AppStream 2.0 exports a daily usage report as an object to S3, this SQS queue will receive an event notification.
- An AWS Lambda function that receives an Amazon SQS event message as input and processes it. In this case, the event message contains the S3 bucket name and prefix for the AppStream 2.0 usage report. The Lambda function then retrieves the usage report from the S3 bucket.
- Optionally, the Lambda function can access additional external datasets to enrich the usage report data.
- Your Amazon OpenSearch Service cluster receives usage report data from the Lambda function. Users are able to access visualizations in OpenSearch Dashboards to gain better insight into usage of AppStream 2.0.
Prerequisites and assumptions
To deploy the solution described in this blog, you need the following:
- An AWS account
- An AWS Identity and Access Management (AWS IAM) role with sufficient permission to create the following resources:
- CloudFormation stacks
- Amazon S3 buckets
- Amazon SQS queues
- AWS Lambda functions
- Security groups
- IAM policies and roles
- A Virtual Private Cloud (VPC) with at least two private subnets and network access to your Amazon S3 bucket, Amazon SQS and your OpenSearch Service cluster. If you need assistance with creating the networking environment for this blog, you can leverage the VPC quick start to build a VPC with private subnets that have outbound connectivity to the internet and S3.
- You have already created an Amazon S3 bucket that receives daily usage reports from AppStream 2.0. It’s recommended that this S3 bucket should have encryption enabled, be private, and block public access.
- You have an existing OpenSearch Service cluster with network connectivity from your VPC. Your OpenSearch resource policy must allow connections from your VPC.
Deployment steps
- Download the ingestion Lambda function and place it into a directory on your local machine.
- Create a deployment package for the Lambda function by running the following commands in a bash terminal. Run these commands inside the directory where index.py is located:
-
mkdir lambda_package
cp index.py lambda_package
pip3 install boto3 -t lambda_package
pip3 install requests -t lambda_package
pip3 install requests-aws4auth -t lambda_package
# zip the contents of project directory. This is your deployment package
cd lambda_package
zip -r deployment.zip .
-
- Take the resulting .zip file (named “deployment.zip” in the commands above) and upload it into an S3 bucket in your AWS account. Write down the name of your S3 bucket, as you’ll need it in a later step.
- Download the CloudFormation template onto your local machine.
- Visit the AWS CloudFormation console in the Region of your choice.
- Choose Create stack and then choose With new resources (standard).
- On the Create stack page, select Upload a template and then select the CloudFormation template cloudformation.yaml.
- Enter values for the following parameters. For this guide, it’s recommended that you keep the defaults for all other parameters.
- Stack Name: The name of this stack (e.g. AppStream-OpenSearch-Ingestion)
- LambdaArchiveBucketName: An S3 bucket in your account where you placed the Lambda function archive (deployment.zip) file.
- LambdaArchiveKeyName: The name of the zip file containing the Lambda code that you uploaded to the S3 bucket specified in LambdaArchiveBucketName.
- AppStreamUsageReportsBucketName: An existing S3 bucket that receives AppStream 2.0 usage reports.
- OpenSearchVPCEndpoint: The endpoint of your OpenSearch Service VPC domain. Exclude https:// and trailing slashes. The endpoint can be found in the OpenSearch Service console.
- OpenSearchDomainName: The name of your OpenSearch Service domain.
- LambdaVPC: The VPC ID where your OpenSearch Service cluster is hosted – this is also where the Lambda function will be deployed.
- LambdaSubnets: The subnet(s) where you’d like your Lambda function to be deployed. There must be connectivity from these subnets to the OpenSearch endpoint provided above and to S3. You can pass a single subnet ID or a comma-separated list to this parameter.
- Choose Next on the Configure stack options page.
- Select I acknowledge that AWS CloudFormation might create IAM resources.
- Choose Create stack – The stack deploys in approximately 5 minutes.
- In the CloudFormation console, wait for the stack to have a status of CREATE_COMPLETE. Then, select your stack and the Output tab. Copy the values for these keys, as we’ll need them in subsequent steps:
- LambdaIAMRoleArn: This is the IAM role that Lambda uses to run within your VPC and access S3, SQS and OpenSearch Service.
- LambdaSecurityGroupID: This is the ID of the security group that is created for your Lambda function.
- We need to map the Lambda role in your OpenSearch Service domain, so that Lambda function has permission to write usage report data into OpenSearch Service. Go to the OpenSearch dashboard URL. You can find it in the OpenSearch Service console after you’ve selected your domain:

Figure 3: To access OpenSearch Dashboards, select the OpenSearch Dashboards URL field in the OpenSearch Service console
- Log in to your domain and select Security under OpenSearch Plugins in the navigation pane.
- Select Roles. Then choose Create role. Note: We create a new role in this blog, but you may also use an existing role with appropriate permissions.
- On the Create role form, name the role app_stream_blog_access.
- Under Cluster permissions, select the create_index, and write permission groups. This gives the role the ability to create a new index and write to it.
- Under Index permissions, enter appstream-usage-report-* for Index. This grants the role access to all indices prefixed with “appstream-usage-report.” Leave the rest of the fields with defaults values. See Figure 4.
-

Figure 4: The role should have Cluster permissions of “create_index” and “write” and Index permissions for the index “appstream-usage-report-*”.
-
- Choose Create to finish creating the role.
- Select the Mapped user tab, and choose Manage mapping.
- Select Add another backend role and enter the Lambda IAM role ARN from step 12.
- Choose Map. You have now added the necessary permissions.
- Finally, edit the inbound rules of the security group associated with your OpenSearch Service domain so that the security group associated with your Lambda function has inbound HTTPS access. You can find the OpenSearch Service domain security group by visiting the OpenSearch Service console, selecting your domain and then choosing the Cluster configuration tab:

- Add an inbound rule to this security group that allows inbound access for HTTPS traffic. Enter LambdaSecurityGroupID copied from step 12 into the source field.
- After approximately 24 hours, AppStream 2.0 should write new usage reports into your S3 bucket. If the ingestion pipeline is working correctly, new indices will be created in your OpenSearch Service cluster with the format appstream-usage-report-dd-MM-yyyy
- Optionally, you can modify the Lambda function to call external data sources to enrich your usage report data. For example, you could query a Maxmind GeoIP database hosted on Amazon RDS to convert client IP addresses in usage reports into locations. This can help you determine the approximate physical locations of your end users.
Visualizing usage reports in OpenSearch Dashboard
After the ingestion pipeline is deployed, you can set up visualization of your data in OpenSearch Dashboard. We’ve provided a simple OpenSearch Dashboard with this solution to help you get started. Here are the steps to import it into your OpenSearch Service domain:
- Download the *.ndjson example file. A .ndjson file is an OpenSearch-specific file format that enables users to import and export configuration information including dashboards, custom fields, and index settings.
- Log in to OpenSearch Dashboards for your domain.
- Choose Stack Management from the main navigation under Management.
- Then choose Saved Objects.
- On the Saved Objects page, choose Import.
- Follow the prompt to upload the sample ndjson file you downloaded in step 1.
- After the upload finishes, the AppStream 2.0 Usage dashboard will be under OpenSearch Dashboards in the main navigation.
Manage data lifecycle in OpenSearch Service using Index State Management (ISM) policies
As usage reports accumulate in your OpenSearch Service cluster over time, you should lifecycle your data from hot storage into lower-cost storage tiers like UltraWarm and cold. You can use Index Statement Management (ISM) policies to automate the movement of your indices into different storage tiers.
Clean up
To clean up resources created in this blog:
- Delete dashboards created in OpenSearch Dashboards.
- Delete indices created in OpenSearch Service.
- Remove role mappings/permissions you configured in OpenSearch Service to allow Lambda to write data into the cluster.
- Delete the CloudFormation stack you deployed.
Conclusion
In this blog, we provided automation that deploys an ingestion pipeline for AppStream 2.0 usage reports into OpenSearch Service. We provided instructions for building visualizations to better understand your usage data in OpenSearch Dashboards.
If you’d prefer to query and visualize your usage reports using Amazon Athena and Amazon QuickSight, analyze your Amazon AppStream 2.0 usage reports using Amazon Athena and Amazon QuickSight.