AWS for Industries
How Toyota Powers Manufacturing Excellence and Data-Driven Quality Insights
Background
Toyota Motor North America (TMNA) is on a multi-year manufacturing digital transformation journey to support vehicle electrification, enhance customer experience, empower an agile digital workforce, and seamlessly integrate advanced digital technologies. This initiative aligns with Toyota’s relentless pursuit of continuous improvement and quality while evolving into a modern, agile, customer-centric manufacturing company. As Akio Toyoda puts it, Toyota’s mission is about “bringing happiness to all.”
As Toyota looks ahead to a new era of electrified vehicles, it is not only reimagining its product line but also reinventing its manufacturing processes. This transformation will bring new processes, new equipment, and a workforce equipped with new skills. One thing underpins the entire transformation process: data.
The Challenge: Breaking Down Data Silos in Manufacturing
At Toyota, quality assurance is embedded throughout the manufacturing process—not just checked at the end. Identifying and addressing defects early reduces remediation costs and improves overall efficiency. However, true quality improvement goes beyond just fixing issues; it requires root cause analysis and the implementation of countermeasures to prevent recurrence. Additionally, detecting defects at later stages significantly increases quality costs, since team members must disassemble or scrap more components.
Historically, root cause analysis was a time-consuming, manual effort. A team member on the shop floor would gather data from multiple applications, disconnected systems, and paper-based records, often using USB drives and manual entries. The process of collecting, cleaning, and analyzing the data could take up to six hours, delaying actionable insights. The foundational data connectivity needed to achieve Toyota’s quality control was missing.
These gaps in quality data connectivity surfaced common enterprise challenges:
- Legacy systems with entrenched processes
- Aging infrastructure and data silos
- Manual data collection and analysis processes
- Fragmented applications that don’t communicate with each other
Toyota needed a scalable, real-time solution to ensure that the right data reached the right team members at the right time.
The Solution: Building a Scalable Quality Insights Application on AWS
To solve these challenges, Toyota used AWS to create an integrated, data-driven quality insights application. The following steps outline the journey to building this scalable solution:
1. Data Discovery: Identifying and Aligning Critical Data Sources – The application team at Toyota began by identifying all the essential data distributed across legacy systems, databases, and applications relevant to defect analysis. The Quality Insights application brought together 22 unique data sources. This included production data, equipment defect logs, quality inspection records, critical inspection requirements, and process assignment data needed for man and method RJ (ryohin joken) analysis—tied to each vehicle by ‘Vehicle Identification Number’ (VIN).
Behind this effort lay a significant challenge: the volume and inconsistency of data across plants. Core systems at plants varied in configuration, with different systems used to host the same data across plant locations. Often these systems were created over decades by teams focused solely on local plant needs. This led to mismatched data models and required deep discovery, mapping/translation, and alignment for each data source. For example, if ‘Pitch 0’ is the starting line in the Indiana plant, ‘Pitch 1’ might be the starting line in the Kentucky plant. Consequently, the data at each plant would need to be translated and bridged into a common data model.
2. Data Profiling & Quality Assessment – With the data sources identified, the team conducted comprehensive data profiling to analyze data structures, identify patterns and anomalies, and assess quality for accuracy, consistency, and completeness. This involved understanding each source in its unique context, evaluating data condition, performing integrity checks, and standardizing and cleaning the data to ensure consistency across systems. What might appear to be a straightforward pipeline can quickly become a repetitive and resource-intensive task due to the level of variation and complexity across the plants. To deal with these issues, the application team developed reusable pipelines to process data captured for processes from across plants.
3. Data Ingestion & Unification in AWS – Using AWS-native services and robust extract, transform, load (ETL) pipelines, Toyota aggregated, cleaned, and unified the previously siloed data. This enabled the creation of structured data products mapping each vehicle to its pitch and corresponding process step, further enriched with team member and defect information. This step consolidated all relevant quality data into a central Amazon S3 bucket, laying the foundation for advanced analytics and real-time monitoring.
4. Building a Near Real-Time Analytics UI – To maximize the impact of the unified data platform, the team developed a custom UI with reports (shown in Figure 1) that provides manufacturing teams with real-time insights based on the unified data products created. The application allows users to:
- Visualize data instantly, eliminating hours of manual report compilation
- Analyze trends, defects, and root causes in real time
- Take immediate, data-driven corrective actions
This solution empowers shop floor team members with rapid visibility and actionable insights, enhancing quality control and operational efficiency across manufacturing lines.
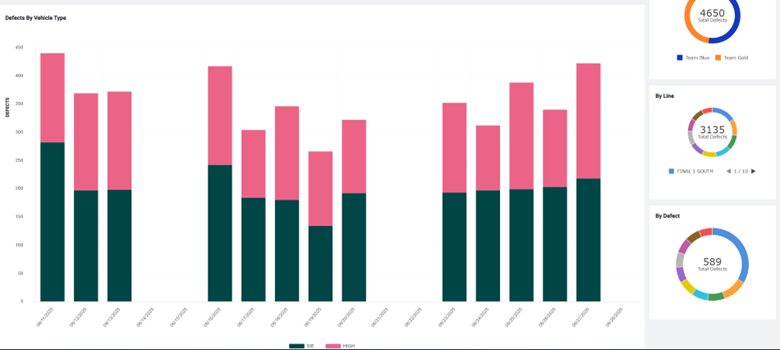 Figure 1 – Quality Insights Application report showing defects by Vehicle type and line
Architecture
Figure 2 outlines the end-to-end architecture that demonstrates the ingestion of hundreds of disparate shop floor systems into an AWS-hosted Big Data Platform by leveraging AWS analytics services to enable quality monitoring and defect analysis. The system connects plant floor systems to AWS services, ensuring seamless data ingestion, contextualization, and actionable insights.
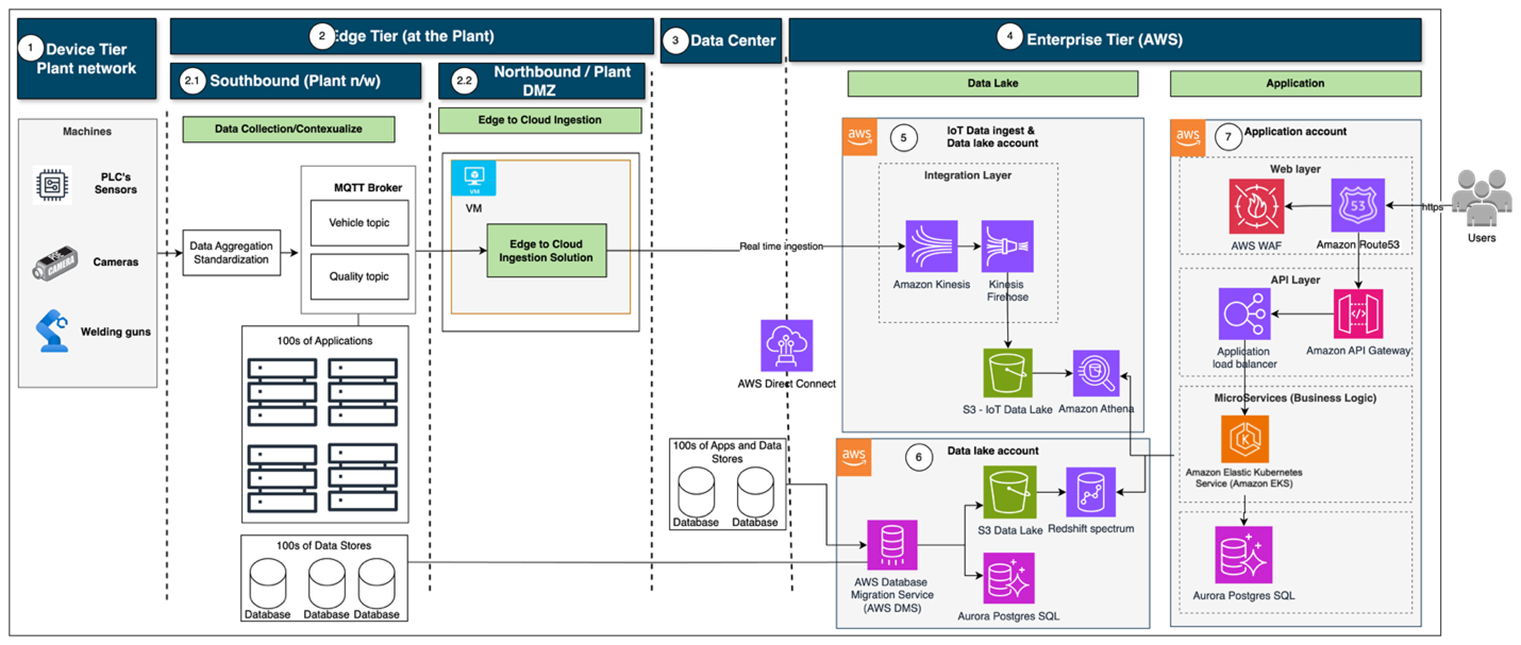
Figure 2 – End to end application architecture
Key Components of the Architecture
1. Device Tier – Located on the shop floor area within the plants, this tier includes sensors, PLCs, cameras, robots, mills, presses, and welding guns that generate real-time operational data.
2. Edge Tier – Contains the data collection and connectivity components that enable communication from the devices to the cloud and back. It is deployed within plant networks and is divided into:
2.1 Southbound (mission-critical production network, no internet access): The southbound includes data aggregation and standardization components that collect, aggregate, and standardize data, then publish it to an MQTT broker. It hosts hundreds of mission-critical applications and their corresponding databases.
2.2 Northbound/Plant DMZ (internet-enabled): Hosts the edge-to-cloud ingestion solution on a virtual machine. This solution runs locally on a VM at the edge, reads data from MQTT topics and streams it into AWS.
3. Data Center – The data center hosts hundreds of regional applications. Each plant connects to AWS via the corporate backbone and AWS Direct Connect for a dedicated network connection to AWS from the central data center.
4. Enterprise Tier – This tier represents the AWS cloud environment where workloads are isolated in separate AWS accounts, ensuring fault isolation and minimizing blast radius (the potential scope or impact of a failure). By isolating workloads, any issue remains contained within its account. Each plant has a centralized data ingestion pipeline that pushes data to cloud storage in a standardized format.
5. IoT Data Ingest – IoT data from the Edge tier is ingested into the IoT Data Lake on Amazon S3 and streamed through Amazon Kinesis and Amazon Kinesis Data Firehose to reliably load real-time streams into the data lake.
6. Data Lake Account – Data from on-premises systems in the Data Center and shop floor systems is replicated to a dedicated data lake account on AWS using AWS Database Migration Service (AWS DMS). The data products are created in Amazon S3 with external tables in Amazon Redshift.
7. Application Account – The application is deployed as a three-tier architecture. Application data is stored in Amazon Aurora PostgreSQL. Backend services run on Amazon Elastic Kubernetes Service (Amazon EKS) and access data from the data lake on Amazon S3 via Amazon Redshift Spectrum and Amazon Athena, with access governed by AWS Lake Formation.
Application Performance Tuning
The following strategies helped ensure optimal performance of the Quality Insights Dashboard, which queries data using Redshift Spectrum over files stored in Amazon S3.
- Design data products in the data lake on Amazon S3 using a star schema: separating facts from dimensions.
- Store large fact tables in Amazon S3 in columnar format (e.g., Parquet or ORC) for efficient scan performance.
- Load frequently accessed dimension tables into the Redshift cluster to minimize join latency.
- Partition fact tables by commonly used filter fields in ‘WHERE’ clauses. Keep partitions balanced to avoid too many small partitions.
- Remove keywords like DISTINCT and ORDER BY in application queries to support predicate pushdown and to prevent unnecessary operations in the Redshift spectrum layer.
- Select only the necessary columns in application queries.
- Aim for file sizes greater than 128 MB. Too many small files reduce parallelism.
- Cache frequently used query results in Redshift or use materialized views where needed.
- Use Athena for complex or infrequent exploratory queries and reserve Spectrum for structured dashboard access.
- Use pagination and limit result sets to maintain UI responsiveness.
This blog describes additional performance tuning techniques for Amazon Redshift.
Benefits of the Quality Insights Application
1. Early Defect Detection & Reduced Cost of Defects
- Identifies defects in earlier assembly processes on the manufacturing line, minimizing rework and remediation costs.
- Avoids costly late-stage disassembly and reduces warranty claims by up to 50% through proactive defect mitigation.
2. Enhanced Manufacturing Efficiency
- Boosts Direct Run Rate by improving quality control at the assembly and modular build stages.
- Streamlined inspections reduce cycle time and increase throughput.
- Continuous Improvement (Kaizen): With real-time insights, Toyota can identify patterns, implement countermeasures, and continuously optimize manufacturing processes.
3. Intelligent Root Cause Analysis (RCA) & Faster Decision-Making
- Reduces time spent on RCA from 4-6 hours to minutes with real-time defect analytics, replacing manual data collection.
- Eliminates data silos by centralizing quality insights across multiple production lines and suppliers.
- Quick response to feedback ensures that defects are corrected early in the cycle.
4. Scalable Quality Framework
- Integrates siloed data sources into a unified, structured format.
- Enables enterprise-wide scalability across plants.
- Automated data-driven insights replace manual defect tracking, making the system scalable and efficient.
Conclusion
By integrating real-time insights, automating data collection, and eliminating silos, Toyota has reduced remediation costs and improved production quality – cutting RCA time from hours to minutes. This scalable, cloud-based quality framework ensures continuous improvement (Kaizen) and can be extended across multiple plants. By centralizing data from edge to cloud using AWS-native services, Toyota is setting a new standard for intelligent, data-driven manufacturing, enabling faster decision-making, enhanced efficiency, and a sustainable model for future-ready operations.
To explore the AWS services and architectural choices behind such transformations, read the Big Data Analytics Options whitepaper.