Migration & Modernization
Migrating and Modernizing Oracle Databases to PostgreSQL on AWS – Part 2: Assessment
Introduction
In this blog post, we explore the assessment phase of migrating Oracle databases to PostgreSQL on Amazon Web Services (AWS), the critical step that transforms your discovery inventory into an actionable migration strategy. After completing discovery of your Oracle estate in Part 1, you face the critical question: what will it take to migrate to PostgreSQL on AWS? Many organizations underestimate complexity, make poor service choices, or face cost overruns because their assessments rely on incomplete analysis. Discovery revealed what you have; assessment determines how to migrate it. This post shows how to turn your discovery inventory into an actionable migration strategy.
Using Zulon City Insurance (ZCINS), a mid-sized insurer with 42 Oracle databases, as a composite case study, we demonstrate multi-dimensional complexity analysis, data-driven service selection between Amazon RDS for PostgreSQL and Amazon Aurora PostgreSQL-Compatible Edition, and cost models that reveal true total cost of ownership (TCO).
Assessment framework overview
Complete assessment requires evaluating three interconnected dimensions:
- Structural complexity, schema and code conversion effort, measured through automated analysis tools.
- Performance characteristics, workload type, concurrency, and latency requirements, measured from production I/O metrics.
- Business criticality, operational impact, regulatory factors, and acceptable downtime windows.
These dimensions interact in ways single-factor analysis misses. ZCINS’ Policy Administration database showed low structural complexity (78% automatic conversion) but demanded sub-100ms response times for 500 concurrent users with critical customer-facing impact. This combination drove the choice of Aurora PostgreSQL over RDS, despite the simpler schema; Aurora’s cloud-native architecture offers up to 3x the throughput and better availability than standard RDS, ideal for high-criticality, high-concurrency workloads. Conversely, the Data Warehouse had high structural complexity from custom aggregation functions but relaxed performance needs and lower criticality, making RDS with extended refactoring time the better fit.
| Dimension | Low | Moderate | High |
| Structural | >80% automatic conversion; standard SQL; minimal stored procedures | 60–80% automatic; some Oracle features; moderate procedure refactoring | <60% automatic; heavy Oracle-specific code; complex packages |
| Performance | <100 concurrent users; batch acceptable; flexible latency | 100–500 users; mixed OLTP/OLAP; sub-second response | >500 users; pure OLTP; sub-100ms latency; high throughput |
| Business Criticality | Internal tools; flexible downtime; no compliance requirements | Departmental systems; limited downtime windows; standard compliance | Customer-facing; near-zero downtime; strict regulatory requirements (GDPR, HIPAA) |
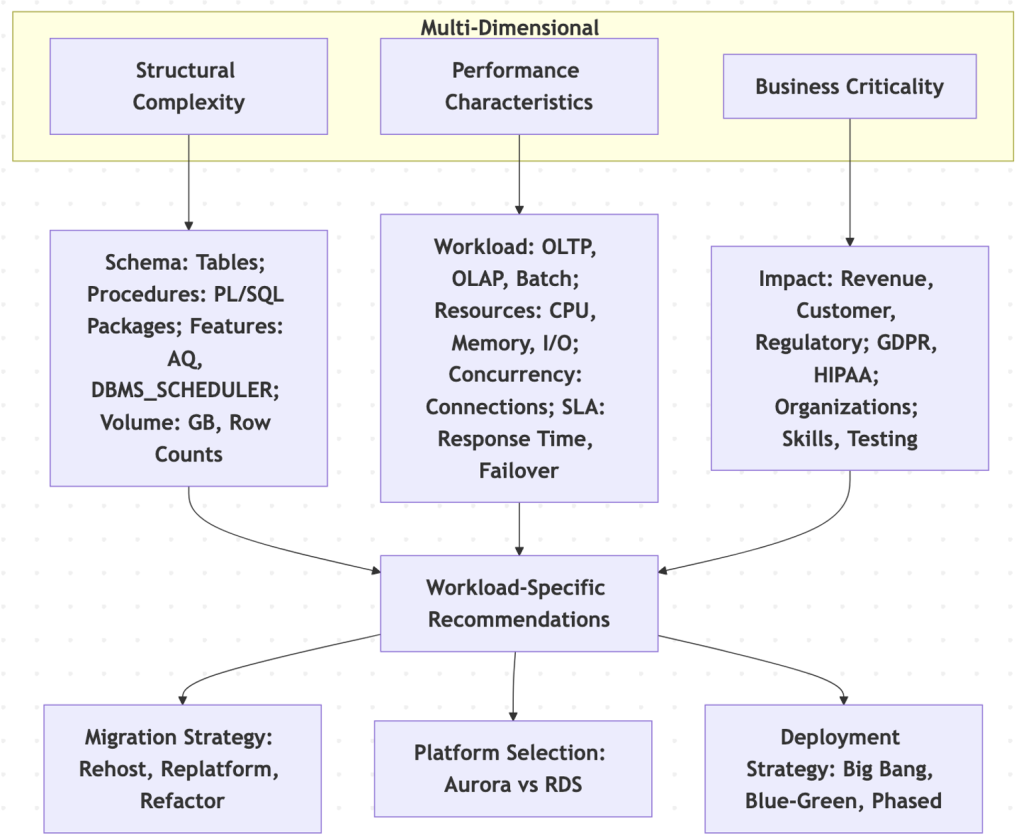
Figure 1: Multi-dimensional complexity assessment framework
The flowchart in Figure 1 shows how Structural Complexity, Performance Characteristics, and Business Criticality feed schema, workload, and impact analysis, which converge into workload-specific recommendations. These then branch into migration strategy, platform selection, and deployment strategy.
The 7 Rs framework
To systematically evaluate each workload, apply the 7 Rs framework:
- Refactor (re-architect): Redesign for cloud-native features. ZCINS used this for Claims Processing, moving to Aurora and extracting PL/SQL into Java microservices.
- Replatform (lift-and-reshape): Move to managed services with minor optimizations. Policy Administration moved to RDS; Billing Engine used RDS Provisioned IOPS.
- Retire: Decommission obsolete assets. ZCINS eliminated nine unused Advanced Queuing (AQ) topics.
- Retain: Keep on Oracle when migration cost exceeds business value.
- Rehost (lift-and-shift): Move to the cloud with minimal changes.
- Repurchase: Switch to SaaS alternatives.
- Relocate: Shift infrastructure without modifying architecture.
Choosing the right R
Map your three assessment dimensions to a strategy using the following matrix, then adjust for level of effort (LOE).
| Assessment profile | Indicated strategy | Typical LOE | ZCINS example |
| High structural + high performance + high criticality | Refactor to Aurora | High | Claims Processing |
| Low–moderate structural + high/predictable I/O + high criticality | Replatform to RDS (io2/gp3) | Moderate | Billing Engine, Policy Admin |
| Low structural + low performance + low criticality | Rehost to RDS | Low | Internal Reporting |
| Obsolete / unused asset | Retire | Minimal | 9 AQ topics, shadow DBs |
| High migration cost, low business value, replacement planned | Retain on Oracle | None (deferred) | Legacy Underwriting |
| Commodity capability with mature SaaS | Repurchase | Low–moderate | 2 vendor-managed systems |
| Time-boxed exit, no refactor capacity | Relocate | Low | (not used by ZCINS) |
Schema and application complexity analysis
AWS Database Migration Schema Conversion (DMS SC) provides automated analysis of your Oracle schemas before migration.
ZCINS ran DMS SC against all 42 databases: across the estate, 60% of objects converted automatically, 25% needed moderate intervention, and 15% required significant refactoring, chiefly packages with complex logic and Oracle-specific features such as AQ. Individual databases ranged from 78% automatic (Policy Administration) down to 31% (Claims Processing, due to heavy PL/SQL).
Application-layer analysis proved equally critical. Scanning ZCINS’ Java applications surfaced 847 embedded SQL queries, 234 stored procedure calls, and 67 JPA entity classes requiring modification. One Claims Processing component looked simple in DMS SC but contained 156 queries with Oracle-specific syntax requiring substantial Java changes.
Data-driven cost modeling and service selection
Simple licensing comparisons miss most of true TCO. ZCINS’ Oracle estate consumed ~15% of IT budget, $9.0M over three years: licensing/maintenance ($6.3M), infrastructure ($1.2M), specialized DBA contractors ($0.9M), and compliance/audit overhead ($0.6M). Projected AWS three-year TCO is $5.5M (a one-time $2.8M migration investment plus $900K/year operations), yielding $3.5M (~39%) net savings while improving performance. (Detailed breakdowns appear in Tables 8 and 9.)
Note: These figures reflect ZCINS’ environment using us-east-1 list pricing with 1-year Reserved Instances where applicable. Organizations with different license positions or architectures should expect three-year TCO reductions of roughly 30–55% based on industry benchmarks.
Service selection between Aurora and RDS requires analyzing actual I/O patterns from Oracle AWR reports, not database size. Aurora Standard charges per million I/O requests (cost-effective for low I/O, expensive for high); Amazon Aurora I/O-Optimized offers unlimited I/O at higher storage cost; Amazon RDS gp3 storage (General Purpose 3) includes baseline IOPS; Amazon RDS io2 provides guaranteed performance at predictable cost.
Normalizing total monthly I/O against database size, million I/O requests per GB per month, aligns directly with Aurora’s pricing. ZCINS’ Claims Processing system, though only 800GB, sustained 28,000 IOPS (~90 million I/O requests/GB/month), making Amazon Aurora I/O-Optimized (which removes per-request charges for ~30% higher compute/storage cost) cheaper than Aurora Standard; superior read scaling and sub-30-second failover further justified it. Their 2.3TB Data Warehouse averaged only 1,200 IOPS, making RDS gp3 the economical choice.
| System | Size | Avg IOPS | Peak IOPS | R/W Ratio | Selected Service | Monthly Cost |
| Claims Processing | 800GB | 28,000 | 45,000 | 70/30 | Aurora I/O-Optimized | $5,800 |
| Policy Admin | 1.2TB | 12,000 | 18,000 | 80/20 | RDS for PostgreSQL (gp3) | $3,400 |
| Data Warehouse | 2.3TB | 1,200 | 3,500 | 95/5 | RDS for PostgreSQL (gp3) | $2,200 |
| Customer Portal | 450GB | 8,500 | 15,000 | 85/15 | Aurora Serverless v2 | $2,100 |
| Reporting DB | 680GB | 800 | 2,100 | 98/2 | RDS for PostgreSQL (gp3) | $1,400 |
Note: Costs reflect fully-loaded production configs (Multi-AZ, primary storage, automated backups, typical I/O), us-east-1 1-year Reserved Instance pricing. Actual costs vary with reservation terms, data transfer, and replica counts.
| System | Workload Pattern | M I/O Req / GB / Mo | Aurora Standard | Aurora I/O-Opt | RDS Provisioned IOPS | Decision |
| Claims Processing | High concurrency, 7:3 read | 90 | $95K | $70K | N/A | Aurora I/O-Optimized |
| Billing Engine | Batch, high I/O | 45 | $135K | $90K | $48K | RDS io2 |
| Policy Administration | Stable, predictable | 35 | $58K | $52K | $40K | RDS gp3 |
Note: Annual costs include Multi-AZ compute, storage, I/O charges, backup retention, and snapshots; us-east-1 1-year RI pricing. Aurora I/O-Optimized becomes cost-effective when I/O charges exceed ~25% of total Aurora Standard cost. “N/A” indicates concurrency/failover needs exceed RDS provisioned-IOPS characteristics.
The Billing Engine’s high-I/O batch workload made Amazon RDS io2 at $48K/year far cheaper than Aurora Standard at $135K, driven by Aurora’s per-request charges across 45 million I/O requests/GB/month. Because this predictable workload needs neither Aurora’s read scaling nor rapid failover, RDS io2 delivered guaranteed performance at predictable cost.
Beyond database costs, the TCO model must include AWS DMS replication (DMS), Amazon S3 backup storage, and team enablement. ZCINS allocated $240K for DMS during the 36-weeks, four-wave migration window, $60K/year for S3 backup and snapshot exports across 28 databases, and $180K for PostgreSQL/AWS training. These are reflected in the AWS three-year TCO. (See the migration-cost breakdown under Cost analysis.)
Risk assessment and mitigation planning
ZCINS evaluated risks across four categories with specific mitigations.
| Risk Category | Source of Risks | Risks | Mitigation Strategies |
| Technical | Schema conversion complexity, application code changes, performance regression | Conversion failures; performance degradation; data-type incompatibilities | DMS SC analysis, proof-of-concept testing, performance benchmarking, parallel testing |
| Organizational | Skillset gaps | Skill gaps; resistance to change; insufficient resources | Training programs, executive sponsorship, pilot projects, dedicated migration team |
| Data | Data integrity, compliance, security controls | Data loss; validation failures; referential integrity issues | Validation frameworks, security reviews, encryption in transit/at rest, DMS monitoring |
| Schedule | Dependency chains, resource availability, blackout periods | Underestimated complexity; resource contention; conflicts | Buffer time, parallel workstreams, go/no-go criteria, contingency plans |
Technical risks dominated: Claims Processing used Oracle AQ extensively, with no direct PostgreSQL equivalent. ZCINS built a proof-of-concept using Amazon Simple Notification Service (Amazon SNS) and Amazon Simple Queue Service (Amazon SQS) before committing to the timeline, adding three weeks but eliminating a critical unknown.
Organizational risks centered on skills: The team had 8–12 years of Oracle experience but minimal PostgreSQL knowledge. Mitigation: AWS Professional Services for the first two migrations, a 12-week PostgreSQL training program, and a center of excellence. By the third wave, the internal team handled conversions independently.
Assessment deliverables
The assessment phase produces six deliverables:
- Migration Readiness Report, findings across all dimensions with go/no-go recommendations.
- Workload Strategy Map, each database assigned to a 7 Rs strategy with justification.
- TCO and ROI Analysis, financial benefits with cost breakdowns.
- Service Selection Matrix, Aurora vs. RDS decisions with supporting I/O data.
- Risk Register, risks with mitigations and ownership.
- Complexity Scorecards, per-workload conversion estimates for sprint planning.
ZCINS’ deliverables showed 28 of 42 databases migrating to PostgreSQL (18 Aurora, 10 RDS), nine retired, three retained temporarily, and two repurchased as SaaS.
ZCINS assessment in practice
We focus on the 12 most representative systems. The six-week assessment used a team of four (two database architects, one application analyst, and one AWS solutions architect): DMS SC analysis of all 42 databases, deep-dive sessions on the 12 most complex workloads, then cost modeling and risk assessment.
Schema conversion analysis results
| System | Automatic Conversion | Key Challenges | Effort Impact |
| Policy Administration | 78% | Minimal PL/SQL, standard patterns | Low effort, predictable timeline |
| Claims Processing | 31% | 78,000 lines PL/SQL, 23 AQ queues, autonomous transactions | High effort, architectural redesign |
| Billing Engine | 52% | Oracle bitmap and function-based indexes | Moderate effort, index redesign |
The codebase scan across eight applications found 847 queries needing modification (340 using ROWNUM, 156 with plus-sign joins, 89 with CONNECT BY), 234 stored procedure calls to refactor, 147 entity classes with inconsistent naming (mixed CamelCase/snake_case), and 67 entity classes using Oracle-specific type mappings.
Complexity scoring and wave assignment
| System | Structural | Performance | Business | Recommendation |
| Claims Processing | Moderate | Very High | Very High | Refactor to Aurora, extract to microservices, blue-green deployment |
| Billing Engine | Low | High I/O | High | Replatform to RDS io2, retain as PL/pgSQL |
| Policy Administration | Low | Moderate | Moderate | Replatform to RDS gp3, straightforward migration |
| Internal Reporting | Very Low | Low | Low | Rehost to RDS, potential retirement |
| Legacy Underwriting | Very High | Low | Moderate | Retain on Oracle until replacement (18 months) |
Cost analysis
| Cost Category | Annual | 3-Year Total |
| Licensing & Maintenance | $2.10M | $6.30M |
| Infrastructure | $0.40M | $1.20M |
| Specialized DBA contractors | $0.30M | $0.90M |
| Compliance & audit overhead | $0.20M | $0.60M |
| Total | $3.00M | $9.00M |
| Cost Category | Amount | Notes |
| Migration project (tooling, AWS ProServe, internal effort) | $2.80M | One-time, 36-weeks window across four waves |
| Ongoing operational costs ($900K/yr × 3) | $2.70M | Aurora + RDS compute, storage, I/O, backups, DMS run-rate, S3 |
| Total 3-Year AWS TCO | $5.50M | |
| Net 3-Year Savings vs. Oracle | $3.50M | $9.0M − $5.5M = ~39% reduction |
The $2.80M migration cost includes AWS Professional Services and SI partner engagement (~$1.6M), tooling/DMS infrastructure ($240K), training ($180K), internal staff loaded cost ($600K), and contingency ($180K), reflecting heavy PL/SQL refactoring (78,000 lines), microservices extraction, and blue-green deployments.
Generative AI economics: Tools such as Amazon Q Developer and DMS SC with generative AI now automate work that once required senior consultants, PL/SQL-to-PL/pgSQL conversion, syntax remediation, code refactoring, and test generation. For this profile, organizations can realistically expect:
- 30–50% reduction in code-conversion labor
- 20–30% compression of migration timeline
- $600K–$1.0M in migration savings, bringing the example $2.8M closer to $1.8M–$2.2M
Human review remains essential for business-critical logic, performance, and architecture.
Service selection based on I/O analysis
As previously shown in Table 3, the same I/O-normalized comparison drives the final service decisions (Claims Processing → Aurora I/O-Optimized; Billing Engine → RDS io2; Policy Administration → RDS gp3).
High-severity items
| Risk | Category | Mitigation Strategy |
| Claims Processing performance regression | Technical | POC for top 10 transaction paths, performance baseline, production-replay parallel testing |
| PostgreSQL skills gap | Organizational | 12-week training program, AWS ProServe for first 2 workloads |
| Data validation complexity (42 DBs, 18TB) | Data | Automated row-count comparison, checksum validation, DMS Amazon CloudWatch alarms |
| Wave dependency constraints | Schedule | Migrate shared infrastructure in Wave 1, 4-week buffers between waves |
| HIPAA compliance review (6-week timeline) | Compliance | Pre-validate RLS policies and encryption, parallel compliance review |
| Service | System | Rationale |
| Aurora PostgreSQL | Claims Processing, Customer Portal, real-time analytics | High concurrency, read scaling, low-latency failover |
| RDS PostgreSQL | Billing Engine, Policy Administration, Reporting | Predictable I/O, cost-optimized |
| Retain on Oracle | Legacy Underwriting, vendor-managed package | Replacement planned, vendor responsibility |
| Retire | 9 obsolete systems | Shadow databases, unused test environments, deprecated services |
| Repurchase (SaaS) | 2 vendor-managed | Mature SaaS alternatives, lower TCO than custom build |
Strategic transformation opportunities
| Oracle Feature | AWS Replacement | Impact |
| 23 AQ queues | 6 Amazon SNS topics with Amazon SQS | Improved observability, reduced complexity |
| 156 DBMS_SCHEDULER jobs | Amazon EventBridge + AWS Lambda | Eliminated database coupling |
| 12 database links | REST APIs with AWS IAM | Improved security, maintainability |
Prerequisites
This post requires no AWS infrastructure deployment. Familiarity with Oracle database concepts and basic AWS services is recommended before proceeding. Completion of Part 1 (Discovery) in this series is also recommended, as assessment builds directly on discovery deliverables.
Walkthrough
The sections above constitute the walkthrough for this post. To apply the assessment framework to your own Oracle estate:
- Run AWS DMS Schema Conversion (DMS SC) against your Oracle databases to establish baseline conversion percentages.
- Score each database against the three dimensions (structural, performance, and business criticality) using the framework in Table 1.
- Map each database to a 7 Rs strategy using Table 2.
- Normalize I/O metrics from AWR reports and select Aurora vs. RDS using the cost model in Table 4.
- Document risks and mitigations using the register format in Table 11.
- Produce the six assessment deliverables: Migration Readiness Report, Workload Strategy Map, TCO and ROI Analysis, Service Selection Matrix, Risk Register, and Complexity Scorecards.
Cleanup
No cleanup is required for this post as no AWS resources are provisioned.
Conclusion
Assessment transforms your discovery inventory into an executable strategy through multi-dimensional complexity analysis, data-driven service selection, and risk planning. ZCINS’ six-week assessment provided the clarity to migrate 28 databases (18 Aurora, 10 RDS), retire nine, retain three pending vendor roadmaps, and repurchase two as SaaS.
Success rests on balancing all three dimensions rather than any single factor; on driving Aurora-vs-RDS selection from actual AWR I/O data rather than database size; on modeling full TCO (licensing, infrastructure, administration, and migration); and on specific, owned risk mitigations.
In Part 3, we cover execution, how ZCINS used DMS to replicate databases, validate integrity, and cut over with minimal downtime using a wave-based approach.