AWS Cloud Operations Blog
Automate RCA across ServiceNow, Dynatrace and Slack with AWS DevOps Agent
If you manage production incidents, you know the drill. A ServiceNow ticket fires at 2 AM. The on-call engineer wakes up, logs in to Dynatrace, pulls traces and metrics across multiple dashboards, cross-references change records, forms a hypothesis, updates the ticket, and posts findings to Slack. The investigation takes one to three hours, and that’s per incident.
Multiply that by every incident your team fields in a week, and the pattern becomes the real cost. The bottleneck isn’t the ticket itself; it’s the manual correlation. Your tools already do their jobs well: Dynatrace can detect the anomaly, map its business impact, and even auto-create the ServiceNow incident. What still falls to a human at 2 AM is the deep investigation: tracing the execution path from symptom to failing component, digging through logs, and correlating the failure with recent changes to pinpoint why it broke. Every context switch adds latency and cognitive load, and when alerts pile up, the signal that actually explains the outage gets buried in the noise. This is where mean time to resolution (MTTR) quietly balloons, not because teams lack data, but because correlating it across disconnected systems is slow, manual, and relentless.
What if a ServiceNow incident could investigate itself? An AI-powered agent finds the root cause in Dynatrace, updates the ticket, and alerts Slack, in minutes.
In this post, you’ll configure AWS DevOps Agent to do exactly that. AWS DevOps Agent is an AI-powered, always-available agent that autonomously investigates operational issues across AWS, multicloud, and on-premises environments. You’ll connect it to your existing ServiceNow, Dynatrace, and Slack toolchain to create an end-to-end autonomous incident investigation pipeline with no tool migration required.
Solution overview
The following diagram shows the solution architecture and its components across AWS, Dynatrace, ServiceNow, AWS DevOps Agent, and Slack.
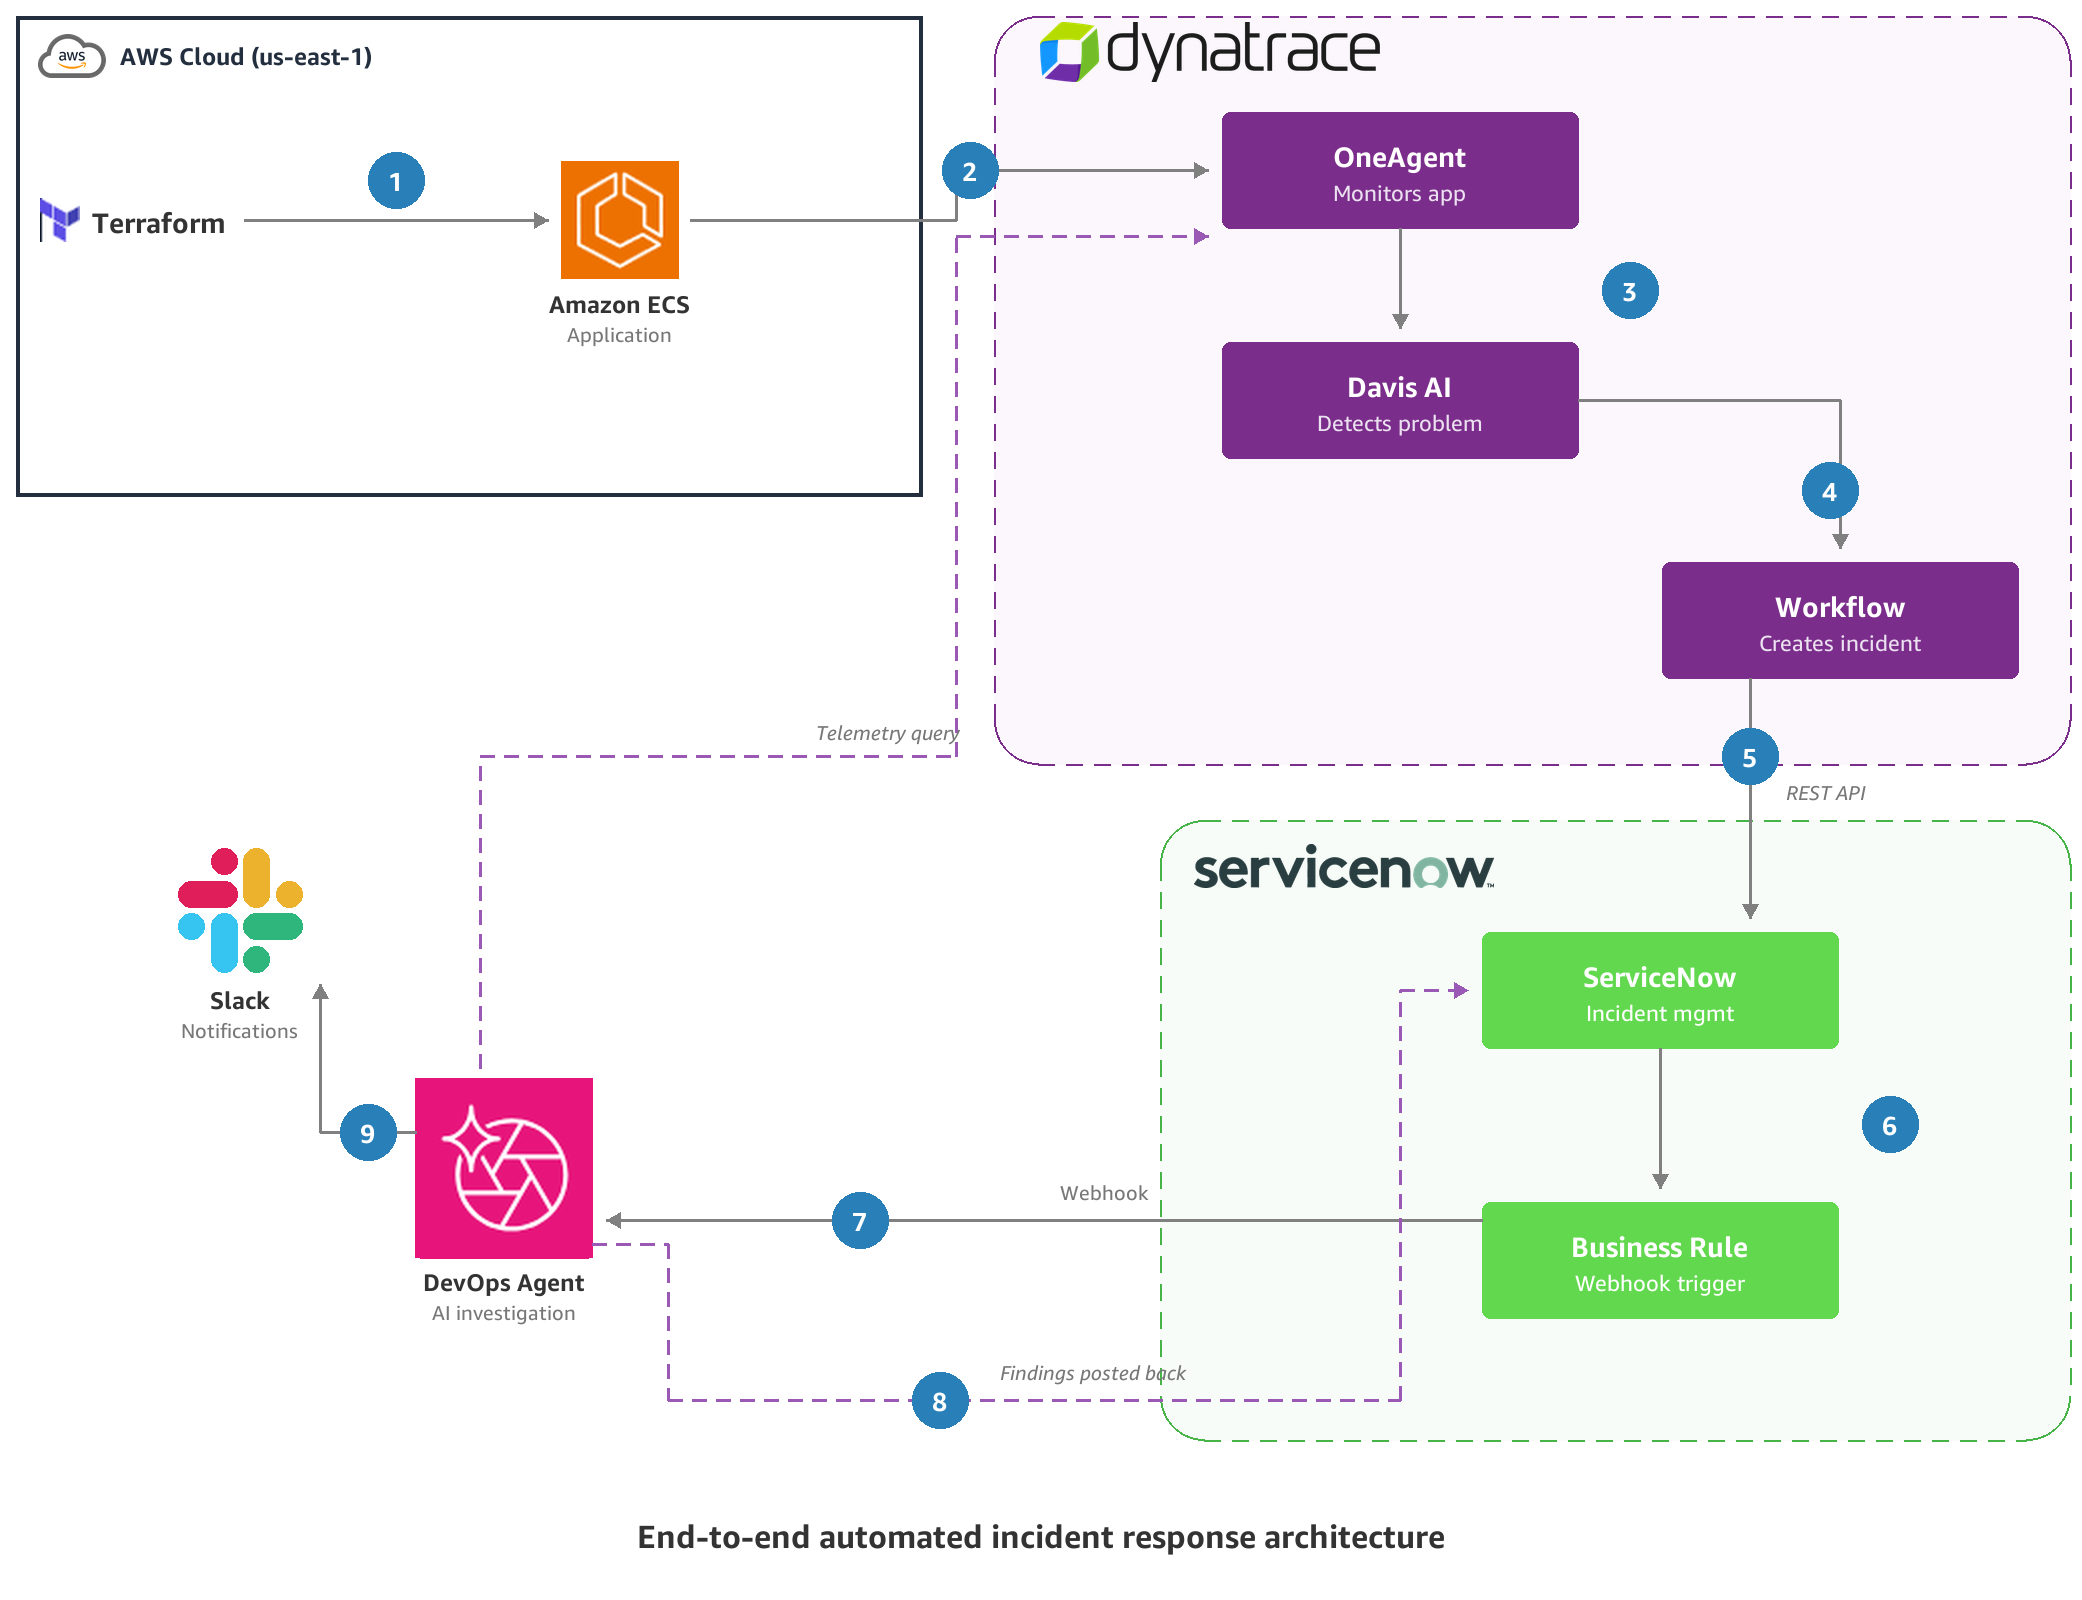
Figure 1: End-to-end automated incident response architecture
Let’s review the end to end automated incident response architecture and flow of event during an investigation.
- Terraform provisions the sample application and its supporting resources on Amazon ECS in us-east-1.
- Dynatrace OneAgent instruments the ECS tasks and streams metrics, traces, and logs to Dynatrace.
- Davis AI detects the degradation and raises a problem.
- A Dynatrace workflow triggers on that problem and builds the incident payload.
- The workflow calls the ServiceNow REST API and creates an incident.
- A ServiceNow business rule fires on the new incident record.
- The business rule sends a webhook to AWS DevOps Agent, which begins an autonomous investigation. The agent queries Dynatrace telemetry through the built-in integration, correlating metrics, traces, and logs against your application topology.
- The agent writes its findings, root cause analysis, and mitigation plan into the originating ServiceNow incident as comments, identifying the probable cause and the affected components.
- The agent posts the same findings, root cause analysis, and mitigation plan to the associated Slack channel.
AWS DevOps Agent is organized around Agent Spaces – logical containers that define what the agent can access and investigate. Each Agent Space contains your AWS account configurations, third-party tool integrations, and access permissions. The agent automatically builds an application topology that maps your resources and their relationships, helping it understand your architecture during investigations.
Prerequisites
Before you begin, make sure you have:
- An AWS account with an AWS DevOps Agent Space already created
- A Dynatrace SaaS environment with an OAuth client and its Client ID, Client Secret, and Account URN
- A developer or production ServiceNow instance with administrator access to create OAuth application clients and Business Rules
- A Slack workspace with permissions to install and authorize third-party applications
- Basic familiarity with incident management workflows
If you haven’t created an Agent Space yet, follow the Getting started with AWS DevOps Agent guide.
Integrating Dynatrace with AWS DevOps Agent
Dynatrace is a built-in, 2-way integration with AWS DevOps Agent. Once connected, the agent gains:
- Topology resource mapping – AWS DevOps Agent augments your Agent Space Topology with entities and relationships from your Dynatrace environment.
- Telemetry introspection – AWS DevOps Agent can introspect Dynatrace telemetry as it investigates an issue through the built-in Dynatrace integration.
- Status updates – AWS DevOps Agent publishes key investigation findings, root cause analyses, and generated mitigation plans to the Dynatrace user interface.
Note: Dynatrace can also trigger investigations directly through its automated investigation triggering capability. In this post, we trigger investigations from ServiceNow to demonstrate the cross-tool workflow.
To connect Dynatrace to your Agent Space
- In the AWS Management Console, navigate to your DevOps Agent Capability Providers page.
- Find Dynatrace in the Available providers section under Telemetry and choose Register.
- Create an OAuth client in Dynatrace with the required permissions, see Dynatrace documentation for details. You can connect multiple Dynatrace environments and later scope to specific ones for each Agent Space.
- Enter your Dynatrace details from the OAuth client setup: Client Name, Client ID, Client Secret, and Account URN.
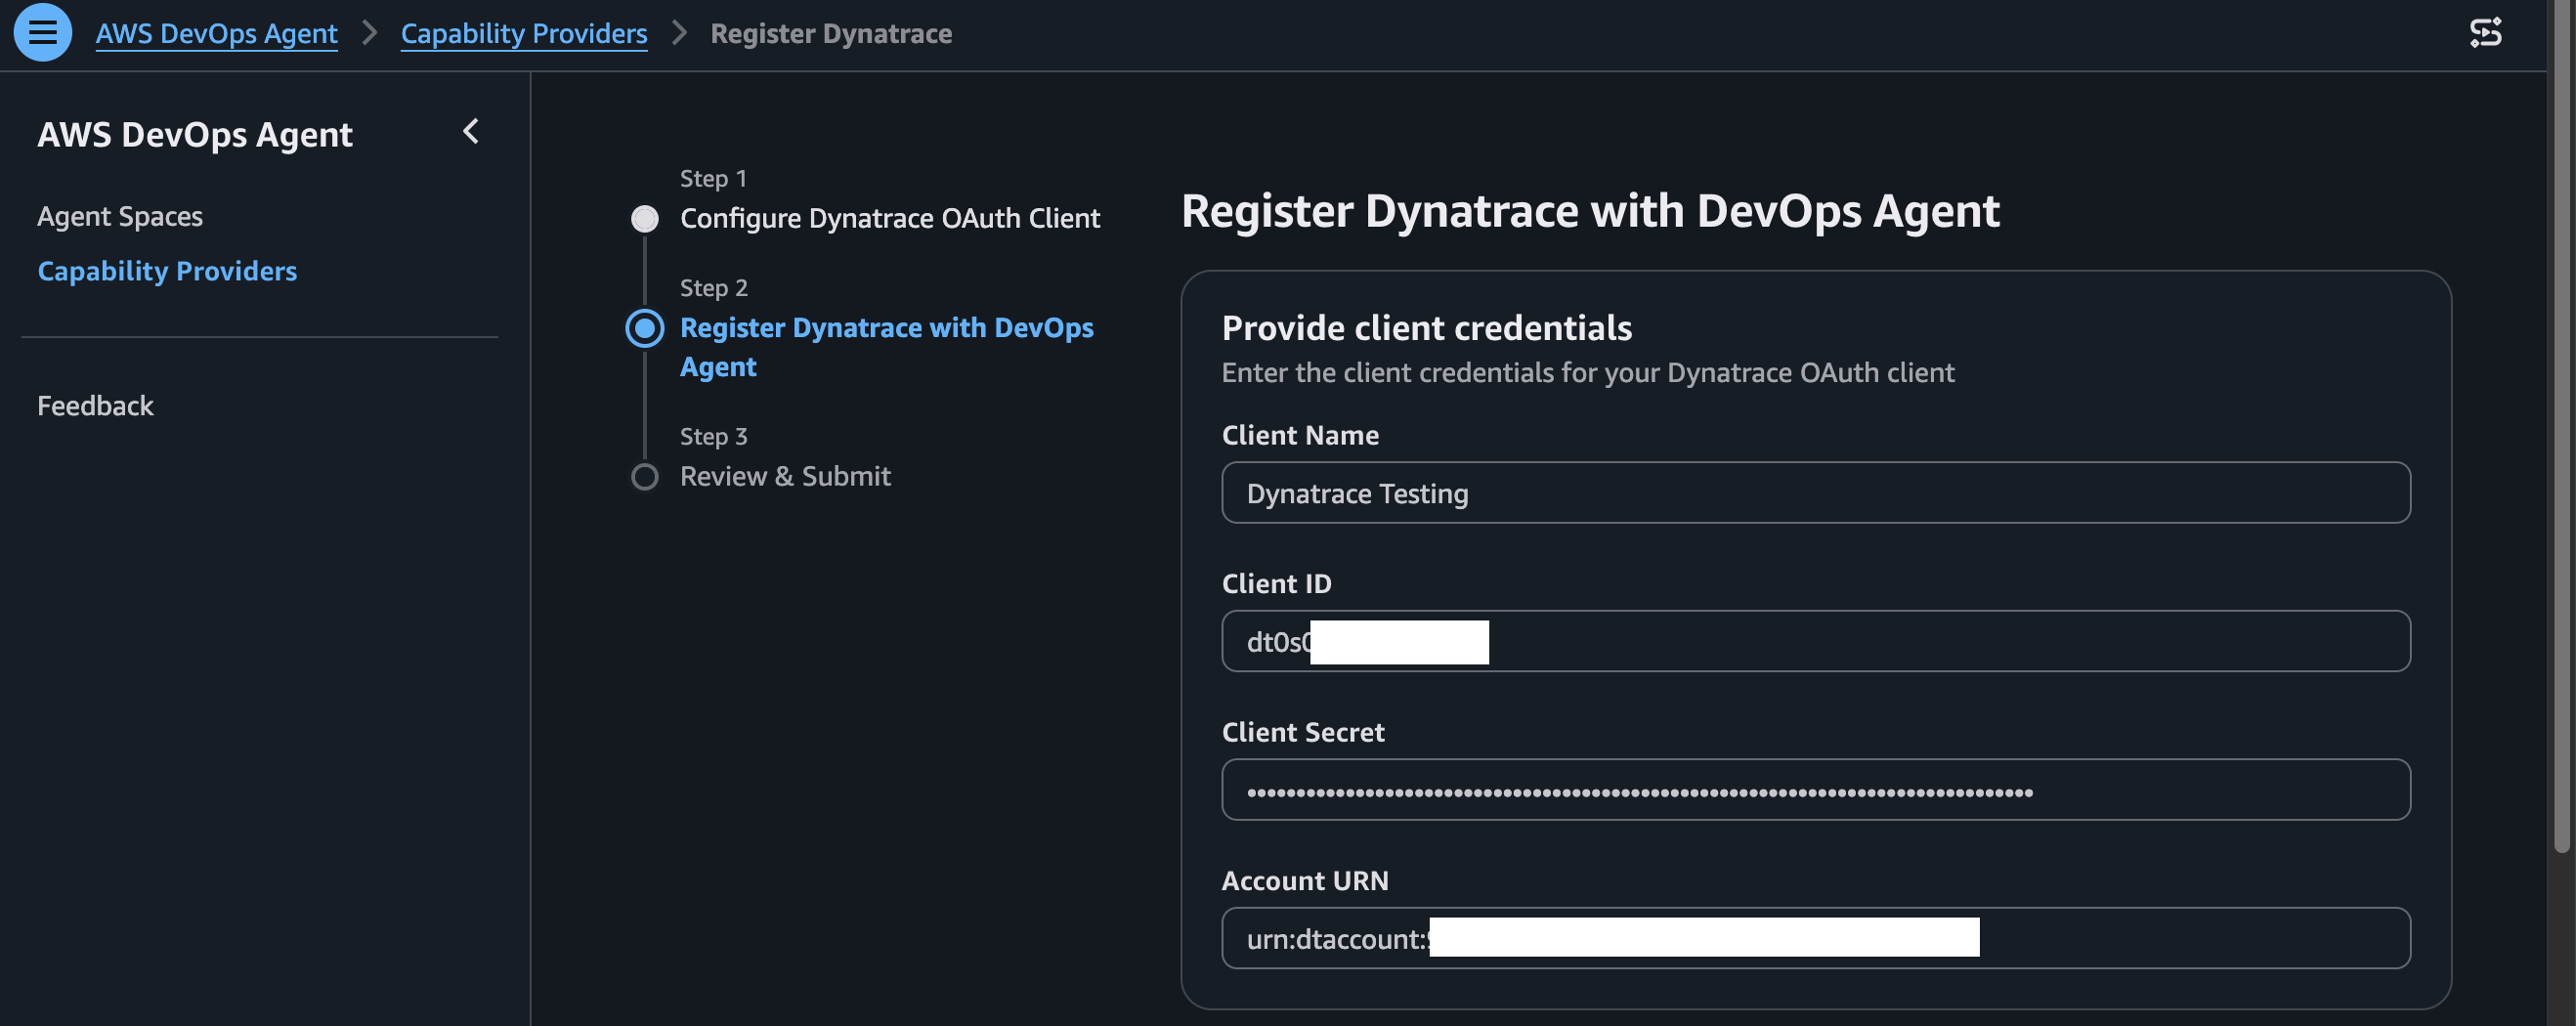
Figure 2: Registering Dynatrace OAuth credentials in AWS DevOps Agent
- Choose Next, review, and confirm.
- From the Agent Spaces page, select your agent space and choose View Details. Select the Capabilities tab, locate the Telemetry section, and choose Add. Dynatrace appears with a Registered status, choose Add to add the registration you want to your agent space.
- Provide your Dynatrace Environment ID and enter one or more Dynatrace Entity IDs to help DevOps Agent discover your most important resources, such as services or applications. If you are unsure, you can skip the entity IDs. Review and choose Save.
To validate Dynatrace connectivity
After completing the setup, verify that Dynatrace entities appear in your Agent Space Topology. Navigate to the Topology page in the DevOps Agent web app and confirm that your Dynatrace-monitored services and their relationships are visible.
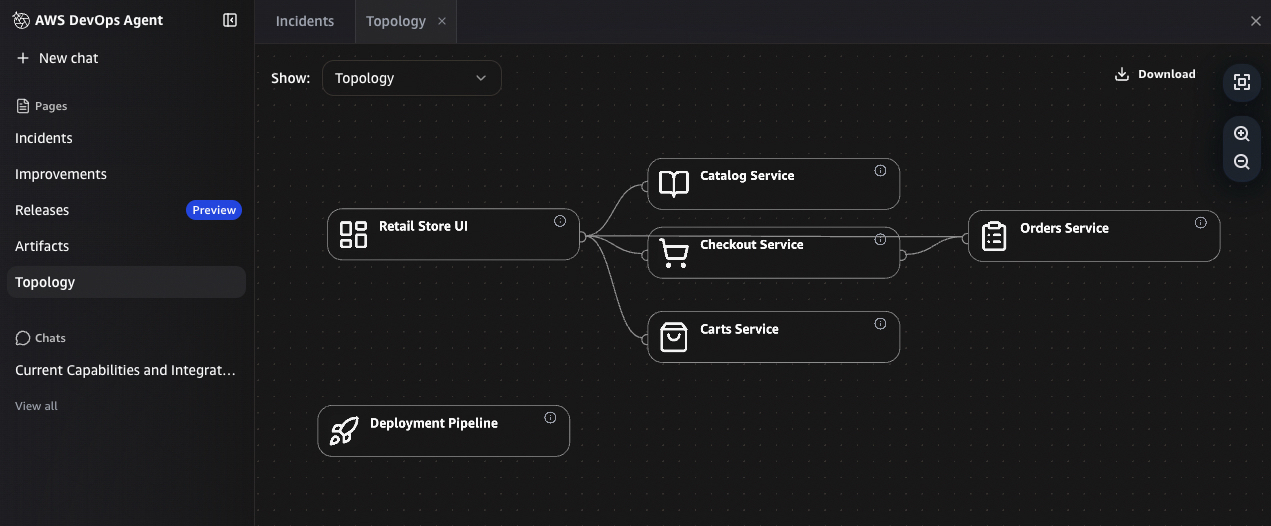
Figure 3: Dynatrace entities in the Agent Space topology
Integrating ServiceNow with AWS DevOps Agent
Once connected, ServiceNow serves dual roles: it triggers AWS DevOps Agent investigations when incidents are created, and it receives findings, including root cause analysis, affected components, and mitigation recommendations, posted back to the ticket. For full details, see Connecting ServiceNow in the AWS DevOps Agent User Guide.in the AWS DevOps Agent User Guide.
To create a ServiceNow OAuth application client
- In your ServiceNow instance, navigate to sys_properties.list in the filter search box and hit enter. Choose New to create a new record. Set the name to glide.oauth.inbound.client.credential.grant_type.enabled, the type to true | false, and the value to true.
- Choose New > New Inbound Integration Experience > New Integration > OAuth – Client Credentials Grant to create the OAuth application client.
- Pick a name for the integration and set the OAuth application user to ‘Problem Administrator’. Choose Save.
To connect ServiceNow to AWS DevOps Agent
- In the AWS Management Console, navigate to the Capability Providers page and find ServiceNow Communication. Choose Register. Alternatively, select your Agent Space and navigate to Capabilities → Communications → Add → ServiceNow and choose Register.
- Authorize DevOps Agent to access your ServiceNow instance using the OAuth application client you created. Each registration connects to one ServiceNow instance.
- Associate ServiceNow with your Agent Space by choosing the registered instance under Capabilities → Communications. A single Agent Space can use more than one ServiceNow registration.
To configure the ServiceNow Business Rule (webhook trigger)
- In ServiceNow, navigate to Activity Subscriptions → Administration → Business Rules and choose New.
- Set the Table field to Incident (incident), check the Advanced box, and set the rule to run after Insert, Update, and Delete.
- Navigate to the Advanced tab and add the webhook script provided in the AWS DevOps Agent documentation, inserting your webhook secret and URL where indicated. Choose Submit.
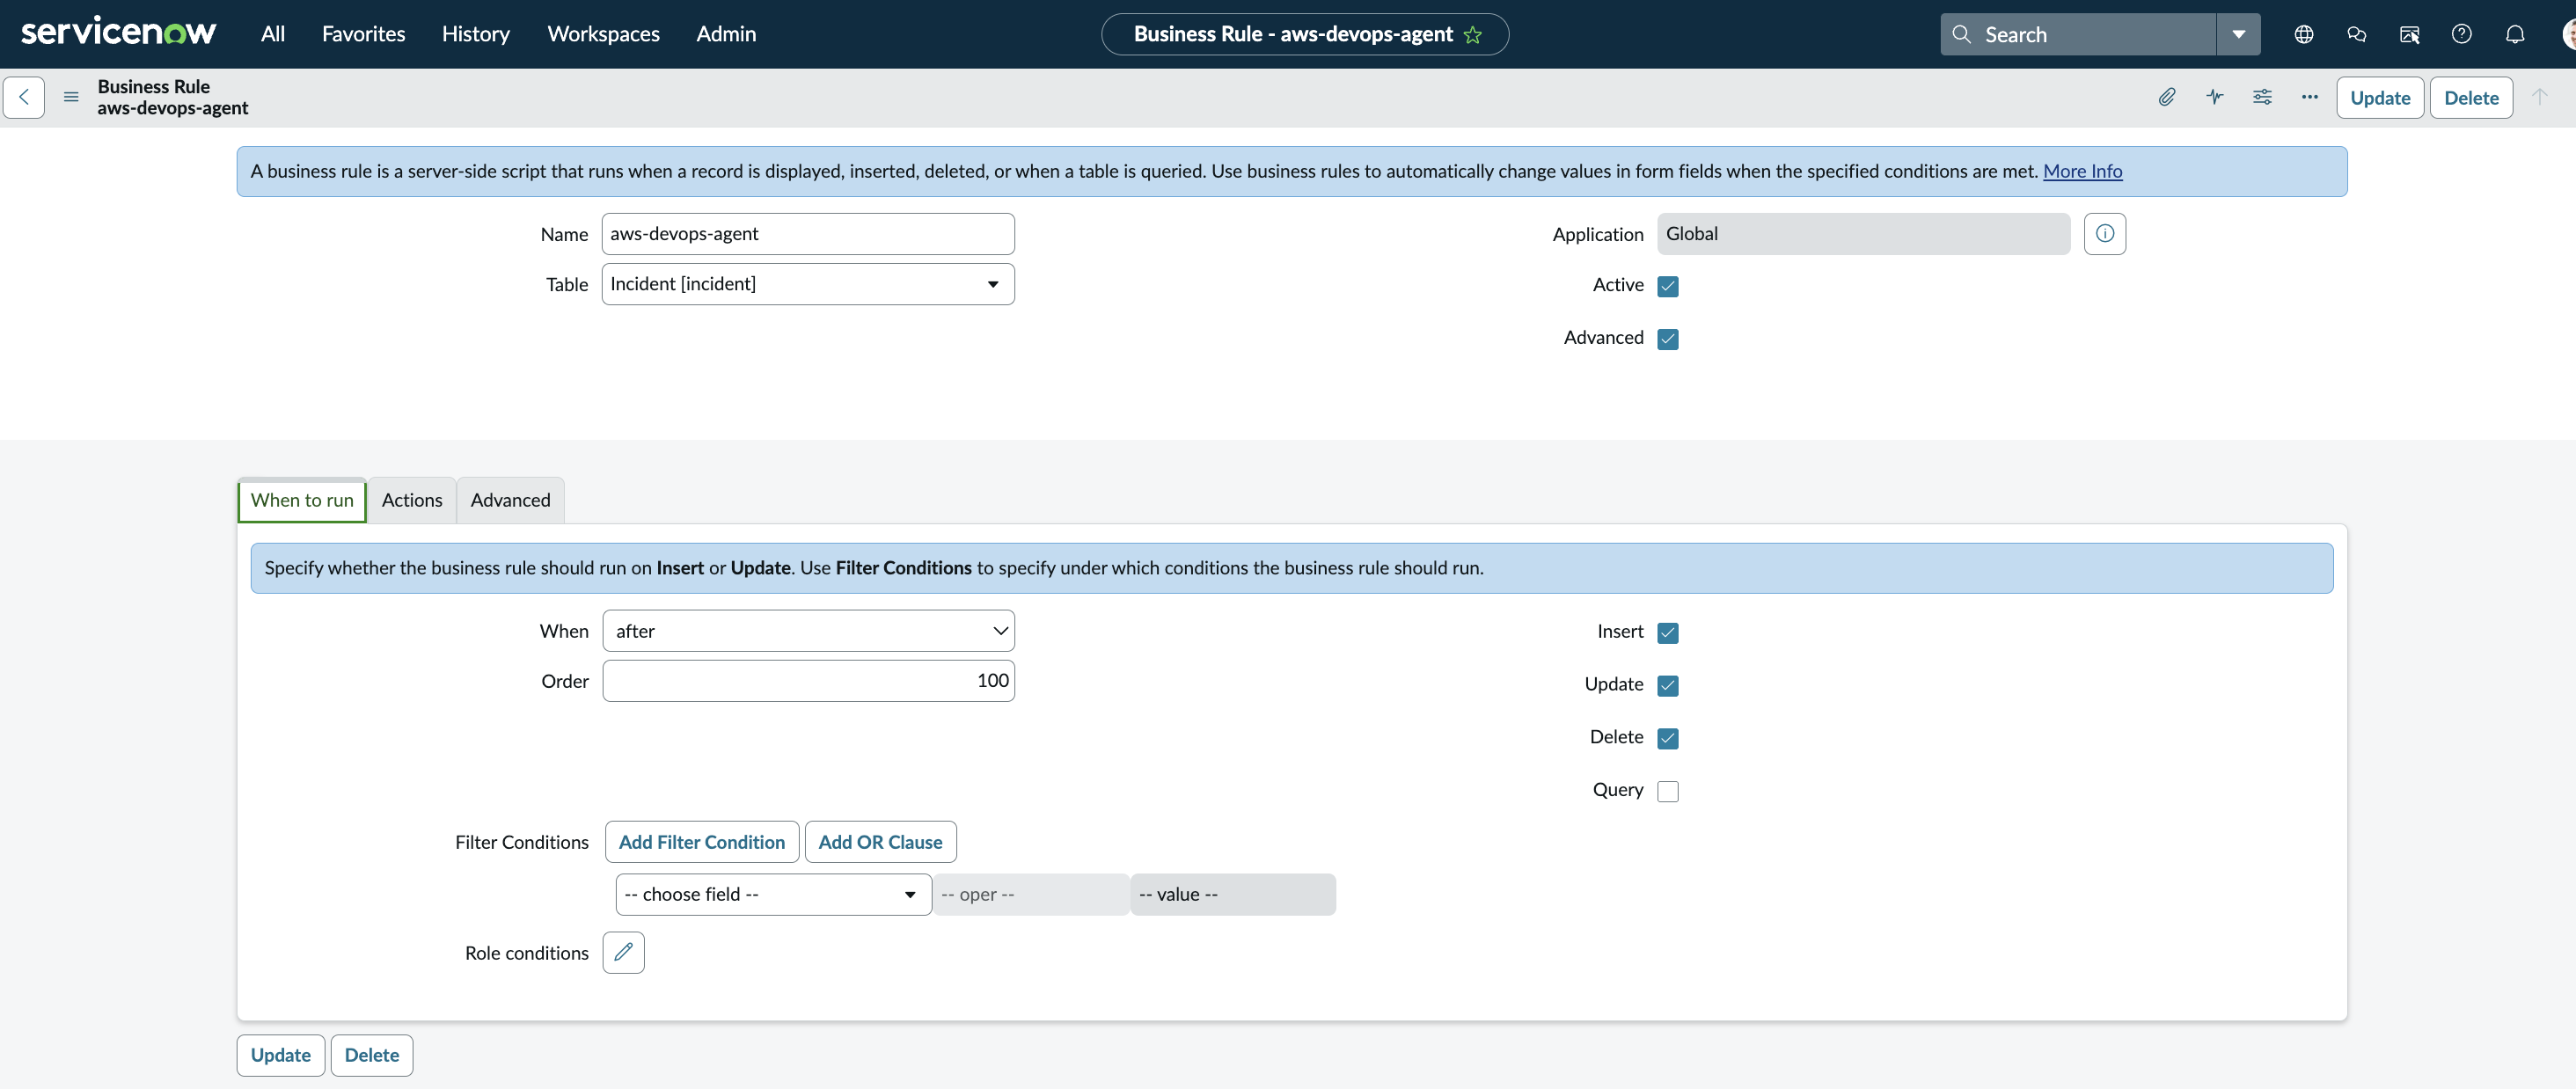
Figure 4: ServiceNow business rule configured as the webhook trigger
Once configured, all incidents where the caller is set to ‘Problem Administrator’, to mimic the permissions you gave the AWS DevOps OAuth client, will trigger an incident response investigation in the configured DevOps Agent Space.
To validate the trigger-to-response loop
Create a new incident in ServiceNow and set the Caller field of the incident to ‘Problem Administrator’. Confirm that an investigation appears in your DevOps Agent Space web app within seconds. During the investigation, the agent posts its key findings, root cause analysis, and mitigation plans to the comments of the originating ServiceNow ticket. It posts records of type finding, cause, investigation_summary, and mitigation_summary, along with status updates such as when it starts and finishes.
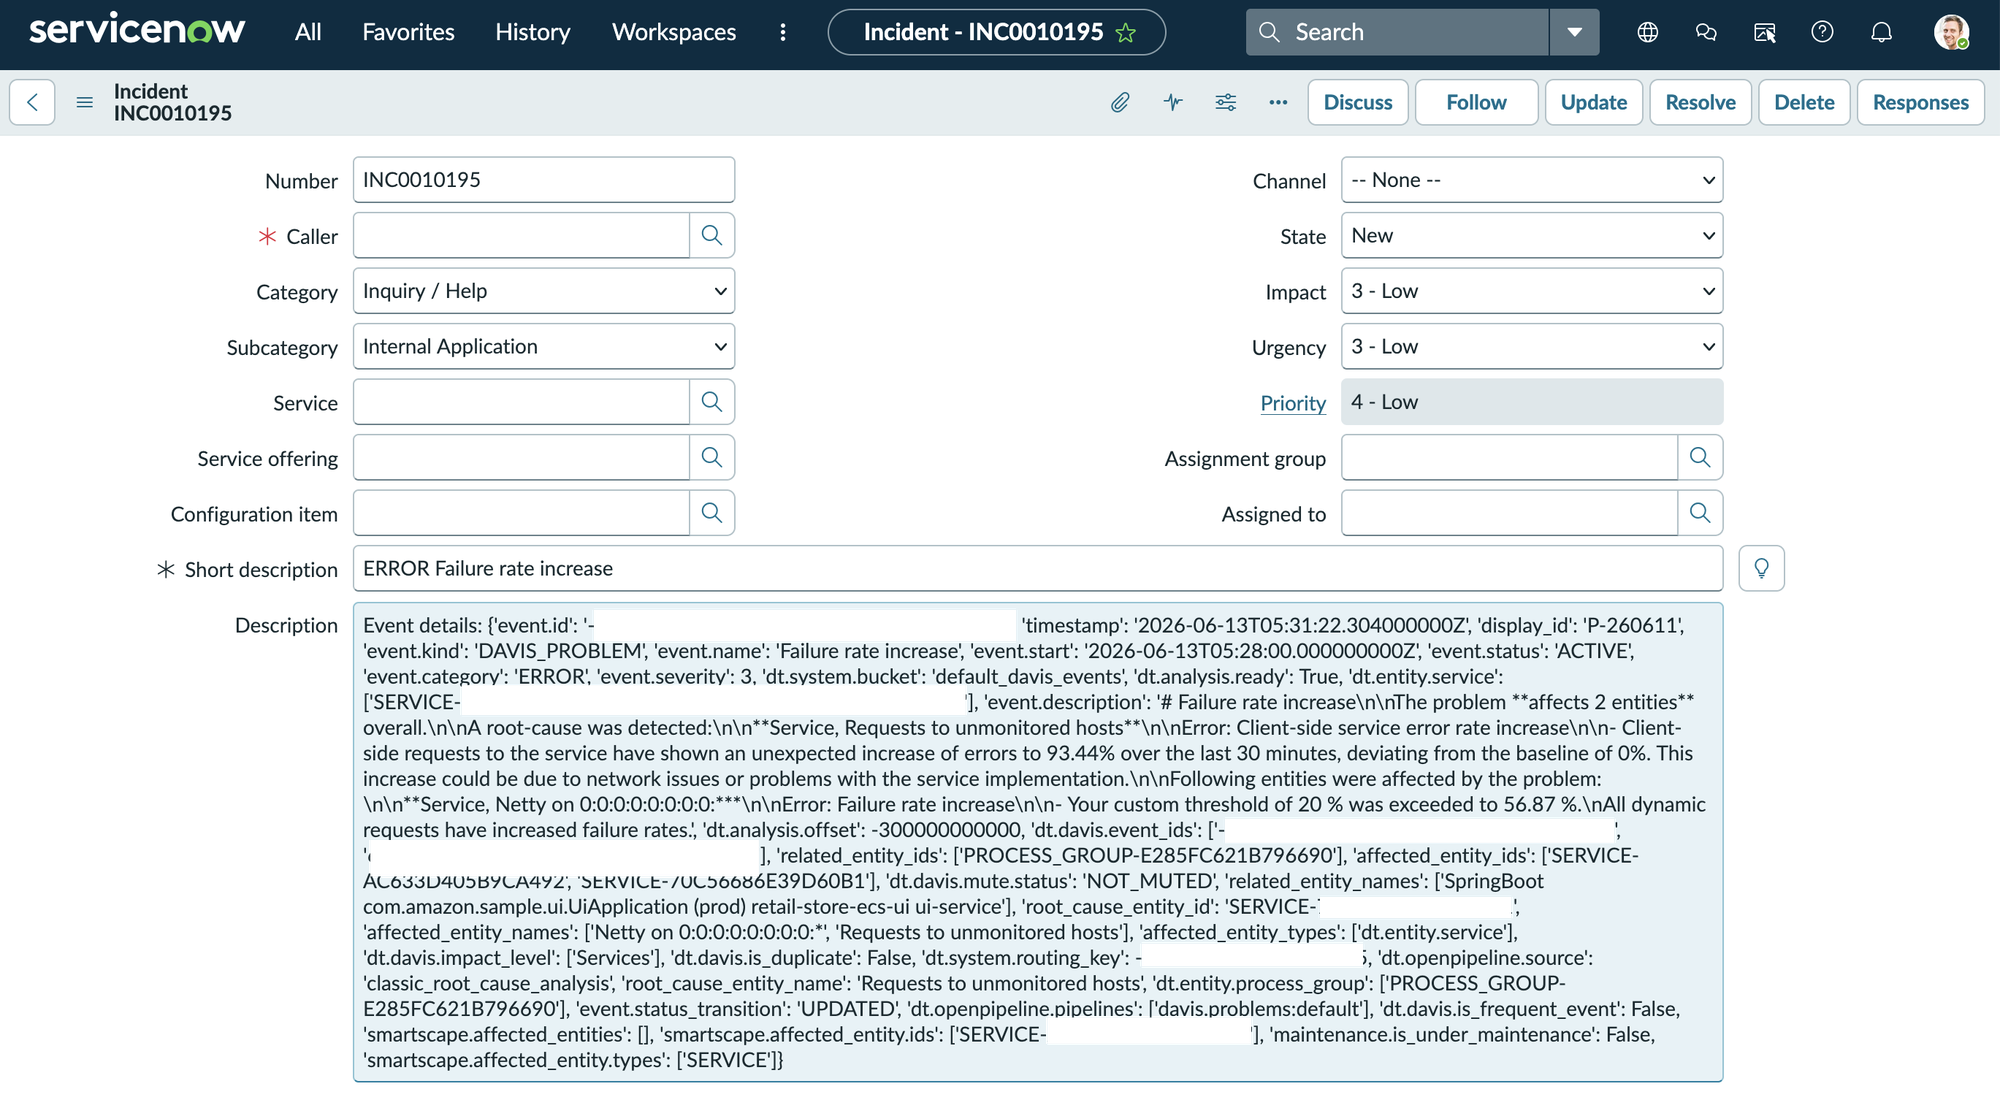
Figure 5: New ServiceNow incident used to test the trigger
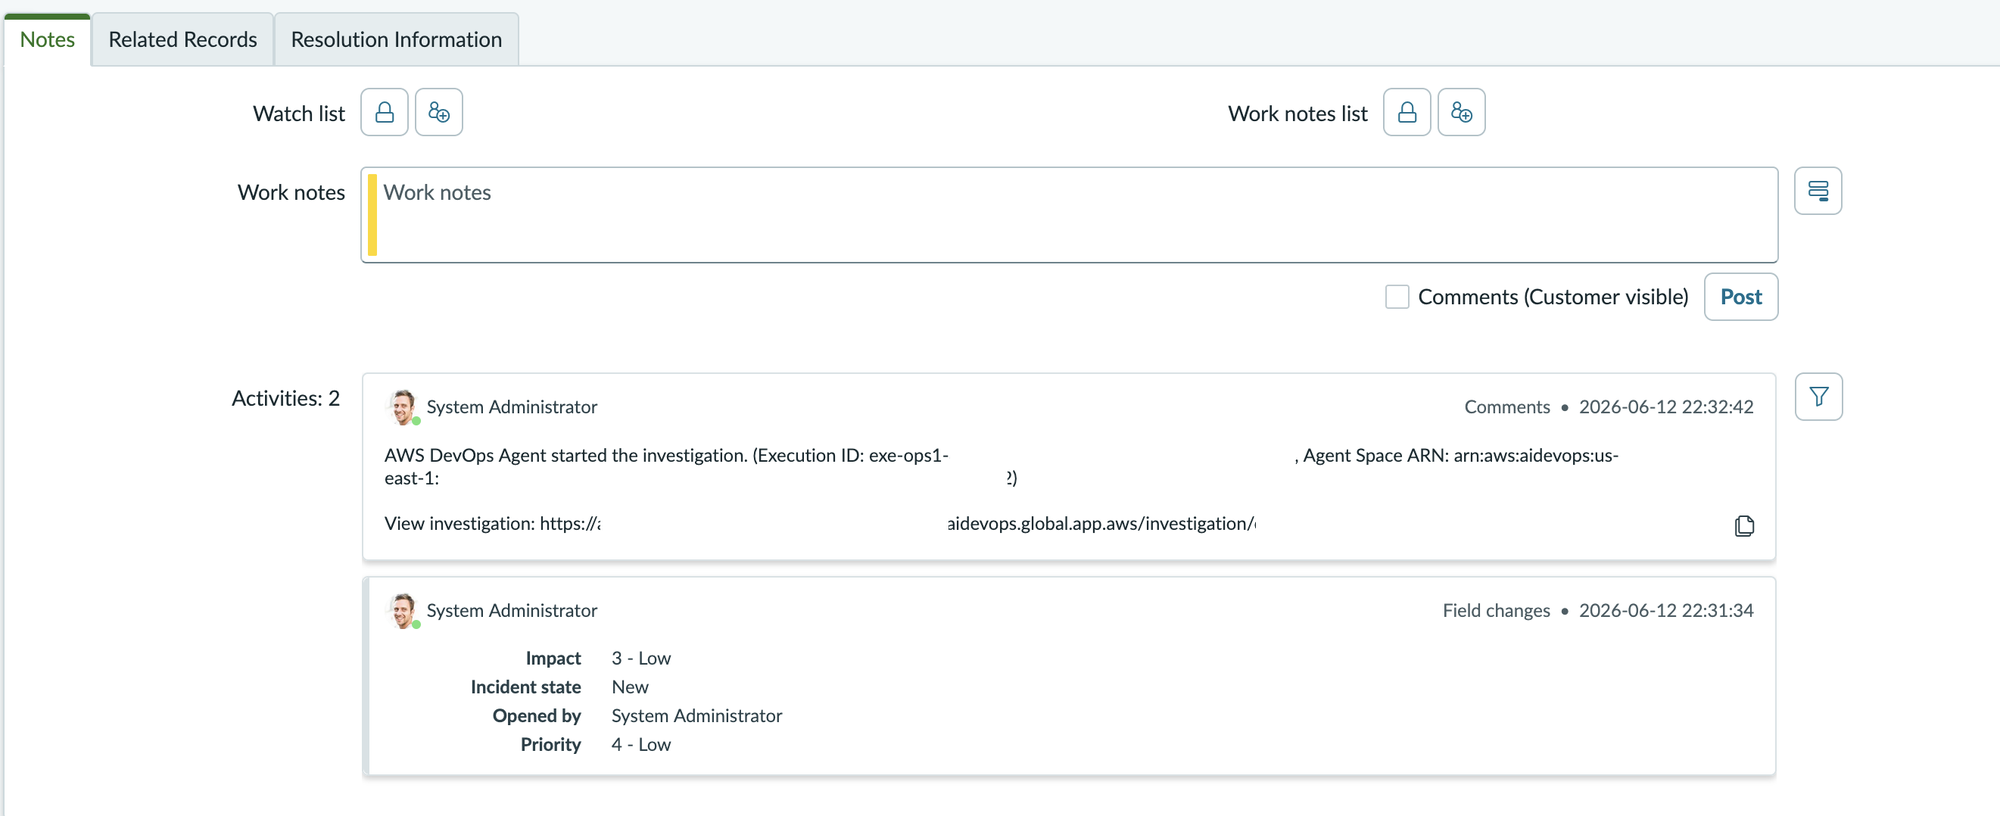
Figure 6: AWS DevOps Agent investigation logged in the ServiceNow ticket
Integrating Slack with AWS DevOps Agent
You can configure AWS DevOps Agent to update Slack channels you select with incident response investigation key findings, root cause analyses, and generated mitigation plans. For full details, see Connecting Slack in the User Guide.
To connect Slack to your Agent Space
- Navigate to the Capability Providers page in the AWS Management Console. Find Slack and choose Register.
- Authorize DevOps Agent to access your Slack workspace via OAuth. Slack uses OAuth token authentication at the account level.
- Navigate to your Agent Space and choose Capabilities → Communications → Add. Select the Slack workspace you registered and choose the channels where you want AWS DevOps Agent to send notifications.
- Choose Save to complete the association. If you manage multiple AWS accounts, you don’t need a separate Slack workspace for each account.
To validate notification delivery
Trigger a test investigation, either from ServiceNow or manually through the DevOps Agent web app. Verify that investigation findings and status updates appear in your configured Slack channel in real time.
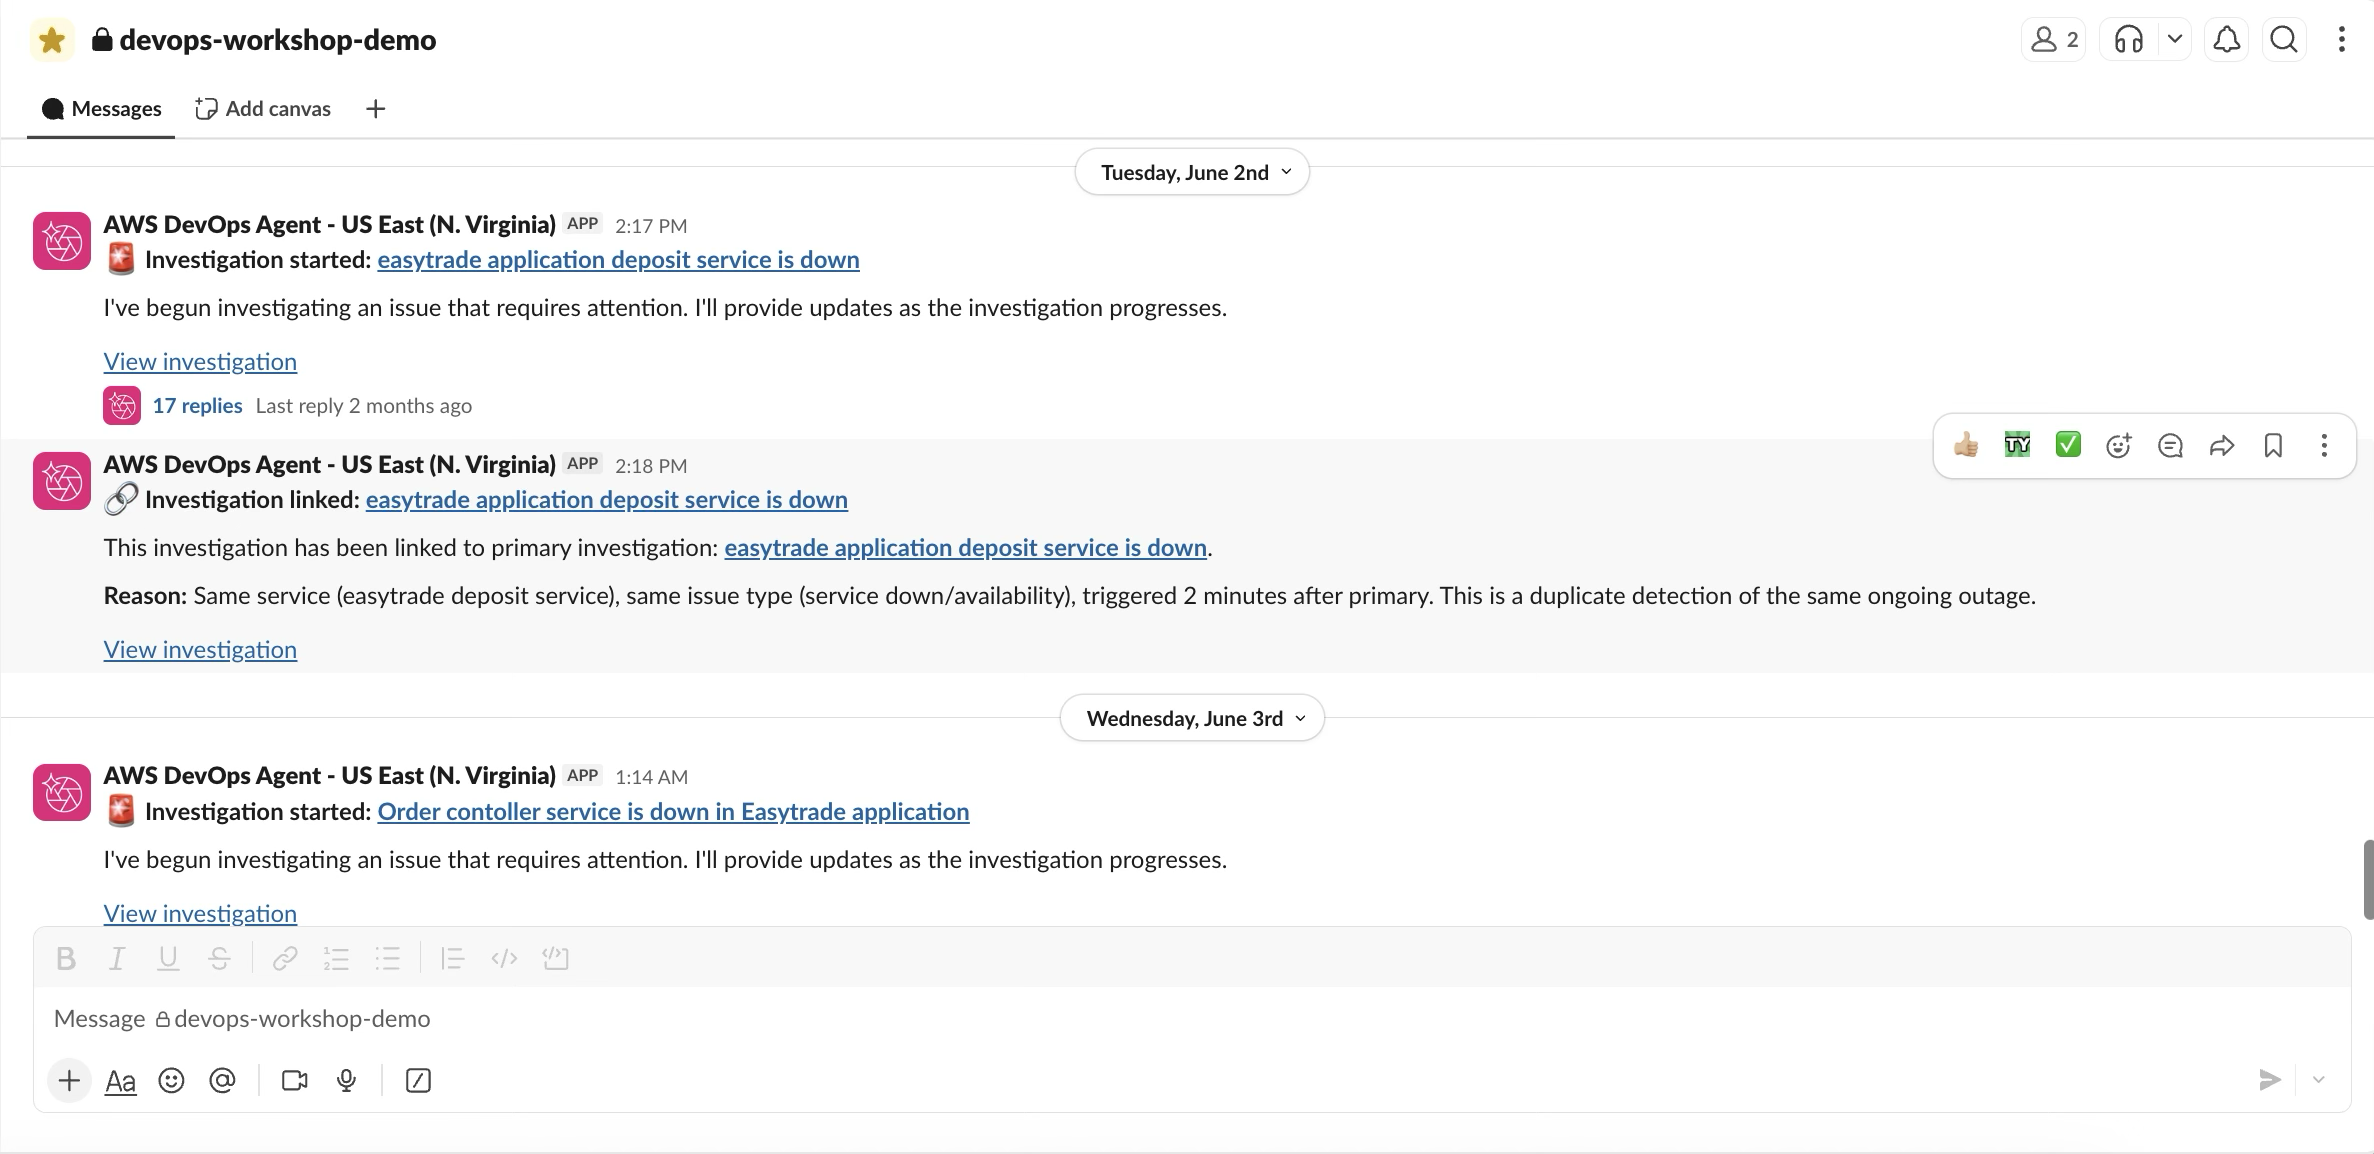
Figure 7: Investigation notifications delivered to Slack
End-to-end incident investigation walkthrough
With all three integrations configured, let’s walk through what happens when a real incident occurs.
- A ServiceNow incident is created. Your operations monitoring team detects elevated API response times. A ServiceNow incident ticket is created automatically either manually or by an operator. The ServiceNow Business Rule fires the webhook to your DevOps Agent Space.
- AWS DevOps Agent is triggered. Within seconds, the DevOps Agent triage phase processes the incoming event. The agent determines whether to investigate independently or link to an existing investigation.
- Agent queries Dynatrace telemetry. The agent queries Dynatrace through the built-in Dynatrace integration, pulling relevant metrics, traces, and logs. It correlates telemetry signals with the application topology – the automatically generated map of your resources and their relationships.
- Agent identifies root cause. By correlating deployment data, metrics spikes, and trace anomalies, the agent identifies that a recent deployment introduced a memory leak causing cascading timeouts across downstream services.
- Agent updates the ServiceNow ticket. The agent posts structured findings back to the originating incident ticket, populating the cause, investigation summary, and mitigation summary fields with specific actionable recommendations.
- Agent notifies the team via Slack. Simultaneously, the agent sends a structured summary to your configured Slack channel: root cause, affected components, blast radius, and recommended next steps – so the on-call team has immediate context without opening multiple tools.
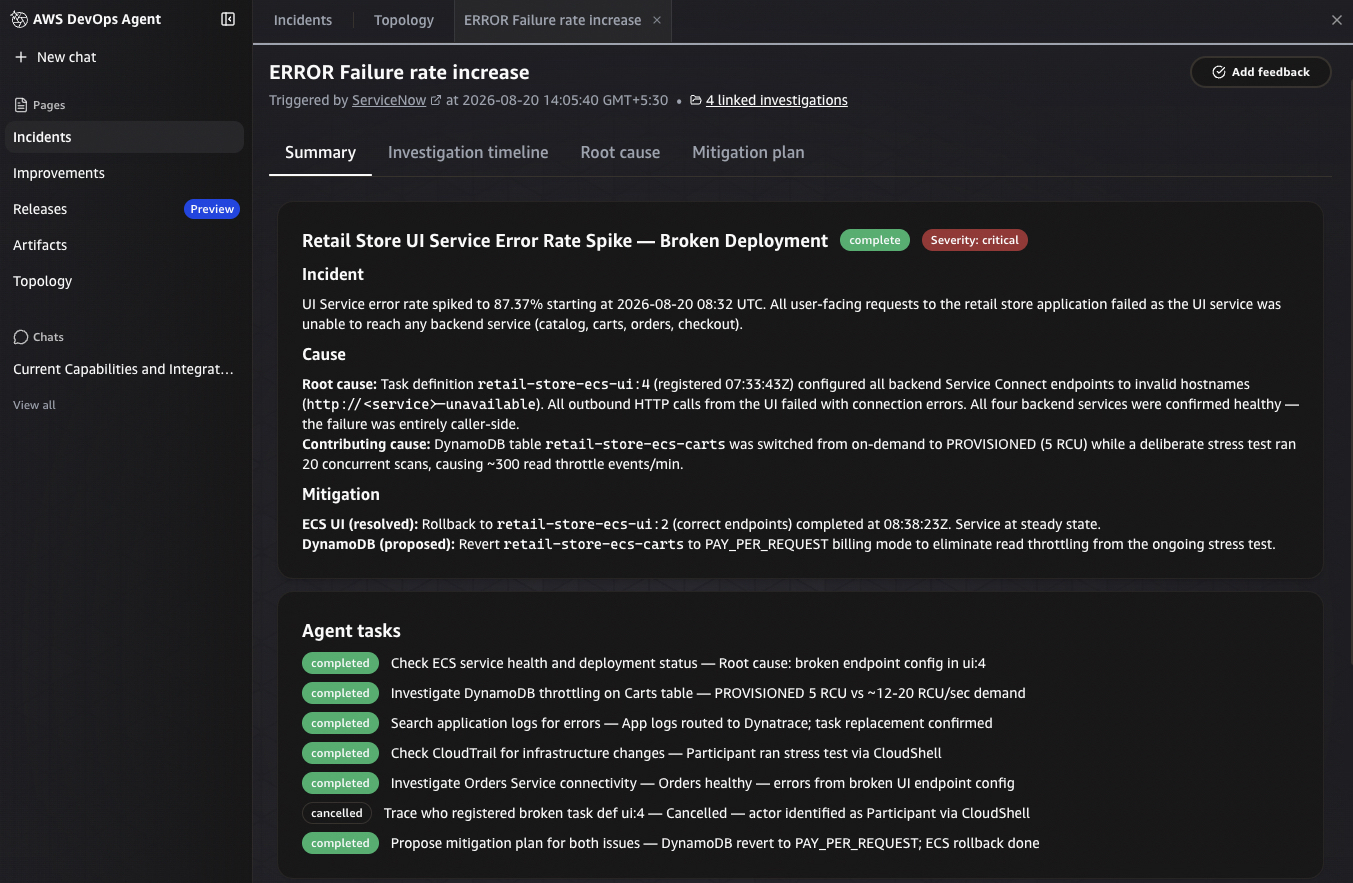
Figure 8: Investigation summary and root cause in the AWS DevOps Agent web app
The result: From incident creation to actionable root cause analysis delivered to your ticketing system and team chat, in minutes, without manual intervention or waking an engineer at 2 AM.
Filtering which incidents trigger an investigation
In production, you may not want every ServiceNow incident to trigger an investigation. You can configure ServiceNow Business Rules with conditions to route only specific tickets. For example, you can create a custom Source (u_source) field and route incidents to different Agent Spaces based on conditions. Incidents where the service is AWS and the source is Dynatrace could route to Agent Space A. Other incidents route to Agent Space B. This gives you fine-grained control over incident routing across multiple Agent Spaces.
Cleanup
To avoid ongoing charges or unintended investigations, remove the resources you created during this walkthrough:
- In ServiceNow, navigate to Business Rules and deactivate or delete the webhook Business Rule you created.
- In the AWS Management Console, navigate to your Agent Space, choose Capabilities → Telemetry, and remove the Dynatrace association.
- Under Capabilities → Communications, remove the ServiceNow and Slack associations.
- If you no longer need the Agent Space, follow the Deleting an Agent Space procedure to remove all associated IAM roles and resources.
Note: Skipping these steps may continue to incur charges for your DevOps Agent Space and associated resources.
Conclusion
In this post, you configured AWS DevOps Agent to autonomously investigate incidents triggered from ServiceNow, query Dynatrace telemetry for root cause analysis, and deliver actionable findings back to ServiceNow and Slack. This pipeline reduces mean time to resolution (MTTR) from hours to minutes and frees your SRE team from repetitive investigation tasks.
The pattern is extensible. AWS DevOps Agent supports built-in integrations with Datadog, New Relic, Splunk, Grafana, PagerDuty, GitHub, GitLab, and Azure DevOps. You can also connect MCP servers to extend further into proprietary systems, and use the Agent-to-Agent (A2A) protocol to delegate subtasks to external agents.
Try it today: Create an Agent Space, connect your monitoring and ticketing tools, and trigger a test investigation. Your next 2 AM incident could be the one nobody has to wake up for.
Hands-on workshop
Want to try this hands-on? The Deep Dive on AWS DevOps with ServiceNow and Dynatrace hands-on workshop helps you run through multiple scenarios using Dynatrace and ServiceNow and learn with step-by-step instructions in a sample environment.
Related resources:
- AWS DevOps Agent User Guide
- Getting started with AWS DevOps Agent
- AWS DevOps Agent – Connecting Dynatrace
- AWS DevOps Agent – Connecting ServiceNow
- AWS DevOps Agent – Connecting Slack
- AWS DevOps Agent – Connecting MCP Servers
- AWS DevOps Agent Workshop