AWS Cloud Operations Blog
Introducing CloudWatch Lambda Insights
CloudWatch Lambda Insights is a monitoring and troubleshooting solution for serverless applications running on AWS Lambda. The solution collects, aggregates, and summarizes system-level metrics including CPU time, memory, disk, and network. It also collects, aggregates, and summarizes diagnostic information such as cold starts and Lambda worker shutdowns to help you isolate issues with your Lambda functions and resolve them quickly.
Lambda Insights uses a new CloudWatch Lambda extension, which is provided as a Lambda layer. When you install this extension on a Lambda function, it collects system-level metrics and emits a single performance log event to CloudWatch Logs for every invocation of that Lambda function. The performance events leverage the embedded metrics format to collocate metrics and metadata. For more information about Lambda extensions, see Using AWS Lambda extensions. For more information about embedded metric format, see Ingesting High-Cardinality Logs and Generating Metrics with CloudWatch Embedded Metric Format.
Enabling Lambda Insights
You can use the Lambda Console to enable Lambda Insights on a given function. Alternatively, you can use the AWS CLI, AWS CloudFormation, the AWS Serverless Application Model CLI (AWS SAM), or the AWS Cloud Development Kit (AWS CDK). Please check the documentation at https://docs.aws.amazon.com/AmazonCloudWatch/latest/monitoring/Lambda-Insights-Getting-Started.html.
Let’s get started
In this blog post, we will create a few “Hello World” Lambda functions and monitor them using Lambda Insights. We will be using the AWS CDK to deploy our architecture.
Deploy the architecture
Run the following commands to clone the Git repository and start the deployment. In this example, I am using Cloud9 (https://aws.amazon.com/cloud9/) to perform the deployment. You are welcome to use your favorite terminal.
git clone https://github.com/aws-samples/aws-cdk-quickstart-lambda-insights
cd aws-cdk-quickstart-lambda-insights
npm install
cd resources && npm install
cdk bootstrap
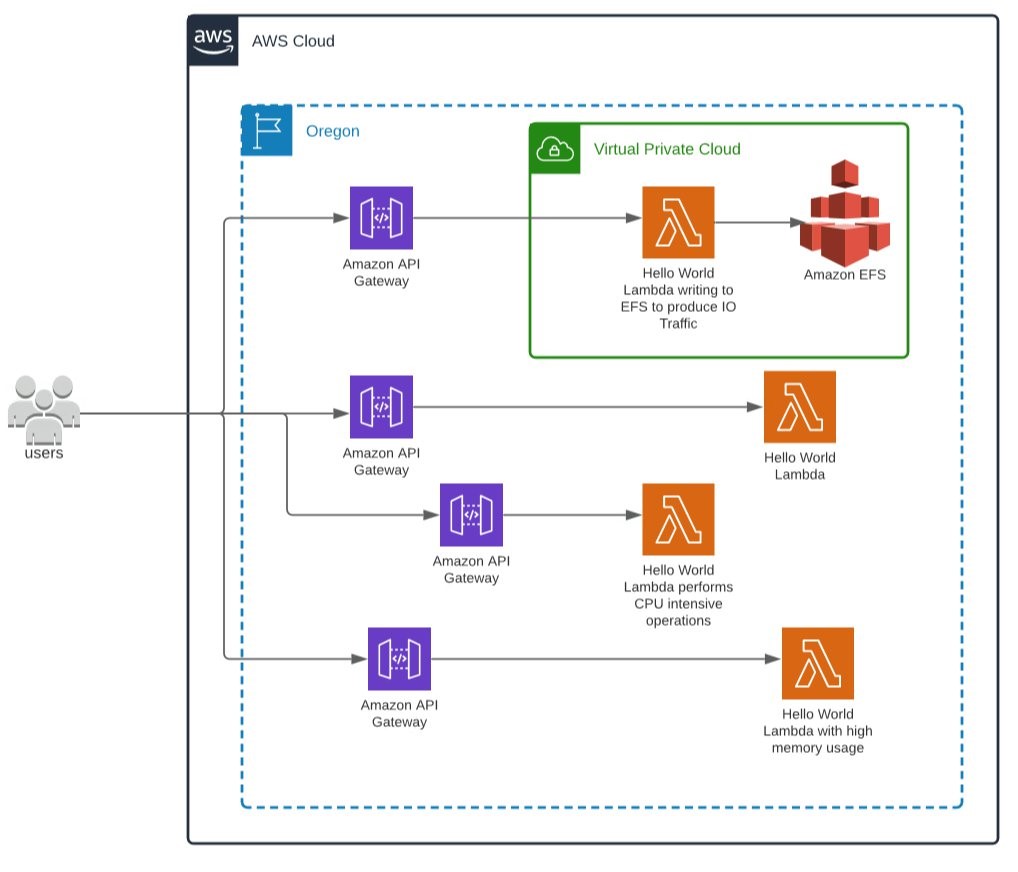
cdk deployThe AWS CDK will deploy the architecture below. It will include:
- A Lambda function which outputs “Hello World!” each time it’s invoked.
- A Lambda function which runs in a VPC and writes dummy data to an EFS volume to mimic network traffic. The Lambda function outputs “Hello World – EFS Lambda!” each time it’s invoked.
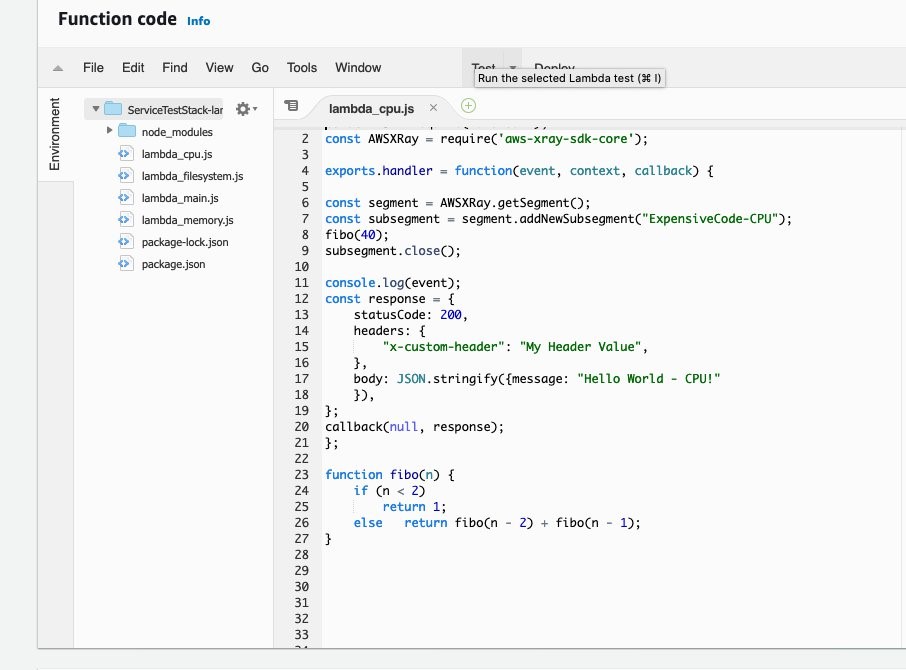
- A Lambda function which performs CPU-intensive operations. We are calculating Fibonacci sequences during the runtime. The Lambda function outputs “Hello World – CPU!” each time it’s invoked.
- A Lambda function which performs memory-intensive operations. We will do that by loading arrays during function runtime. The Lambda function outputs “Hello World – Memory!” each time it’s invoked.
- Each of the Lambda functions will be invoked by an Amazon API Gateway.
Generating Traffic / Test Data
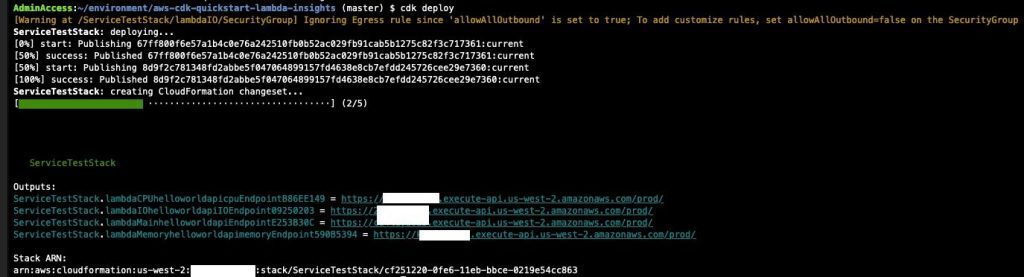
On successful completion of the AWS CDK deployment, you will see a message like this:
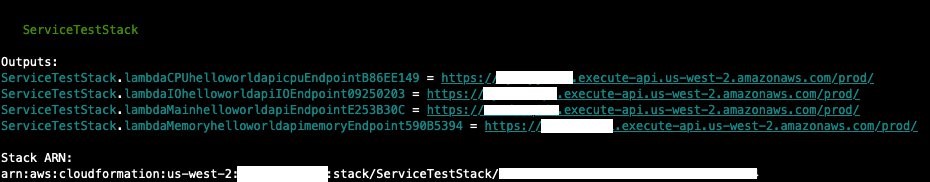
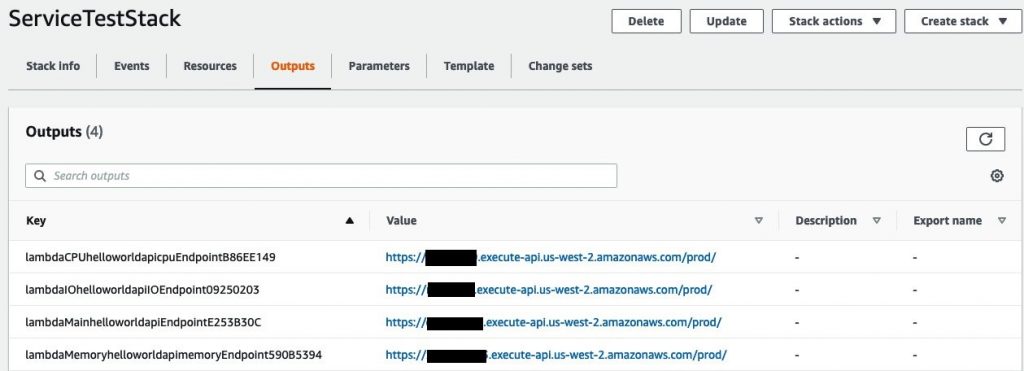
Take a note of each of the 4 URLs. Alternatively, you can also go to the CloudFormation console and search for ServiceTestStack and check outputs. We will use these 4 URLs to generate traffic for each Lambda function using CloudWatch Synthetics.
For each of the 4 URLs, do the following:
- Go to CloudWatch → Synthetics → Canaries and select “Create Canary.”
- Select the default options of “Use a Blueprint” and “Heartbeat Monitoring.”
- Enter any name under Name and paste one of the URLs from CloudFormation/CDK outputs in “Application or Endpoint URL.”
- Keep scrolling down and under “
- Keep the rest of the options as default and select “Create canary” at the bottom of the screen. You will have to wait for 1 minute before the canary is created and starts monitoring your API.
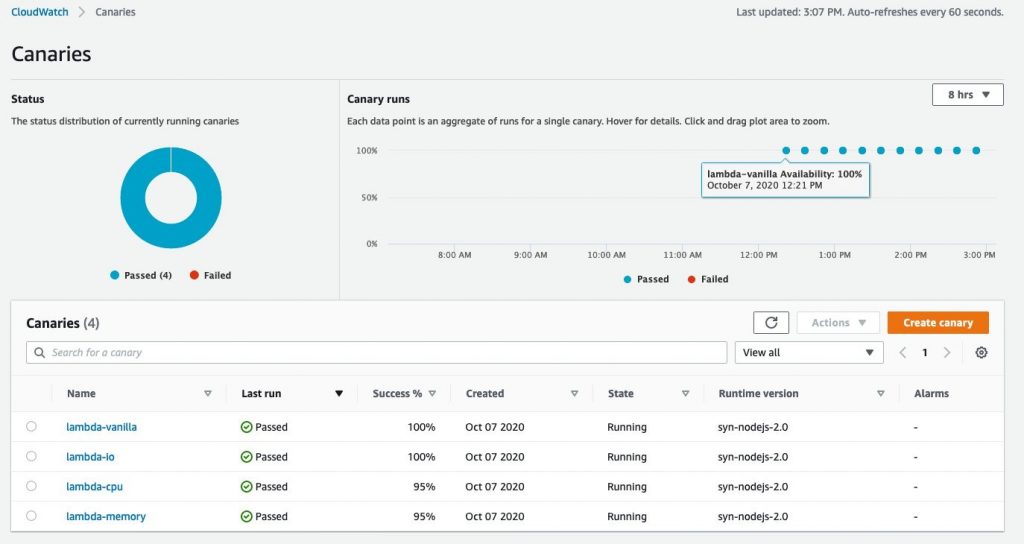
Once you have created canaries for each of the 4 URLs, your CloudWatch → Canaries screen should look like:
Using Lambda Insights (Multi-Function)
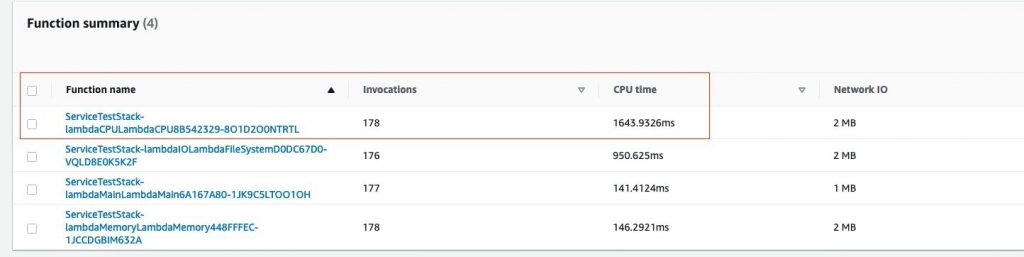
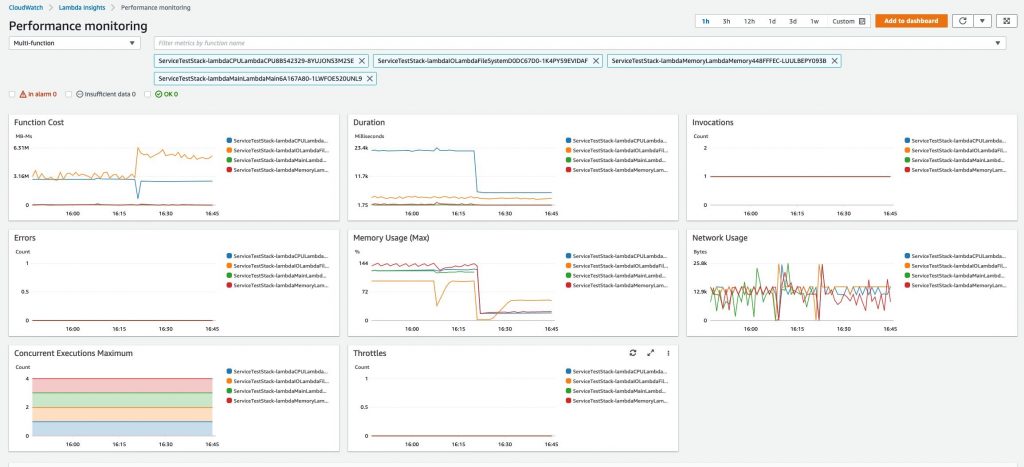
We can go ahead and start looking at Lambda Insights in CloudWatch. To do this, go to CloudWatch and click on “Multi-function” under Lambda Insights. Here, we can observe metrics for the four Lambda functions created by the AWS CDK.

Double-clicking on Duration, we see that the Lambda function “ServiceTestStack-lambdaCPU” is consuming more time.

The Duration metric is comparatively higher than the other due to CPU-intensive statements. Check line number 8 for the Fibonacci function.
Using Lambda Insights (Single Function)
At the bottom of the Lambda Insights Multi-Function page, you can select any of the given Lambda functions to see metrics on a per function basis. Let’s select the Lambda which has the phrase “CPULambda” in it:
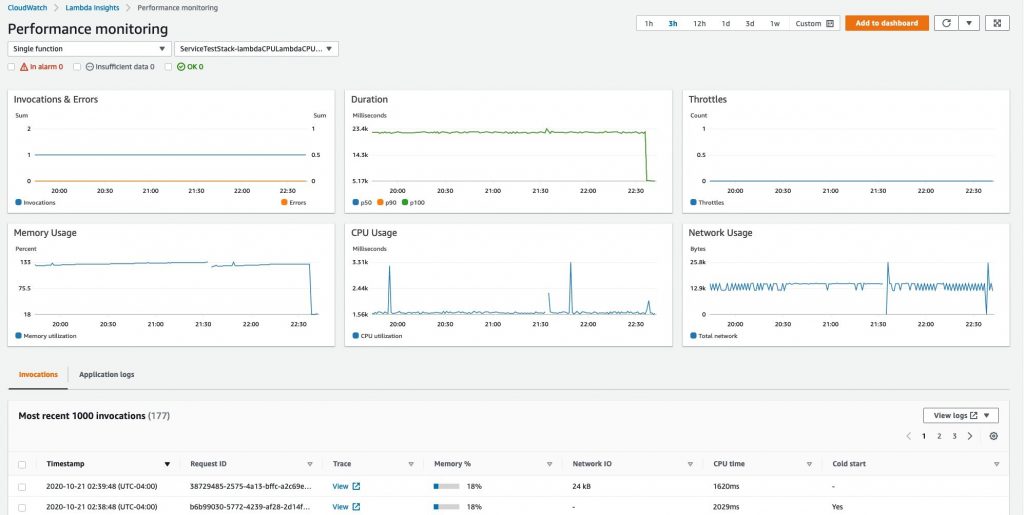
On the next screen, we can see CPU, memory, and network utilization for the selected Lambda function. If you have enabled AWS X-Ray for your Lambda function, the trace for each Lambda execution will be available in the Trace column.
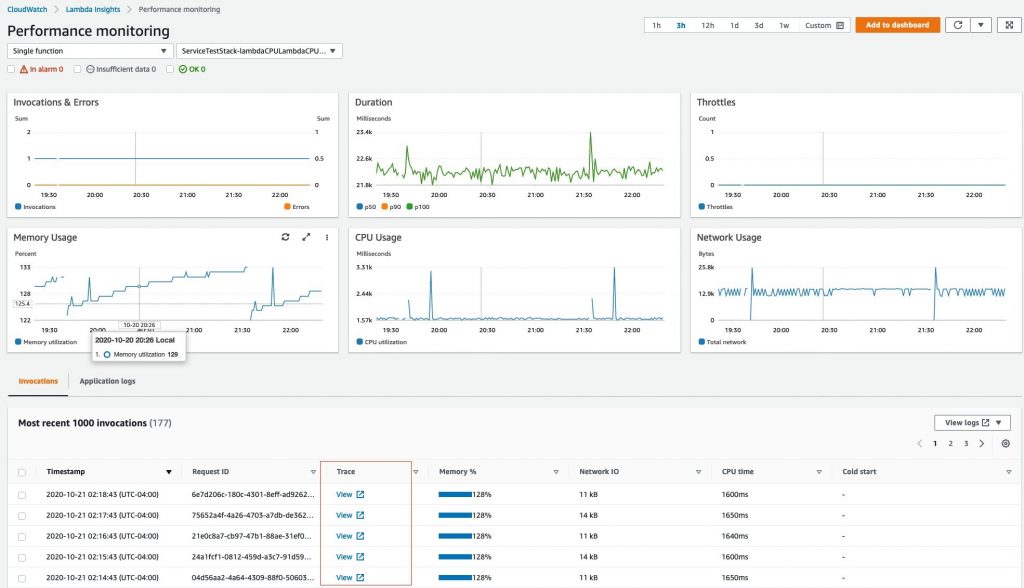
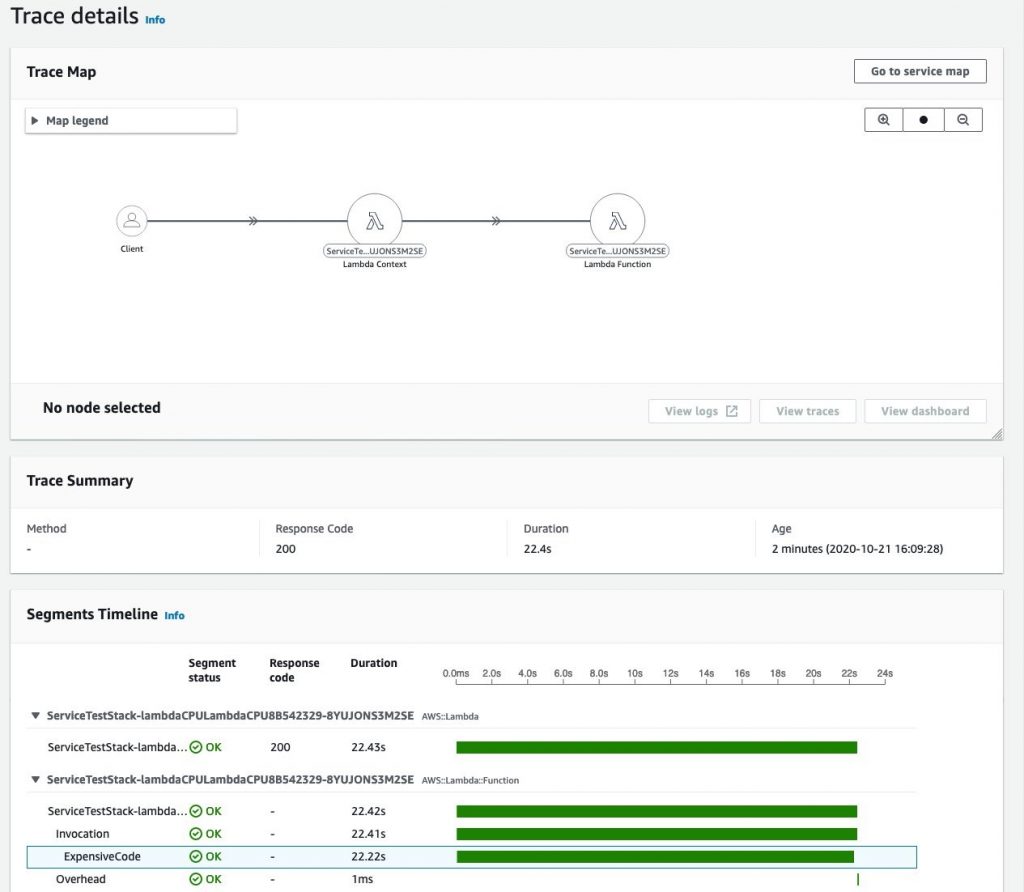
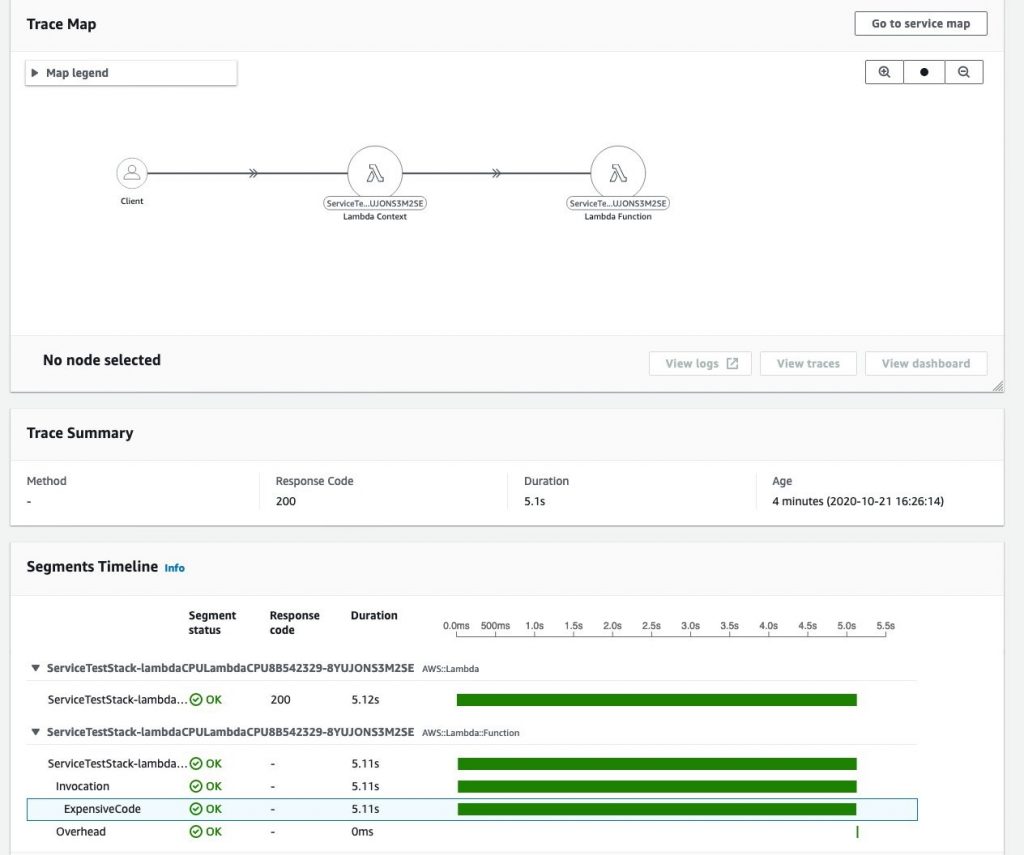
On this page, we are seeing that the function is fully consuming the memory allocated to the Lambda runtime. Viewing a trace also reveals that a significant portion of time is spent in an expensive AWS X-Ray segment (almost 22 seconds).
We will increase the memory allocated to this Lambda function to 512 MB. We can do this in the AWS CDK by going to the folder where the Git repository is cloned and opening the lambda_cpu_service.ts file under Lib. Change the value of 128 to 512 and save the file. You will need to do “cdk deploy“ to push the changes to your Lambda function.

Opening Lambda Insights for the function again shows that both the “Duration” and “Memory Usage” charts have dropped significantly:
Viewing a trace shows the improved numbers for the AWS X-Ray segment running expensive code:
You can perform a similar rightsizing exercise for the other 3 Lambda functions deployed by the AWS CDK. Let’s change the memory allocated to “LambdaMain” and “LambdaMemory” to 512 MB. For the “LambdaIO” function, we will change the memory to 2048 MB.
We can also look at the Lambda logs for a particular event by selecting an invocation and going to View Logs –> View Application Logs. This will take us to CloudWatch Log Insights:


Selecting View Logs → Performance Logs will again take us to CloudWatch Log Insights for Log Group “/aws/lambda-insights”. Here we can see the performance logs of the Lambda function in the Embedded Metric Format (EMF):

Cleanup
Perform the following steps to delete the resources created in this blog post:
- Run “cdk destroy” from the terminal or AWS Cloud9 shell.
- Delete the canaries in CloudWatch Synthetics.
Conclusion
In this blog post, we saw how we can use Lambda Insights to monitor and troubleshoot serverless applications based on Lambda on AWS. To learn more about AWS observability functionalities on Amazon CloudWatch and AWS X-Ray, see One Observability Demo workshop.
About the Author
 Amit Kalawat is a Senior Solutions Architect at Amazon Web Services based out of New York. He works with enterprise customers as they transform their business and journey to the cloud.