AWS Cloud Operations Blog
Monitoring your EC2 server fleet with advanced CloudWatch agent capabilities
Customers who are running fleets of Amazon Elastic Compute Cloud (Amazon EC2) instances use advanced monitoring techniques to observe their operational performance. Capabilities like aggregated and custom dimensions help customers categorize and customize their metrics across server fleets for fast and efficient decision making. Customers need visibility not only into infrastructure metrics (like CPU and memory), but also process-related metrics.
The Amazon CloudWatch agent is an open-source tool that you can use to collect system-level metrics from EC2 instances and on-premises servers that are running Linux or Windows Server. With its advanced capabilities like aggregated dimensions, custom dimensions, collectd and procstat plugins, the CloudWatch agent addresses many monitoring use cases, including the monitoring of large server fleets.
Overview
It is not uncommon to see customers running server fleets that include hundreds, even thousands of EC2 instances. It can be an operational challenge to manage this many instances. In AWS, we use resource tags to categorize the resources by purpose, owner, environment, physical location, or other criteria.
When it comes to monitoring these instances, the same categorization requirements apply to the metrics you are observing. By categorizing and aggregating metrics based on different criteria, system administrators can create more efficient dashboards and reports that allow them to pinpoint operational issues. System administrators can use aggregated metrics to observe the health of their fleets, and if needed, dive into the telemetry of an individual instance.
To categorize the metrics, CloudWatch offers a custom dimensions feature. Custom dimensions are name-value pairs that can be attached to metrics. You can use custom dimensions to search and filter during your reporting practices. Custom dimensions also allow you to create aggregated or rolled-up metrics based on them.
The CloudWatch agent allows you to collect several types of metrics from EC2 instances and on-premises servers. The metrics emitted by the agent are configurable and several infrastructure-related metrics are supported out of the box. In addition to infrastructure-related metric families such as CPU and memory, you can also collect process-level metrics. With its procstat plugin, CloudWatch provides visibility into your individual processes. The agent also supports the collection of collectd metrics, which provide information about the performance of applications like Apache.
In this blog post, I’ll show you how you can configure the CloudWatch agent to send infrastructure and process-related metrics to Amazon CloudWatch. I’ll show you how to add custom dimensions to these metrics so you can categorize them easily. I’ll also show you how to create CloudWatch aggregated metrics that roll up different types of metrics.
Approach
This blog post walks you through a scenario in which a fleet of Apache web servers is monitored by the CloudWatch agent. This setup includes two VPCs that represent a web-based application’s production and test environments. Two Auto Scaling groups associated to these VPCs are responsible for launching EC2 instances in two Availability Zones.
The production and test launch templates assign different user data scripts to these instances. These scripts install software like the CloudWatch agent, Apache web server, and collectd to the instances at startup. Scripts also pull the CloudWatch agent configuration file that is dedicated for that environment from the AWS Systems Manager Parameter Store.
The CloudWatch agent configuration file defines the metrics and their properties (for example, collection interval) that are collected by the agent. In this example, the file defines CPU and memory infrastructure metrics for the EC2 instances. The file also enables the CloudWatch agent procstat plugin to collect Apache process-level metrics. This file is also used to define custom dimensions and aggregations.
Here’s the solution architecture diagram to illustrate our solution approach:

Figure 1: Architectural diagram
Solution walkthrough
Deploy the stack
To deploy the architecture into your AWS environment, use AWS CloudFormation.
The CloudFormation template provided in this post creates the following resources in your account:
- Two VPCs.
- Four subnets in two Availability Zones.
- Two Auto Scaling groups that span two Availability Zones.
- Two launch templates that define instance types and their Amazon Machine Images (AMIs) along with user data scripts, which install the Apache web server and CloudWatch agent onto instances.
- Other supporting resources such as internet gateways, security groups, IAM roles, and more.
Note: You will incur some charges in your AWS account after you deploy this stack.
To start your deployment, please download and use the template at this link.
After you deploy the stack, the Auto Scaling groups that were installed by the template will start deploying EC2 instances on the test and production VPCs. Go to Amazon EC2 console to view the EC2 instances created by the template.
Review the dimensions specified in the agent configuration file
To observe the metrics created by the Amazon CloudWatch agent, open the Amazon CloudWatch console. From the left navigation pane, choose Metrics. On the All metrics tab, choose Custom Namespaces, and then choose CWAgent.
You’ll see how the metrics are organized by different dimension combinations.

Figure 2: Custom dimensions
These categories are created based on the dimensions specified in the CloudWatch agent configuration file that is pulled from the AWS Systems Manager Parameter Store.
To review one of the configurations, open the AWS Systems Manager console and in the navigation pane, choose Parameter Store. Choose the parameter named AmazonCloudWatch-applicationA-test.
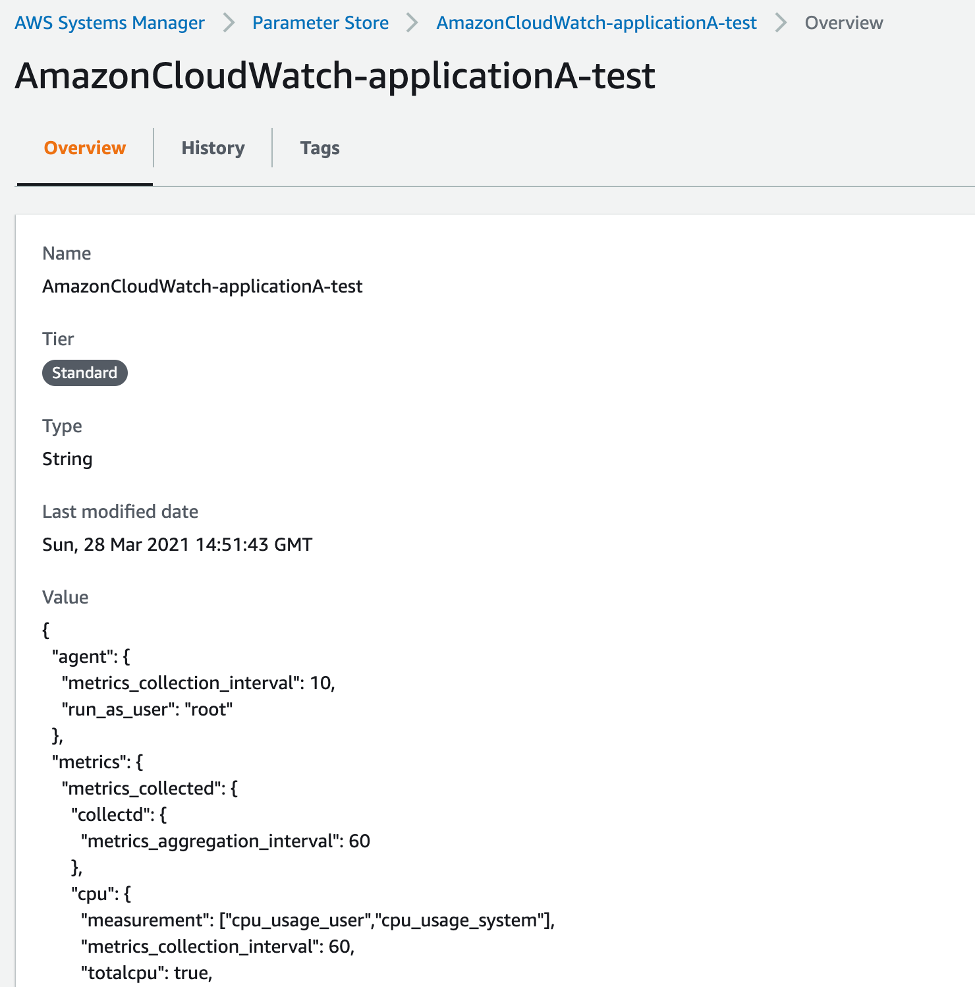
Figure 3: Application configuration in Parameter Store
Filter metrics by custom dimensions
The EC2 dimensions and custom dimensions you saw in the CloudWatch console are defined in the agent configuration file in several ways.
For example, the following section shows how the custom dimensions, ApplicationName, Environment, and MetricType, are attached to CPU metrics.
For information about other Amazon EC2 dimensions that can be used in the global append_dimensions section, see Manually Create or Edit the CloudWatch Agent Configuration File in the Amazon CloudWatch User Guide.
Because you added dimensions to the metrics, you can use them to filter metrics based on different criteria. In the Amazon CloudWatch console, choose Metrics, and then type the following search string under the CWAgent namespace:
ApplicationName=ApplicationA Environment=test process_name=httpd
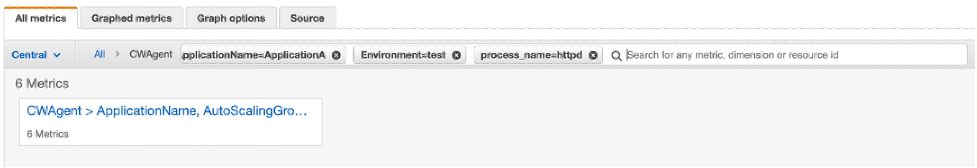
Figure 4: Searching by multiple criteria
Only dimensions following these criteria will be listed. Choose the dimension set to open its metrics view.

Figure 5: Metrics view
You will only see the metrics emitted by the procstat plugin for the test environment now. Review the other dimensions that were not used in your search criteria.
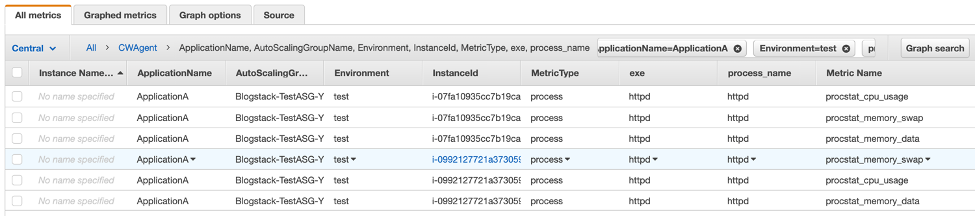
Figure 6: Metrics view details
Aggregated dimensions
CloudWatch allows you to define aggregated or roll-up dimensions. Aggregated dimensions allow you to summarize metrics across multiple resources such as EC2 Auto Scaling groups or custom dimensions. For example, you can aggregate all your CPU metrics in your production environment to see if you need to change the maximum parameter of your Auto Scaling group configuration.
When you work with aggregated dimensions, CloudWatch provides standard statistics such as average, minimum, and maximum. CloudWatch also supports percentiles, which are helpful in cases that exhibit large variances. When you’re observing a large fleet with lots of aggregated metrics, using percentiles can help you more accurately locate operational issues.
The following section of the AmazonCloudWatch-applicationA-test agent configuration file shows how aggregated dimensions are created. You’ll see they’re not attached to a certain metric. Instead, they’re defined as a part of the global aggregation_dimensions field.
Navigate to the CWAgent dimensions list and choose the AutoScalingGroupName dimension.
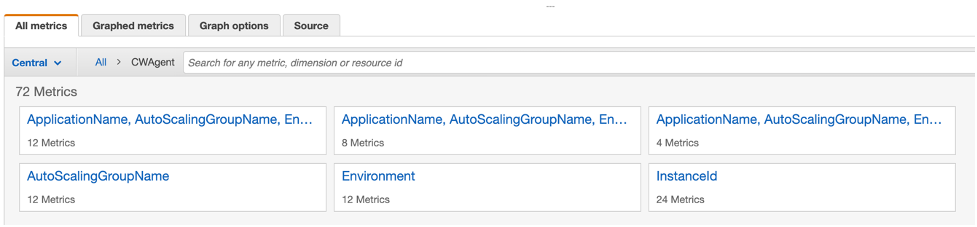
Figure 7: Auto Scaling metrics
See how the metrics are aggregated across all the instances in the Auto Scaling group.
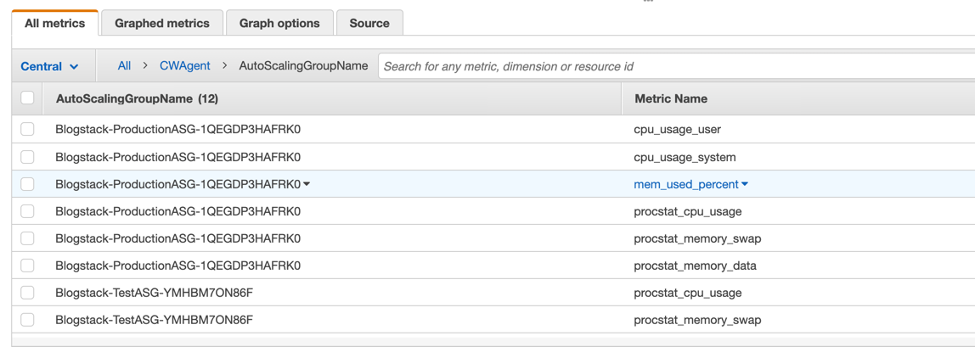
Figure 8: Auto Scaling metrics detailed view
Because you also defined the Environment custom dimension in the aggregation_dimensions field, you can also see the aggregated metrics per environment. To do this, go to the CWAgent dimensions list and choose Environment.

Figure 9: Aggregations per environment
When you’re working with server fleets, Amazon CloudWatch Metrics Explorer can be a useful tool in your toolbox. Metrics Explorer allows you to filter, aggregate, and visualize metrics by tags attached to resources in Amazon EC2, AWS Lambda, Amazon DynamoDB, and more.
Cleanup
To clean up the resources you used in your account, open the AWS CloudFormation console and delete the stack.
Conclusion
In this blog post I showed you how to automate CloudWatch Agent installations with EC2 user data scripts. You pulled CloudWatch Agent’s configuration file from AWS Systems Manager Parameter Store dynamically and analyzed aggregated metrics through Amazon CloudWatch console.
By using the features and techniques described in this blog post, you can monitor your EC2 and on-premises server fleets more efficiently and improve your decision-making process.
For more information, see Common Scenarios with the CloudWatch Agent in the Amazon CloudWatch User Guide.
For information about how to use the procstat plugin to watch process metrics and restart crashed processes, see the Detecting and remediating process issues on EC2 instances using Amazon CloudWatch and AWS Systems Manager blog post.