AWS Cloud Operations Blog
Visualize and gain insights into your VPC Flow logs with Amazon Managed Grafana
Modern IT infrastructure in Cloud is becoming increasingly distributed and data intensive. With the growing number of devices, applications, and users consuming the services, the amount of data being transmitted across networks is increasing rapidly. This increase in data warrants organizations to have visibility in the network traffic. Analysis of network traffic can help in identifying performance issues, detecting suspicious activities, forecasting capacity and troubleshooting.
On AWS Cloud, many services require a Virtual Private Cloud (VPC) or can be integrated with a VPC for network connectivity. VPC flow logs provides you information on how your workloads and AWS resources are communicating over VPC network. Flow logs can be enabled for a VPC, a subnet or a network interface within the VPC. Flow logs data can be sent to Amazon CloudWatch, Amazon S3 or Amazon Kinesis Data Firehose.
Visualizing VPC flow logs can provide valuable insights into your network infrastructure and can be important for several reasons such as:
Network troubleshooting: VPC flow logs contain detailed information about the traffic flowing in and out of your VPC. By visualizing this data, you can quickly identify patterns and anomalies that may indicate network issues, such as misconfigured security groups, routing problems, or unusual traffic patterns.
Security monitoring: VPC flow logs can help you detect and investigate security incidents, such as unauthorized access attempts, or data exfiltration. By visualizing the traffic patterns and flow, you can identify suspicious activity and act to mitigate threats.
Compliance auditing: Visualizing VPC flow logs can help you demonstrate compliance with industry and regulatory requirements. By analyzing the traffic patterns and flow, you can identify potential vulnerabilities and take corrective actions to maintain a secure and compliant infrastructure.
Capacity planning: By visualizing VPC flow logs, you can gain insights into your network traffic patterns and usage trends. This information can be used to optimize your network infrastructure, allocate resources more effectively, and plan for future capacity needs.
This blog post demonstrates how you can utilize Amazon Managed Grafana to visualize VPC Flow logs by using CloudWatch Logs Insights and CloudWatch metrics.
Solution
If you are sending VPC flow logs to CloudWatch, the data can be consumed and analyzed using Amazon Managed Grafana using the following ways
- CloudWatch Logs Insights allows you to query and analyze your log data. CloudWatch Logs Insights automatically discover fields in logs from AWS services including VPC flow logs. It helps you gain insights by running queries on VPC flow logs. CloudWatch Logs Insights queries incur charges based on the amount of the data that is queried.
- Metric filters can be used to generate CloudWatch metrics from VPC logs. You can use these metrics to analyze VPC flow logs and apply alarms as needed.
- Contributor Insights, a CloudWatch feature (to analyze log data and create time series that display contributor data) can also be used to analyze VPC flow logs and create time series that display contributor data. It can generate metrics about the top-N contributors, the total number of unique contributor and their usage.
In this post, we will demonstrate above 3 ways to visualize and analyze VPC flow logs using Amazon Managed Grafana. The diagram below depicts the solution of how VPC flow logs from different Availability Zones can be centrally visualized in Amazon Managed Grafana.
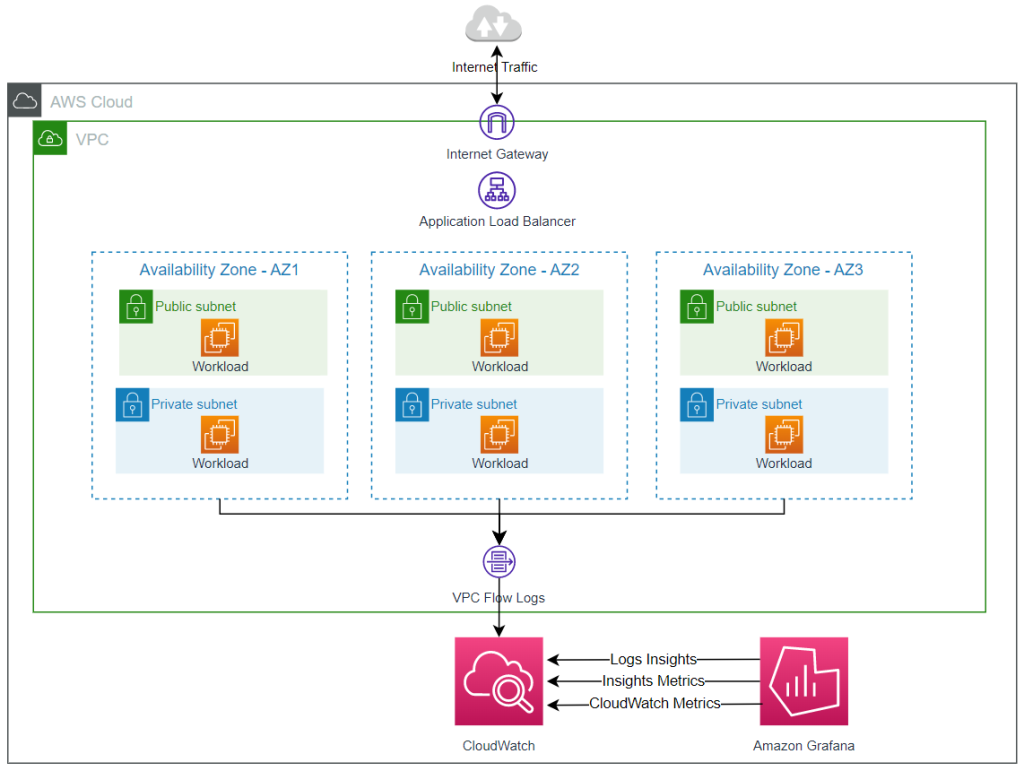
Figure 1: Solution Architecture
Step 1: Deploy the solution
The solution leverages the CloudFormation stack of the VPC flow log analysis dashboard lab. It deploys a VPC, public and private subnets, EC2 instances and DynamoDB table by using two CloudFormation templates for creating the infrastructure and a static website.
Create the Network Infrastructure
- Download the latest version of the CloudFormation template here: vpc-alb-app-db.yaml
- Sign in to the AWS Management Console, select your preferred region, and open the CloudFormation console
- Click Create Stack, then With new resources (standard).
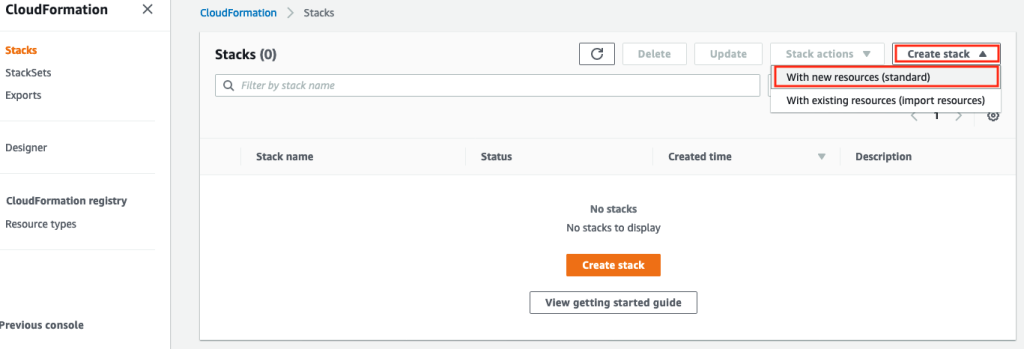
Figure 2: Create stack
- Click Upload a template file and then click Choose file.
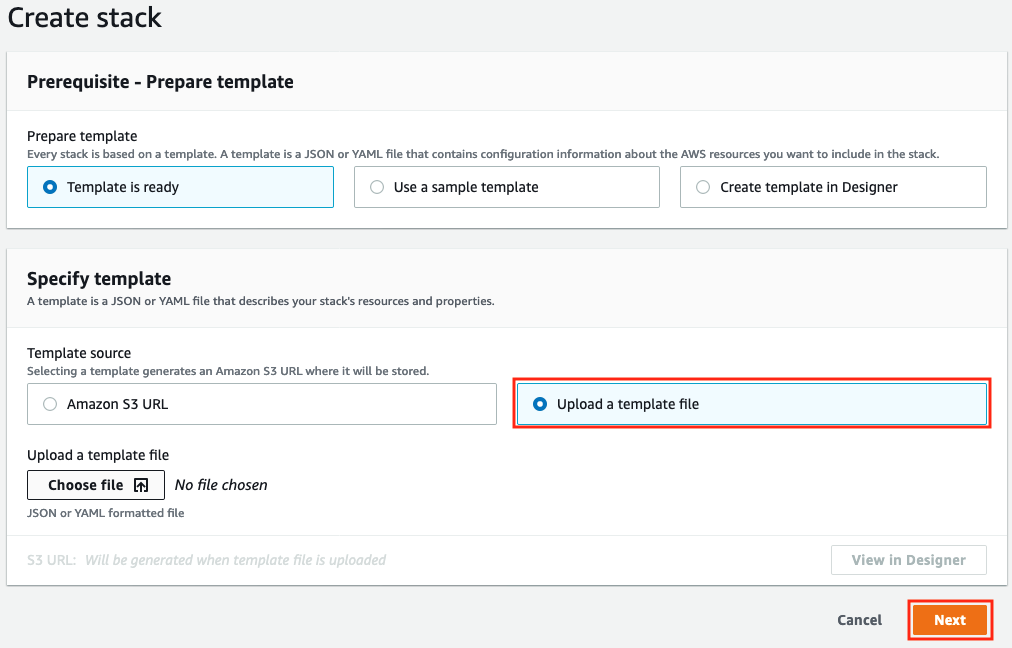
Figure 3: Upload stack from template
- Choose the CloudFormation template you downloaded in point 1, return to the CloudFormation console page and click Next.
- Enter the following details:
-
- Stack name: The name of this stack. For this lab, use WebApp1-VPC and match the case.
- Parameters: Parameters may be left as defaults, you can find out more in the description for each.
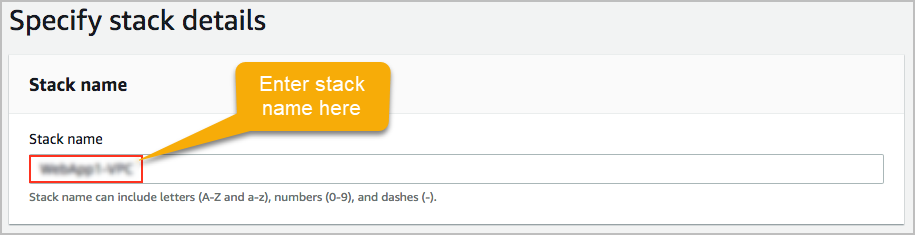
Figure 4: Stack Name
- At the bottom of the page click Next.
- Review the information for the stack. When you’re satisfied with the configuration, at the bottom of the page check I acknowledge that AWS CloudFormation might create IAM resources with custom names then click Create stack.
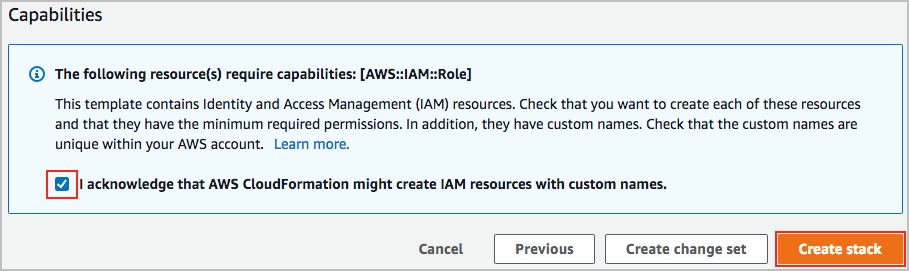
Figure 5: Acknowledgement
- Wait until the VPC CloudFormation stack status is CREATE_COMPLETE, then continue to step 2.
Create the Static Website
- Download the CloudFormation template: staticwebapp.yaml
- Go to the AWS CloudFormation console and click Create Stack > With new resources
- Click Upload a template file and then click Choose file.
- Click Next
- For Stack name use VPCFlowLab
- Click Next
- At the bottom of the page check I acknowledge that AWS CloudFormation might create IAM resources with custom names then click Create stack
- When it shows status CREATE_COMPLETE, then you are finished with this step.
Enable VPC Flow logs with additional details
- Navigate to VPC console and search for WebApp1-VPC.
- Select the VPC and delete the existing flow log
- Create flow log by clicking Actions, Create flow log.
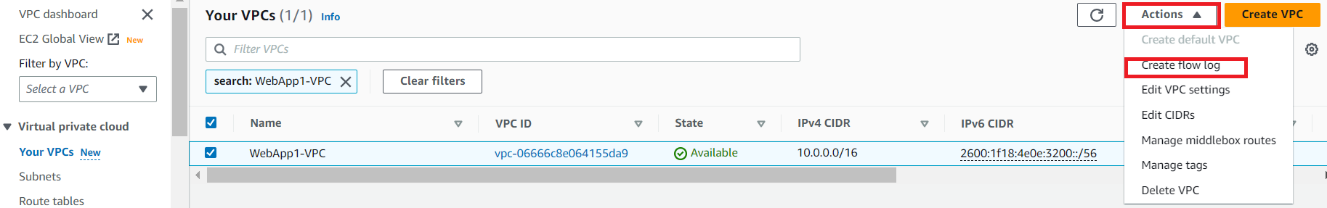
Figure 6: Create flow log
- Select All for the Filter option and ensure that Destination is set to Send to CloudWatch Logs.
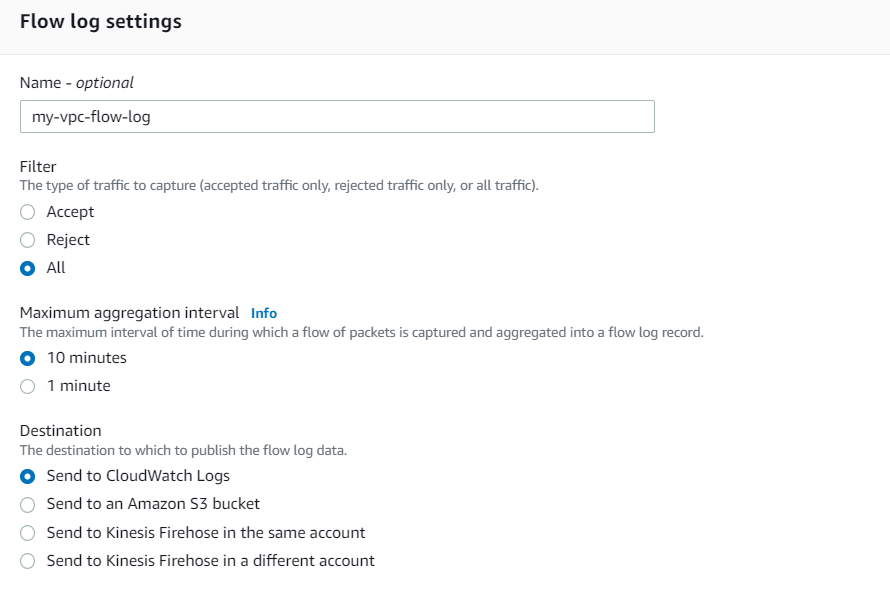
Figure 7: Flow log settings
- Choose the Destination log group and IAM role created by the CloudFormation template as shown below. Name of log group should start with the CloudFormation stack name deployed in step 1
- Change the Log record format to Custom Format and click Select all for the fields to be included in Log format.
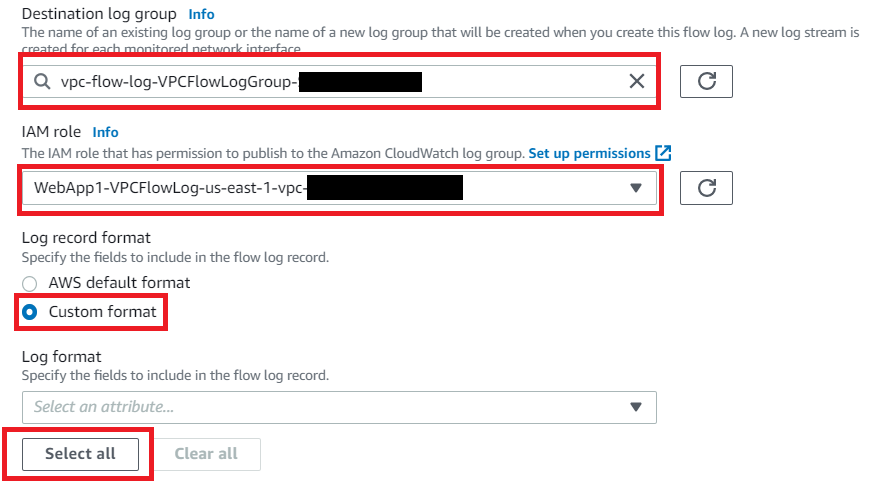
Figure 8: Configure log group and log record format
- Leave rest of the fields to default values and click Create flow log.
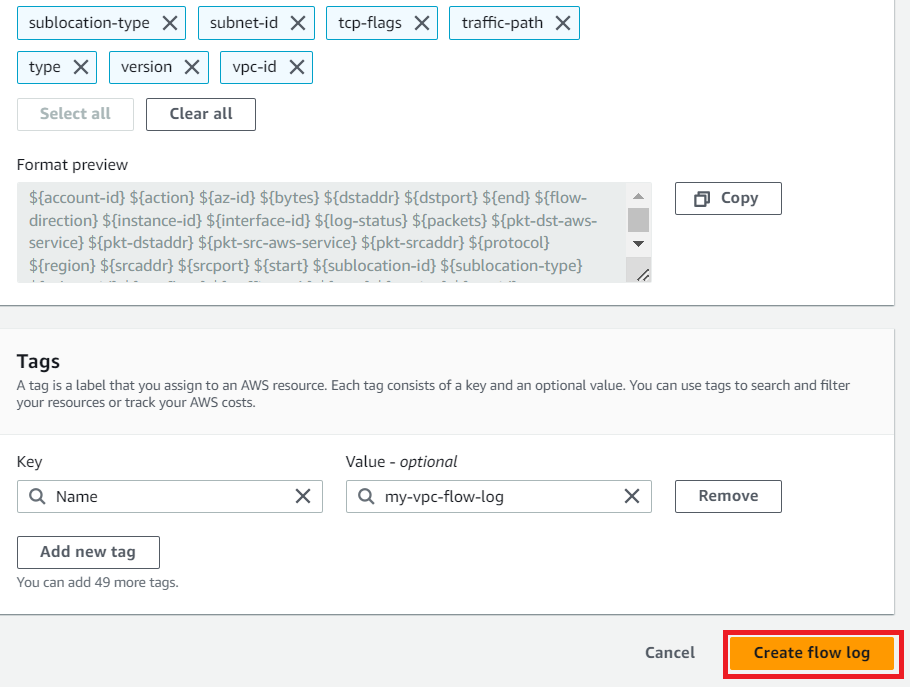
Figure 9: Create flow log confirmation
Step 2: Create metrics from VPC flow logs using metrics filter expression
- Login to CloudWatch Console, and click on Log Groups under Logs in left panel.
- Click on the your VPC flow Log group, and click on Metric filters
- Click on create metric filter
- Under Create filter pattern, type REJECT, for test pattern you can select one of the log streams and click on Test Pattern
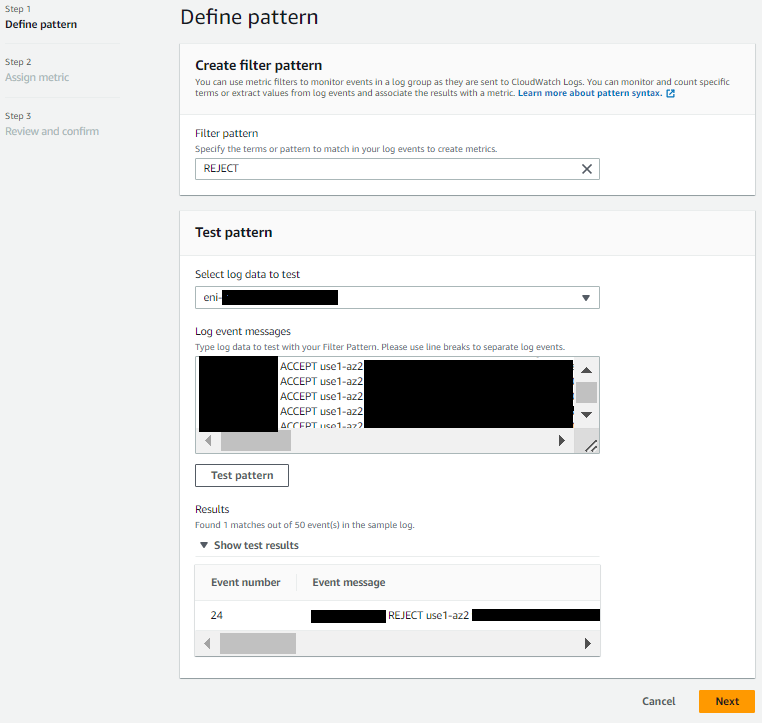
Figure 10: Create filter pattern
- Click Next
- Provide filter name as “Rejected-traffic” and other details as show below
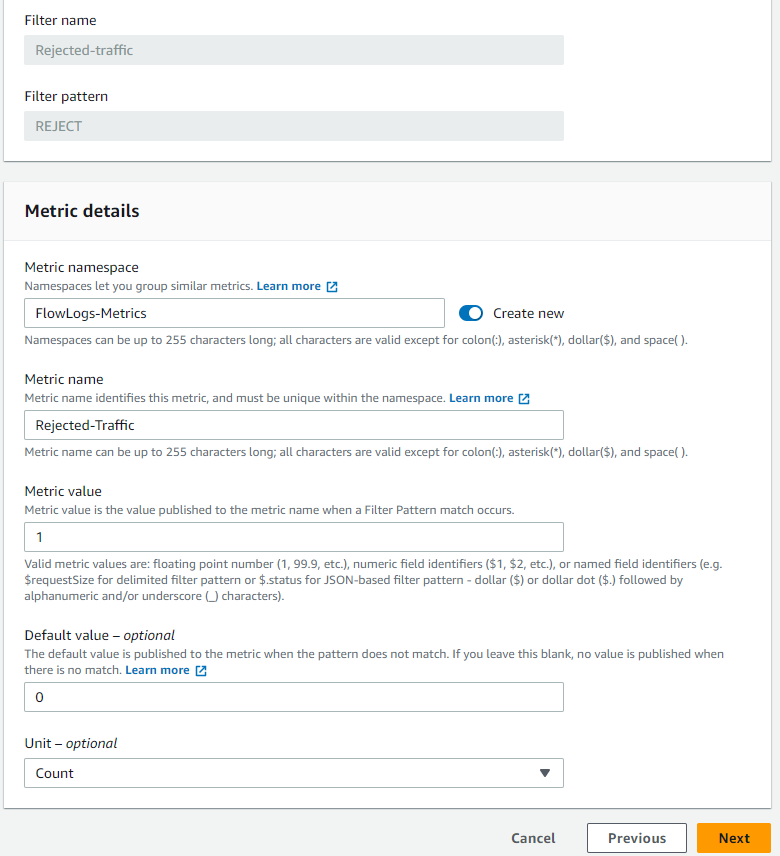
Figure 11: Configure metric details
- Click Next
- Click on Create metric filter
- Go to CloudWatch All metrics and confirm that new namespace is available
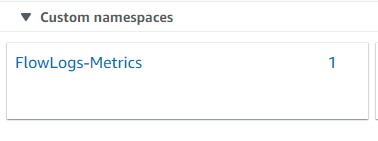
Figure 12: Custom namespaces
- You would be able to see the graph by selecting the metric name under the namespace.
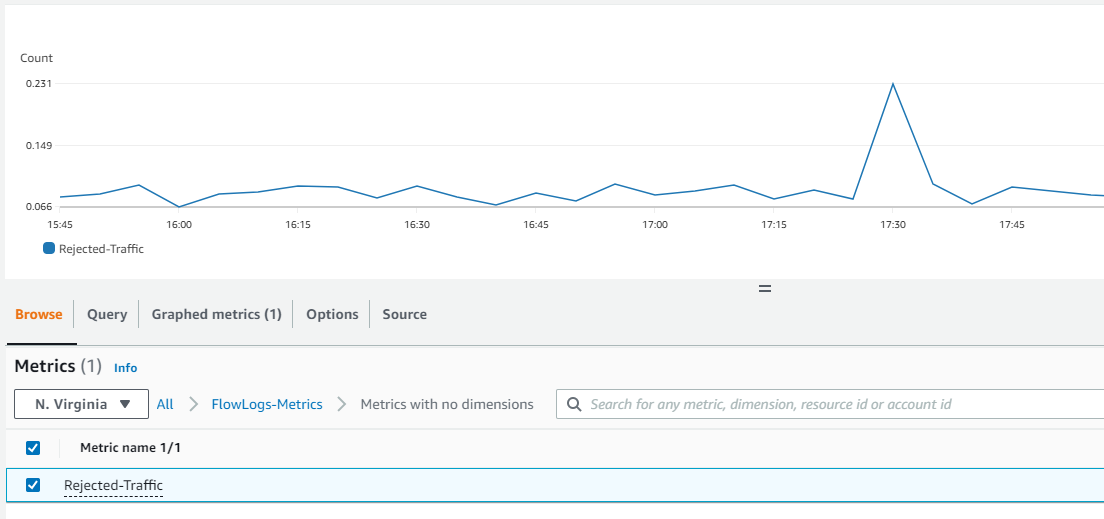
Figure 13: Browse Metrics
You can follow similar steps to create more metrics based on your requirements.
Step 3: Create CloudWatch contributor insights rule
Using Contributor Insights rule, you can create rules to identify the top contributors for VPC traffic such as maximum rejects by subnet ID, maximum TCP resets by source and destination IP etc.
- Login to CloudWatch Console, and click on Contributor Insights under Insights in left panel.
- Click on create rule
- Select VPC flow logs Log group, select sample rule -> VPC Flow logs -> Traffic by Source Address and Action, select CLF as log format, provide positions of srcaddr and action fields in the log line and click Next
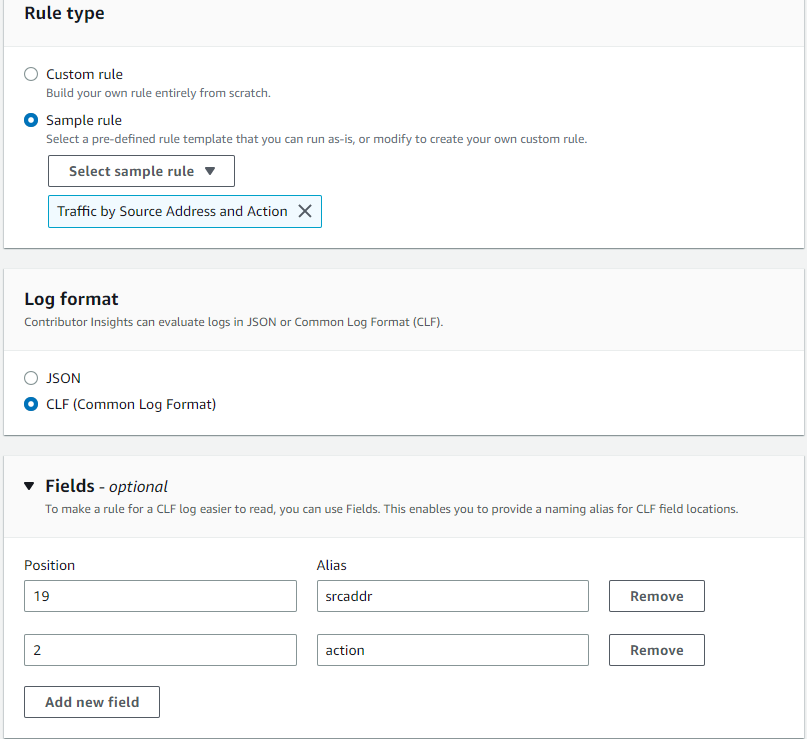
Figure 14: Create contributor insights rule
- Provide a name for the rule as “Traffic-by-source-address-and-action”, and click Next.
- Review rule details and click Create rule
- Once rule is created, you should be able to see the data showing up after few minutes
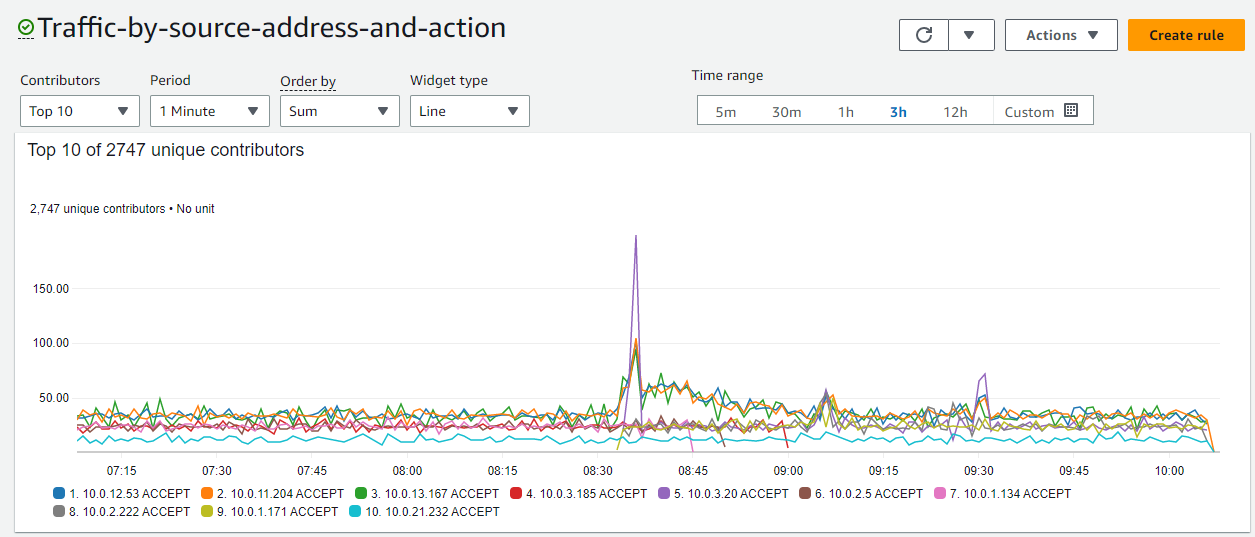
Figure 15: Browse data from contributor insights rule
- Similarly, you can create multiple rules based on your need. Some of the sample rules are available here.
Step 4: Set up Grafana Dashboard
In this step, we are going to create an Amazon managed Grafana workspace and query the VPC flow logs and metrics we created to build a dashboard.
- Follow the link to create a workspace for Amazon Managed Grafana, and set up authentication for it. If you are using a VPC for outbound connections, make sure VPC has connectivity to CloudWatch.
- Login to Amazon Managed Grafana workspace using admin or editor account.
- Hover over aws icon on left panel, and click on Data sources
- Under Services select CloudWatch, select your region for Default region, click on Add data source
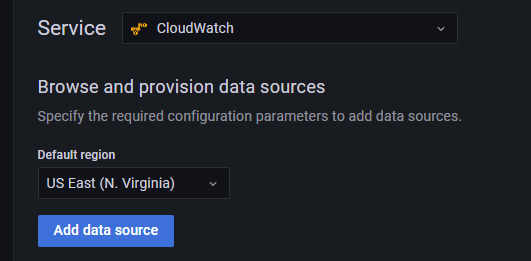
Figure 16: Add data source
- Once data source is added, go to settings for data source and click on Save & test to make sure it is working as expected
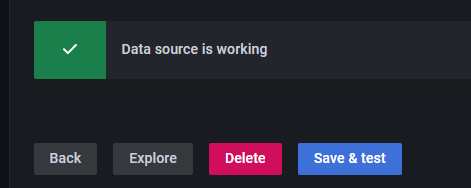
Figure 17: Verify Data source
- Hover over + sign in left panel, and click Dashboard
- Click on add a new panel to add a panel to the dashboard
- Set data source as CloudWatch for the panel
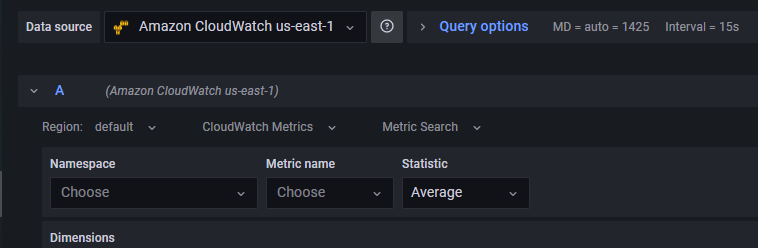
Figure 18: Select data source as CloudWatch
- You can create panel using Logs Insights to query CloudWatch logs. You can use the query shown below to get top 20 source IP addresses with maximum reject. Use Bar gauge visualization for better display
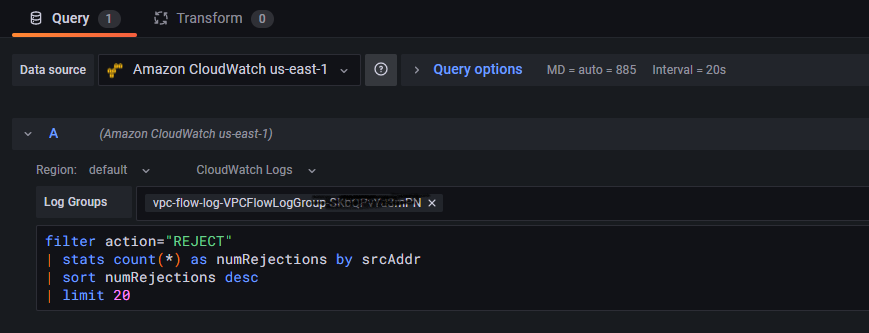
Figure 19: Select CloudWatch Log Groups
This query will build a visualization like one below
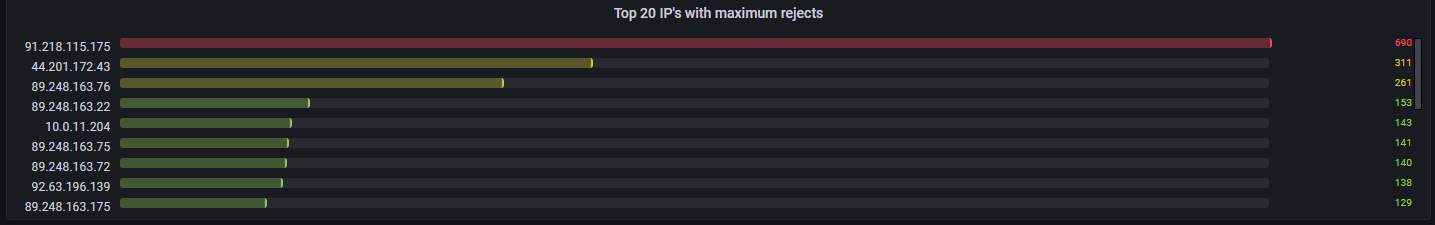
Figure 20: Browse visualization
You can also find some of the sample log insights queries for VPC flow logs.
- Similarly, you can add additional panels and query metrics which we created earlier using Metric filter expression
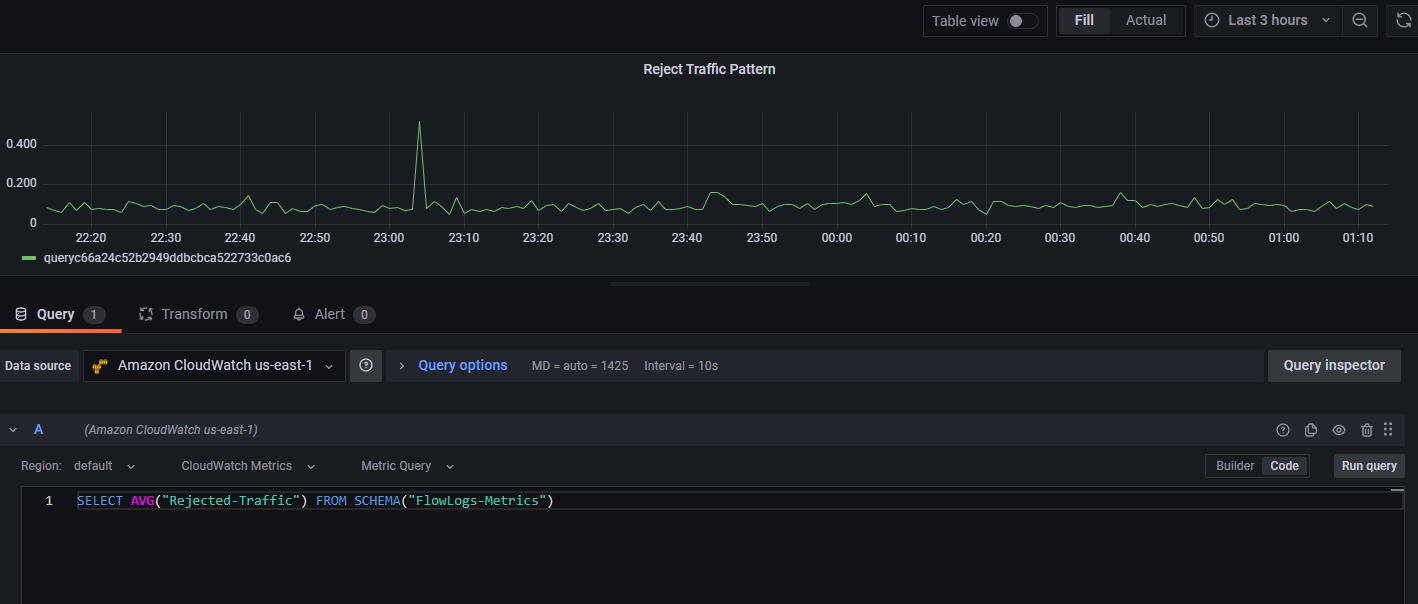
Figure 21: Query using CloudWatch Metrics and Metric filter expression
- You can also create panels by querying the Contributor Insights metrics as below
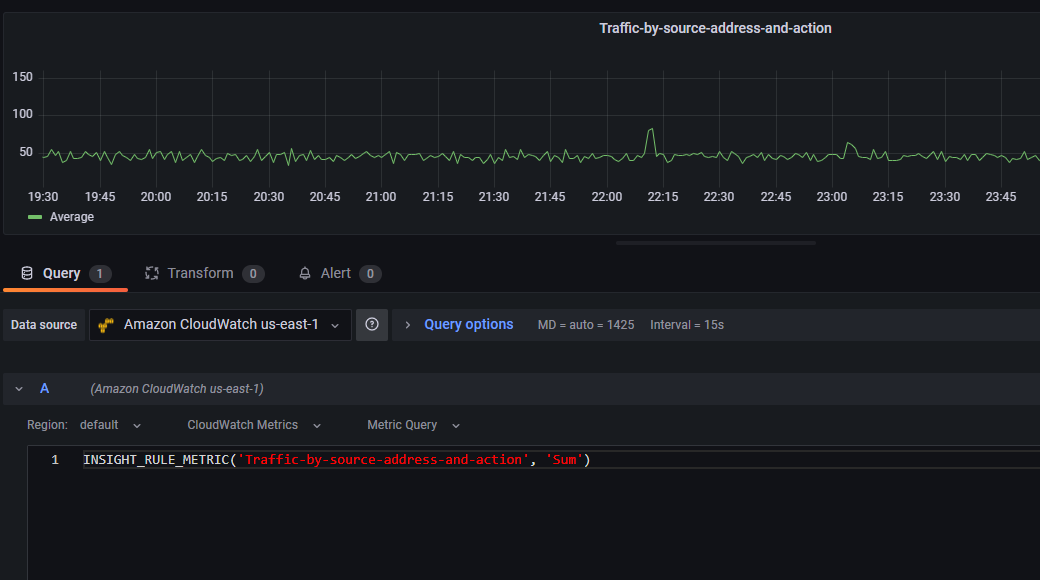
Figure 22: Query using CloudWatch Metrics and Contributor Insights
- Here is a sample dashboard JSON, which you can import and refer for building some useful visualization for VPC flow logs such as:
- Top contributor for bandwidth, accept/reject traffic
- Traffic to specific AWS services
- Traffic to Internet
- Network latency
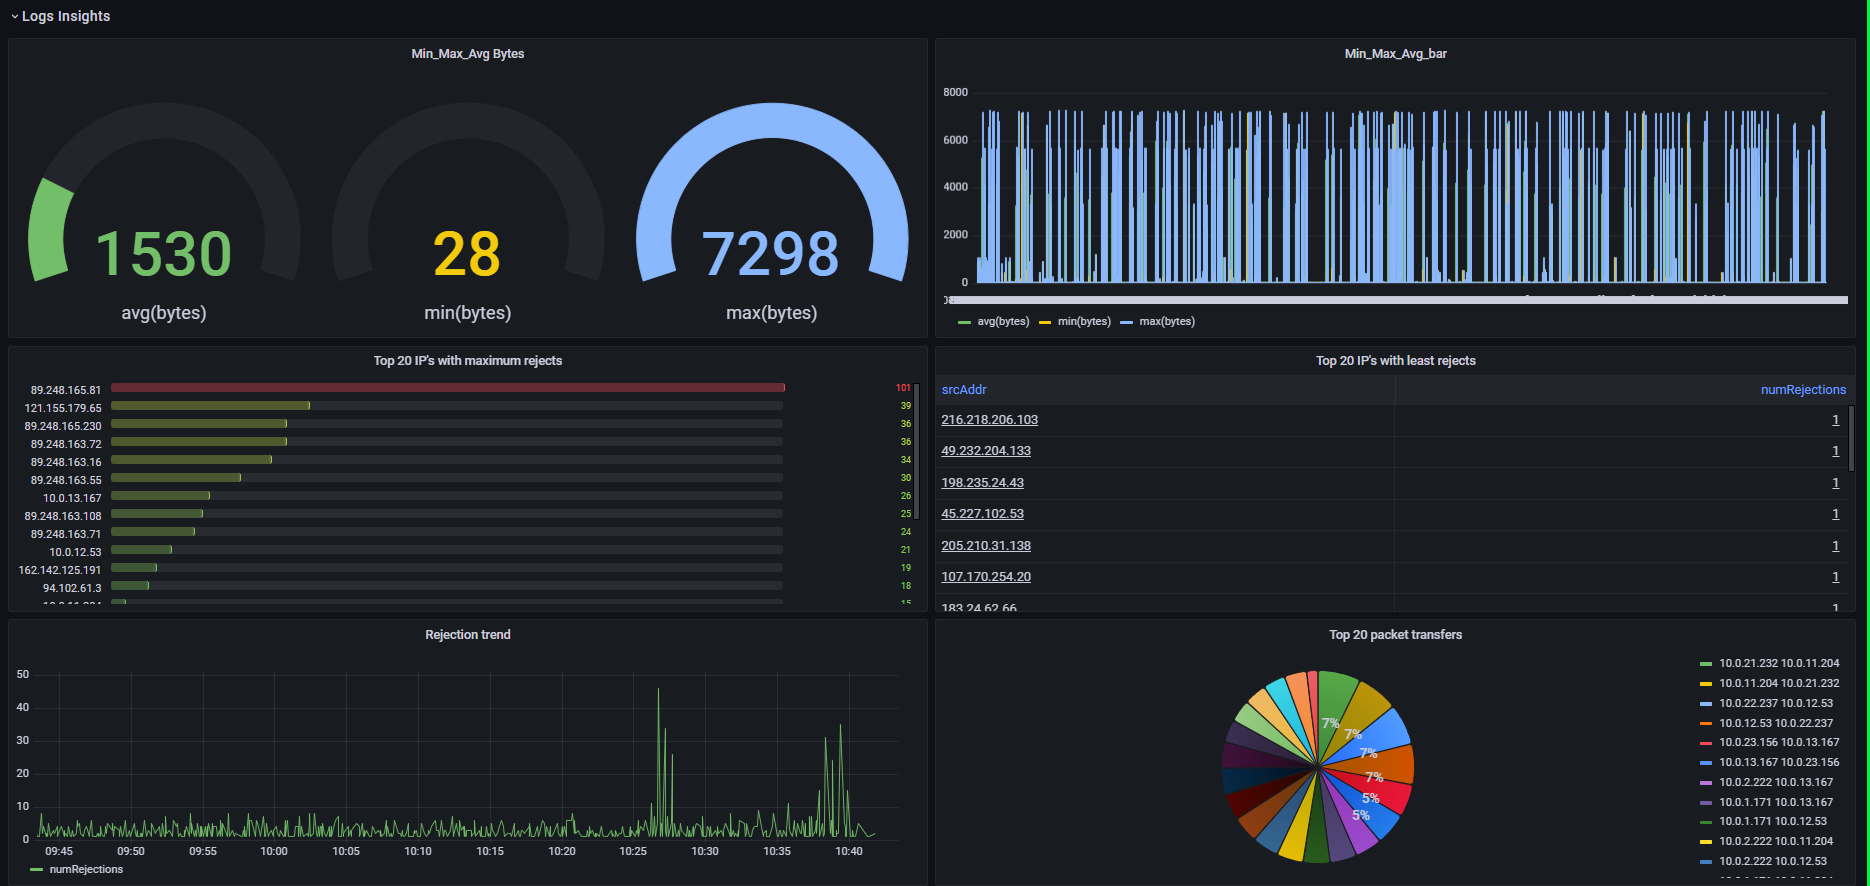
Figure 23: Panels created from CloudWatch Logs Insights – Part I
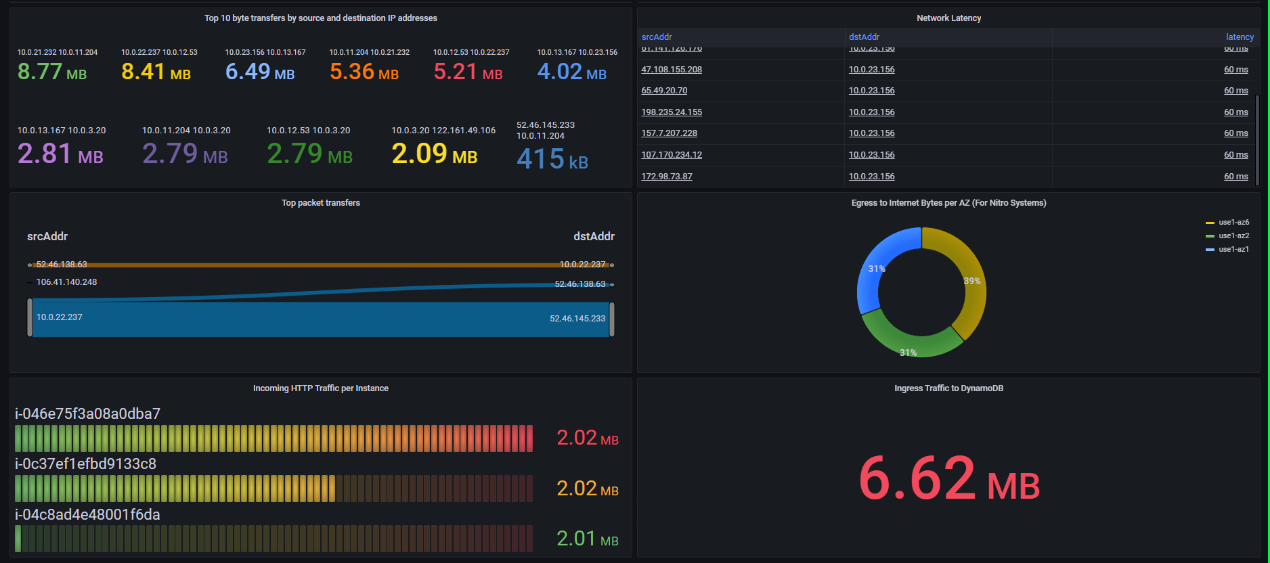
Figure 24: Panels created from CloudWatch Logs Insights – Part II
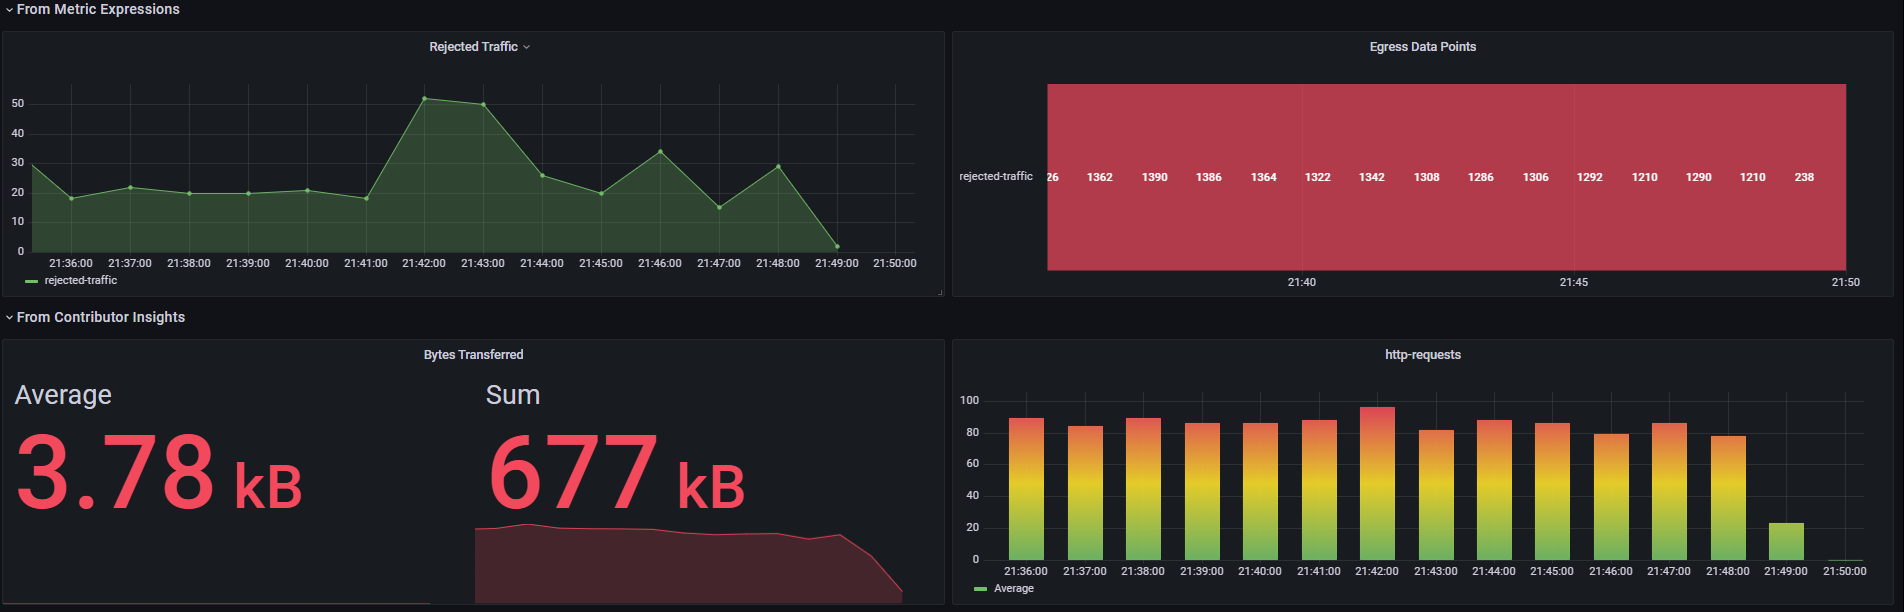
Figure 25: Visuals created from Metric Expressions & Contributor Insights
Clean Up
To avoid the incurring charges, delete the resources you created by following the instructions above in the following order:
- Delete the CloudFormation Stacks
- Delete the Contributor insight rule
- Delete Log Group, and Contributor Insights rules
- Delete Amazon Managed Grafana workspace
Conclusion
In this post, we learned how to query CloudWatch logs and metrics from Amazon Managed Grafana workspace to build visual insights from your VPC logs.
About the authors: