AWS Open Source Blog
Tag: observability

Building a Prometheus Remote Write Exporter for the OpenTelemetry Python SDK
In this post, AWS intern engineers Azfaar Qureshi and Shovnik Bhattacharya talk about their experience building the OpenTelemetry Prometheus Remote Write Exporter for Python. They share their experiences in tackling challenges they faced while building this tool, which is used for sending metrics to Prometheus protocol-based service endpoints. As software deployments become increasingly more complex, […]

Set up cross-region metrics collection for Amazon Managed Service for Prometheus workspaces
Amazon Managed Service for Prometheus is a Prometheus-compatible monitoring service for container infrastructure and application metrics that makes it easy for customers to securely monitor container environments at scale. In a previous getting started blog post, we showed how to set up an Amazon Managed Service for Prometheus workspace and ingest metrics from an Amazon […]

Configuring Grafana Cloud Agent for Amazon Managed Service for Prometheus
This post was written by Robert Fratto, Imaya Kumar Jagannathan, and Alolita Sharma. The Grafana Cloud Agent is a lightweight alternative to running a full Prometheus server. It keeps the necessary parts for discovering and scraping Prometheus exporters and sending metrics to the backend, which in this case is the Amazon Managed Service for Prometheus […]

How Netflix uses Deep Java Library (DJL) for distributed deep learning inference in real-time
This post was written by Stanislav Kirdey, Lan Qing, Lai Wei, and Lu Huang. Netflix is one of the world’s largest entertainment services with over 260 million members in more than 190 countries. One of the ways Netflix is able to sustain a high-quality customer experience is by employing deep learning models in the observability […]
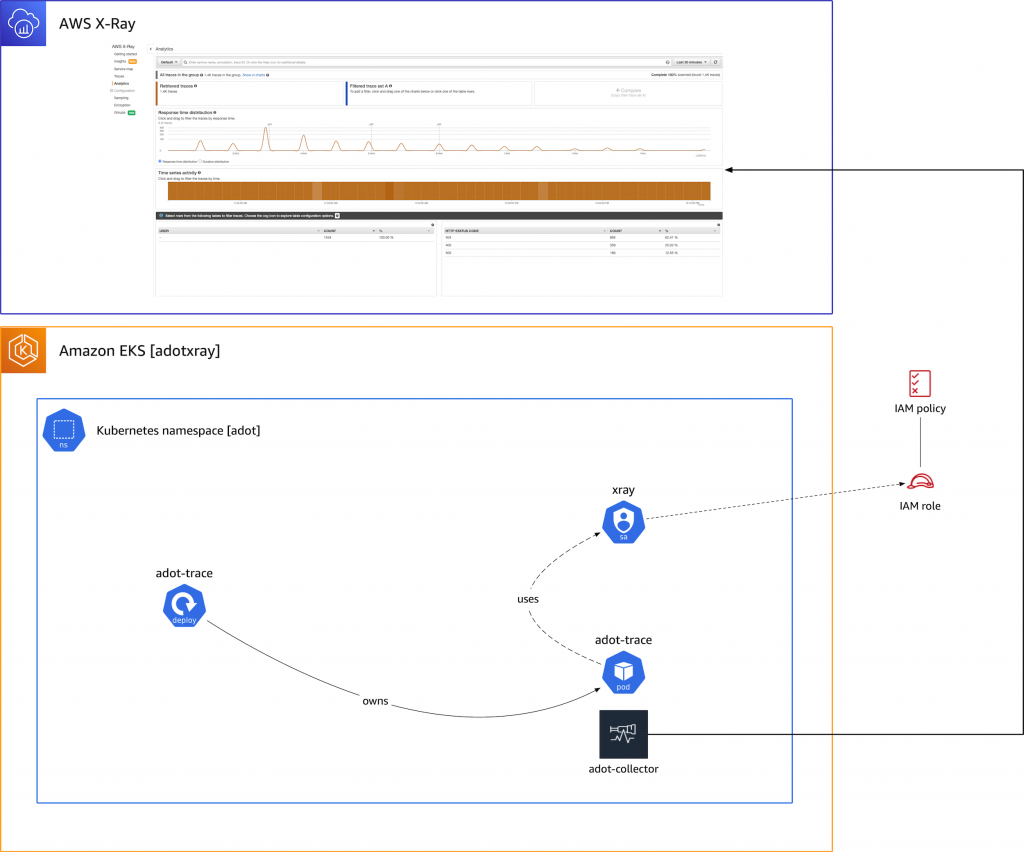
Migrating X-Ray tracing to AWS Distro for OpenTelemetry
In the context of containerized microservices, we face the challenge of being able to tell where along the request path things happen and efficiently drill into signals. As a developer, you don’t want to fly blind and one popular way to provide these insights is distributed tracing. In this post we walk through migrating a […]