AWS Storage Blog
Data-driven planning for cloud migration using AWS Storage Assessment
Data is the foundation of AWS Cloud migration, and choosing the right storage services is one of the earliest, most critical decisions enterprises face. Migrating to AWS storage is a chance to get right-size: you drop the wasted capacity you’ve been paying for and avoid the hardware refresh cycle that makes on-premises scaling so painful. However, incorrect storage sizing risks performance bottlenecks, cost overruns, or availability gaps that could derail your migration. A data-driven storage assessment removes the guesswork.
The AWS Storage Assessment solves this by collecting actual performance and capacity telemetry from your existing infrastructure and analyzing it to produce specific AWS service recommendations, with right-sized configurations and accurate cost models. A 2023 Enterprise Strategy Group (ESG) analysis found that migrating on-premises workloads to AWS can reduce storage costs by up to 66% over 3 years through right-sizing and lifecycle management. The assessment accepts data from automated discovery tools, VMware exports, AWS discovery platforms, third-party tools, vendor-native monitoring, or a simple flat file template. You can start regardless of what tooling you have in place today.
The assessment maps your existing workloads across AWS’s storage portfolio: Amazon Elastic Block Store (Amazon EBS) for block, Amazon FSx for NetApp ONTAP for unified file and block (NFS, SMB, iSCSI), Amazon FSx for Windows File Server for SMB workloads, Amazon FSx for OpenZFS for low-latency NFS workloads, Amazon FSx for Lustre for parallel compute and machine learning (ML) training, Amazon Elastic File System (Amazon EFS) for scalable NFS, Amazon Simple Storage Service (Amazon S3) for object and archive, Amazon S3 File Gateway for hybrid file access to Amazon S3, and AWS Backup for centralized data protection. The assessment helps select the right service and configuration for each workload.
In this post, we walk through the Storage Assessment process, from data collection to workload analysis and service recommendations. You will explore the decision framework for service selection, understand how workloads are classified and mapped to AWS services, and review a real-world business case example.
Overview of an AWS Storage Assessment
A Storage Assessment is a data-driven analysis of your on-premises storage infrastructure, run end-to-end by AWS Migration Solutions Architects at no cost to you. It provides the data points you need to understand what running your storage workloads on AWS will cost, what performance you can expect, and which services fit your requirements, without requiring any commitment to migrate. The result is a comprehensive total cost of ownership (TCO) you can feed into a broader application assessment, an AWS Optimization and Licensing Assessment (OLA), or other cloud migration business case. OLA is a complimentary program that models deployment options based on actual resource utilization and third-party licensing, helping customers reduce Windows Server license costs by 77% and SQL Server costs by an average of 45% and making it a natural companion to the Storage Assessment. You can run assessments multiple times as your environment evolves, or as you evaluate different migration strategies.The following table summarizes the two paths to results.
| Quick assessment | Comprehensive assessment | |
| Timeline | 2–5 days | 1–4 weeks (discovery) + 2 days (results) |
| Data source | Existing exports (VMware, storage-vendor monitoring tools, spreadsheet) | Automated multi-vendor discovery (7–30-day collection) |
| Best for | Initial budget conversations, executive presentations | Detailed migration planning, procurement justification |
| Output | Service recommendations with directional costs | Workload-specific sizing, detailed cost model, architecture |
Both paths produce a business case document built on that TCO. The quick path delivers fast, directional service recommendations and costs from existing data. The comprehensive path adds performance validation based on peak and average workload patterns captured over the collection period, plus migration architecture recommendations.Although running a full discovery tool provides the best data to build the storage mappings and business case, you don’t need to deploy a new tool to begin. The assessment ingests data from the following sources:
- Automated multi-vendor discovery – NetApp Data Infrastructure Insights (DII) supports over 100 storage models from multiple vendors, collecting performance and capacity telemetry automatically.
- VMware export – RVTools provides virtual machine (VM) and datastore information. The assessment uses workload classification to identify application types and map them to appropriate services.
- AWS discovery platforms – The AWS Transform discovery tool discover server inventory in your organization to prepare for migration. The tool supports VMware vCenter, Microsoft Hyper-V, and imported servers.
- Third-party assessment tools – Cloudamize and ModelizeIT provide infrastructure discovery data that feeds directly into storage analysis.
- Storage vendor monitoring tools – NetApp Active IQ, Dell InsightIQ, and similar platforms export data that the assessment can consume.
- Manual entry – You can also use an Excel template for environments where automated collection isn’t feasible or for quick directional estimates.
You can start today with existing data, then add automated telemetry collection for deeper analysis when you’re ready for detailed planning. The Storage Assessment is run end-to-end by an AWS Migration Solutions Architect, who scopes the engagement, runs the analysis, and delivers the business case. Separately, you can have a do-it-yourself approach that uses AWS Transform, which offers self-service storage analysis capabilities directly from your AWS console.
How the assessment works
The assessment follows a six-step process, as illustrated in Figure 1. The steps include collecting telemetry from your existing infrastructure, analyzing workload characteristics, and delivering service recommendations with sizing and cost models.
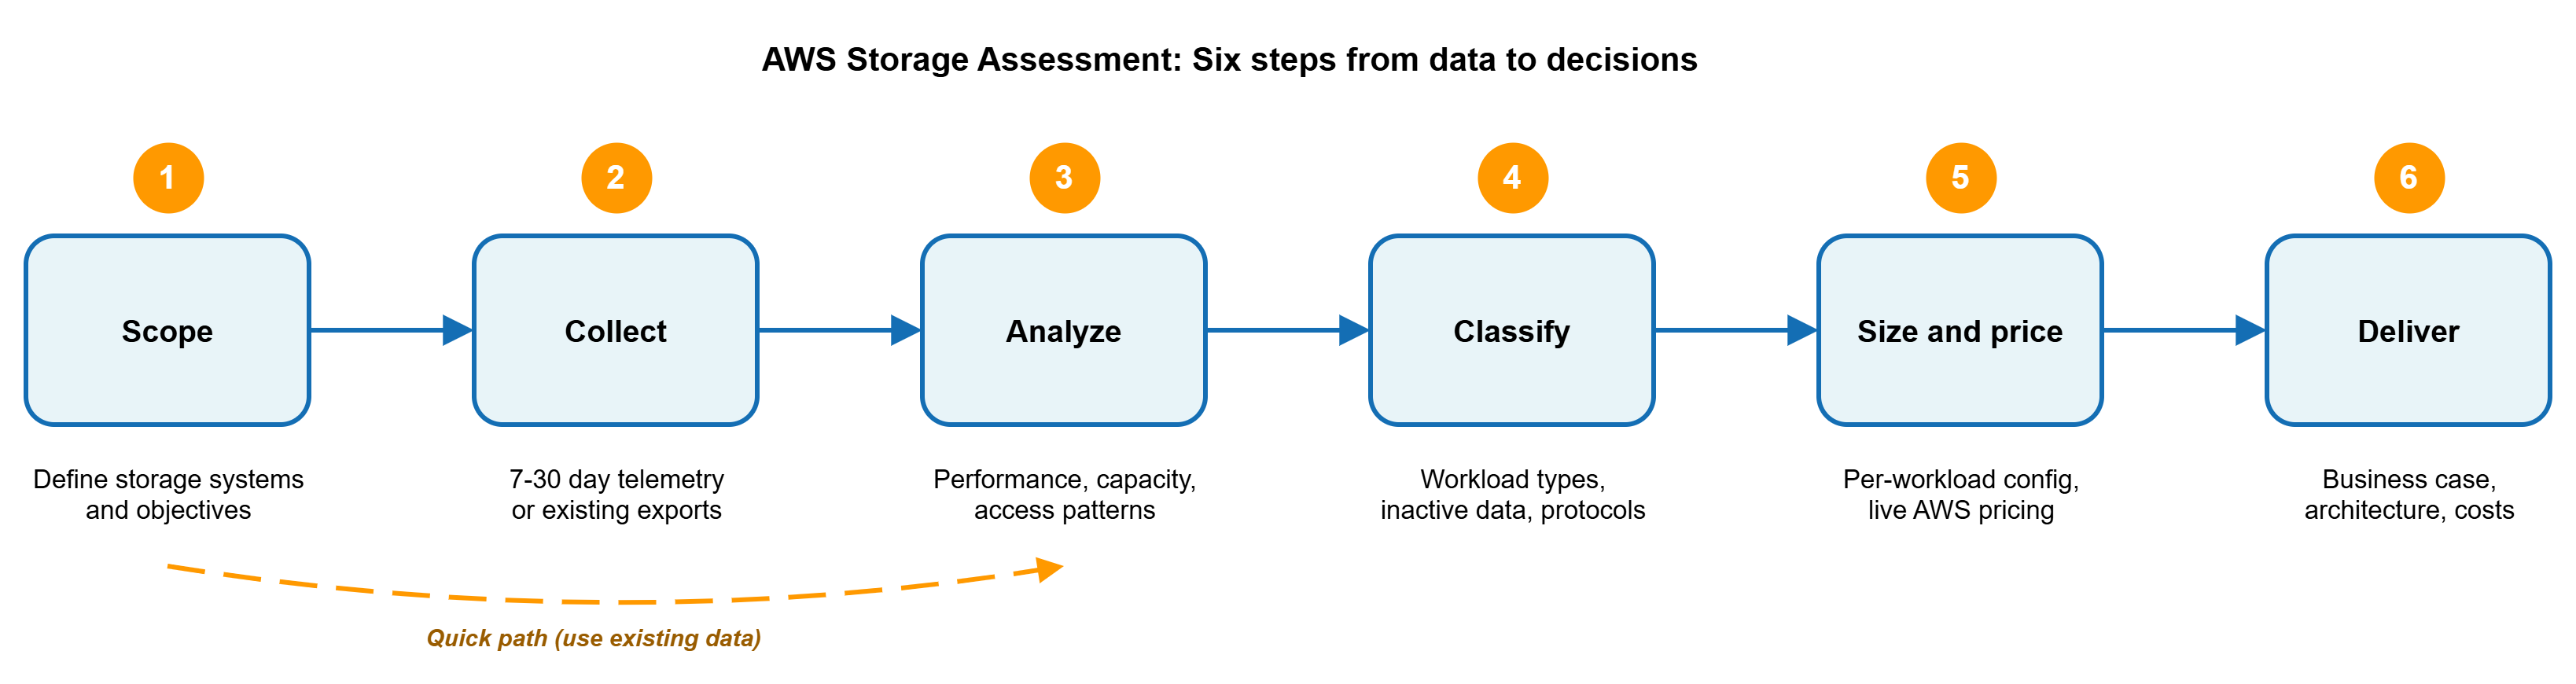
Figure 1: AWS Storage Assessment process
Data collection
The primary automated collection method is NetApp Data Infrastructure Insights, a cloud-based monitoring platform that connects SAN arrays, NAS filers, backup appliances, physical servers, and hypervisors across vendors. Figure 2 shows the data collection architecture.
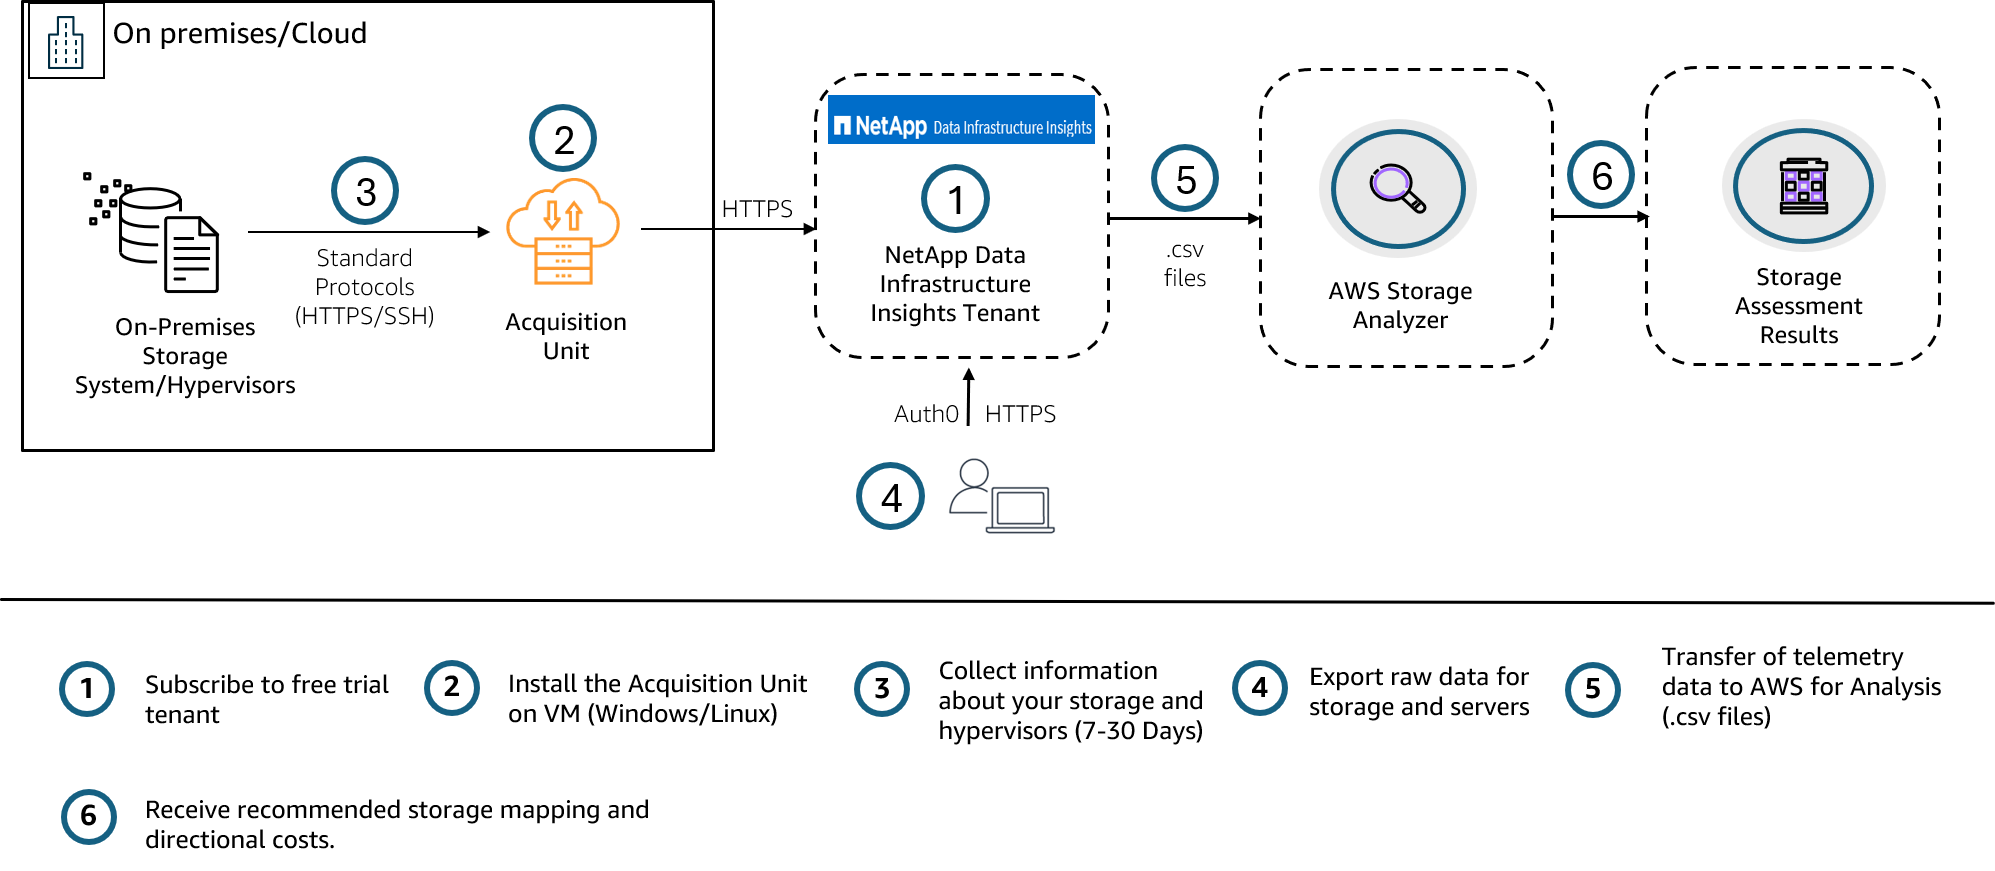
Figure 2: Data collection and assessment architecture
The architecture contains the following key deployment characteristics:
- Agentless and read-only – No software is installed on storage arrays or host; it connects to storage and hypervisor management interfaces only, with no impact to production workloads.
- Outbound-only – No inbound firewall rules are required; optional proxy configuration is available.
- Multi-vendor – A single platform supports over 100 storage models from NetApp, Dell EMC, Pure Storage, HPE, Hitachi, IBM, and others.
- 7–30-day collection period – The solution captures daily patterns, weekly cycles, and monthly peaks to establish representative workload behavior.
For environments where automated collection isn’t feasible, the assessment works with point-in-time data from VMware exports (RVTools), vendor-native monitoring platforms, third-party discovery tools, or manual flat file entry.
What gets collected
Data collection covers four categories across storage arrays, pools, volumes, shares, LUNs, VMs, and datastores:
- Capacity – Raw, allocated, and used capacity; thin provisioning ratios; snapshot space; space savings from deduplication, compression, and compaction.
- Performance – IOPS (read, write, total) at storage, pool, and volume levels; throughput in MBps; latency in milliseconds; I/O density (IOPS per TiB).
- Workload characteristics – I/O size distribution; read/write ratios; sequential versus random patterns; peak versus average utilization over the collection period.
- Configuration – Storage protocols (NFS, SMB, iSCSI, FC); disk types and tiers; snapshot and replication schedules; QoS policies; RAID levels.
From data to recommendations
The assessment analyzes collected telemetry to determine service selection based on multiple factors evaluated simultaneously:
- Protocol requirements determine service compatibility – NFS workloads map to FSx for ONTAP, FSx for OpenZFS, or Amazon EFS. SMB workloads map to FSx for Windows File Server or FSx for ONTAP. iSCSI and FC workloads map to Amazon EBS or FSx for ONTAP for shared block storage.
- Performance characteristics drive tier selection – General workloads up to 80,000 IOPS use Amazon EBS gp3. Mission-critical databases requiring more than 80,000 IOPS or sub-millisecond latency use Amazon EBS io2 Block Express. Throughput-intensive sequential workloads use Amazon EBS st1 or sc1 for cold workloads.
- Capacity and tiering inform storage configuration – For FSx for ONTAP, the assessment determines SSD tier percentage for hot data and capacity pool allocation for warm and cold data based on actual I/O density patterns.
- Availability requirements determine deployment configuration – Single-AZ for standard workloads, Multi-AZ for business-critical workloads requiring 99.99% availability.
- Data protection requirements come with additional costs to the overall sizing – This includes backup retention modeling, disaster recovery architecture, and cross-Region replication costs.
The output is specific: each workload receives a service, configuration, and validated monthly cost from live AWS pricing. For example, Amazon EBS gp3, 500 GB, 3,000 IOPS, 125 MBps; Amazon EBS io2 Block Express, 1 TB, 50,000 IOPS, sub-millisecond latency; or Amazon FSx for NetApp ONTAP, 2 TB SSD, 68% capacity pool, 384 MBps throughput.
What the assessment discovers
Beyond mapping workloads to services, the assessment applies analytical intelligence that surfaces findings manual analysis typically misses.
Inactive storage identification
In the enterprise environments we assess, it’s common to find that a significant share of provisioned storage capacity, often a third or more, shows zero I/O activity during the collection period. These inactive volumes (sometimes called zombie volumes) consume expensive primary storage. The assessment identifies them by analyzing IOPS and throughput patterns over the full collection window, giving you data to support archival or decommissioning decisions.
Automatic workload classification
Rather than requiring manual tagging of every volume, the assessment identifies workload types automatically: databases, file servers, backup repositories, application servers, and archive systems. Classification uses multiple signals including name patterns, protocol characteristics, and performance behavior. Each classification carries a confidence score, and workloads below threshold are flagged for human review rather than silently misclassified.
Right-sizing from actual utilization
On-premises storage is almost always over-provisioned. The assessment sizes AWS services based on actual peak utilization during the collection period, not provisioned capacity. For example, a volume provisioned at 2 TB but peaking at 400 GB is sized to 400 GB plus headroom, not 2 TB. In the assessments we run, sizing to used rather than provisioned capacity commonly reduces costs by 40–60%.
Storage efficiency accounting
AWS storage services with built-in deduplication, compression, and compaction can reduce capacity by up to 65% depending on workload type. The assessment applies vendor-aware efficiency modeling so it never double-counts savings the target service already delivers.
I/O-density-based data tiering
For services with tiered storage, the assessment classifies data as hot or cold by IOPS density (IOPS per GB used), routing performance-sensitive data to SSD and infrequently accessed data to capacity pool tiers. In the NAS environments we assess, often only 10–30% of data is actively accessed, so tiering the rest to the capacity pool can reduce storage costs by roughly 60–80% compared to SSD-only placement.
Data protection cost modeling
The assessment models data protection costs alongside primary storage: AWS Backup with retention policy calculations across daily, weekly, monthly, and yearly recovery with per-server staging costs, and cross-Region replication with bandwidth and capacity growth projections. Including these costs from the start gives a complete picture of total AWS storage spend.
Scenario analysis
Migration planning involves evaluating multiple strategies. The assessment supports rapid scenario analysis from a single data collection: compare AWS Regions, scope to production-only workloads, adjust efficiency assumptions, switch deployment options, or model different target services. Each scenario produces updated sizing and validated costs within seconds, giving teams a decision matrix rather than a single estimate.
For a detailed look at how each of these analytical methods works, see Part 2 in this series: Inside AWS Storage Assessment: How intelligent analysis replaces guesswork.
Real-world example
Costs in the following examples are directional estimates based on public AWS list pricing at time of assessment. They do not reflect Enterprise Discount Program or private pricing agreements. Growth rate is not included.
NAS migration assessment
For this example, use case, an enterprise with NAS storage in the US East (N. Virginia) Region requested a storage assessment to evaluate migration to AWS. Data was collected using NetApp Data Infrastructure Insights over a 30-day period.The current state was as follows:
- Total workloads: 3,920 volumes.
- Allocated capacity: 10,667 TB.
- Used capacity: 4,817 TB (45% utilization).
- Existing replication: 646 volumes (646 TB).
- Collection period: 30 days.
- Storage arrays: 9.
The assessment yielded the following findings:
- 844 volumes with zero I/O activity over a 30-day collection period (1,720 TB inactive).
- 565 volumes excluded by customer (not in scope for this migration phase).
- 3,355 active volumes in scope for sizing.
- Existing replication: 646 volumes (646 TB) identified as SnapMirror/DP replicas.
The recommended solution was as follows:
- Service: Amazon FSx for NetApp ONTAP GEN-2 (Single-AZ).
- In-scope workloads: 3,355.
- HA Pairs: 12, File System: 10.
- FSx for ONTAP total size: 5,334 TB (SSD: 340 TB, Capacity Pool: 4,994 TB).
- Storage configuration: SSD tier for hot data (5–14% per array), remainder on capacity pool with automatic tiering.
Figure 3 shows the first page of the example executive summary delivered to the customer.
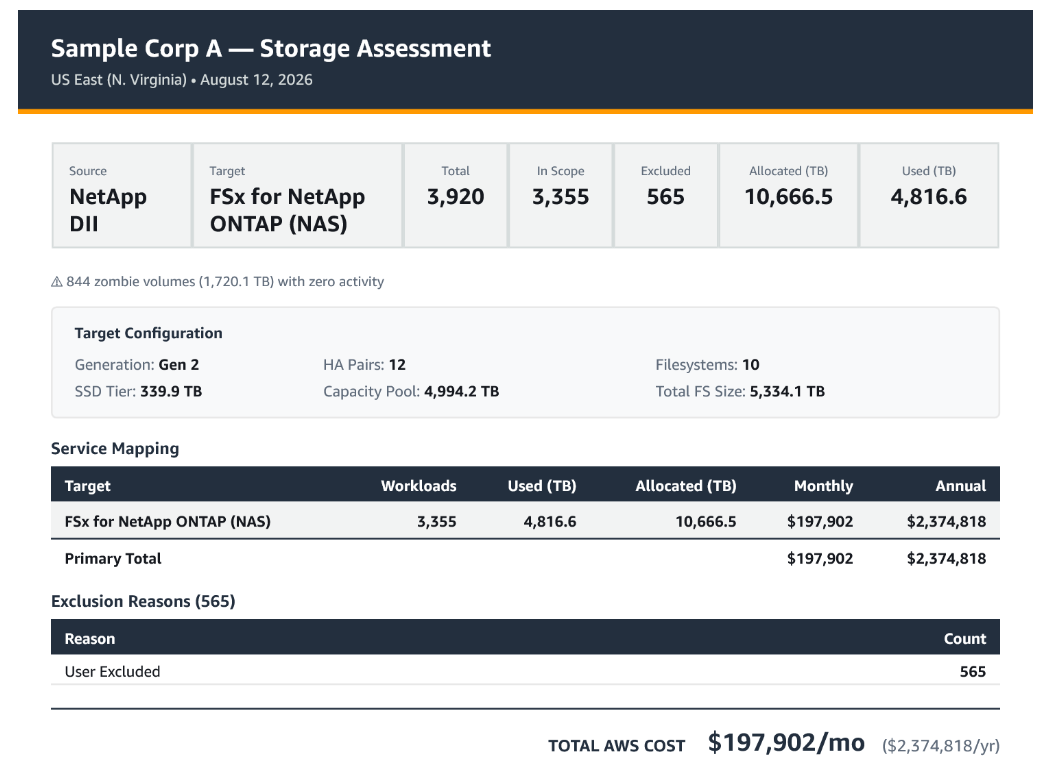
Figure 3: Sample assessment executive summary
The solution resulted in the following key outcomes:
- Right-sized from 10,667 TB allocated to 5,462 TB on FSx for ONTAP (50% capacity reduction), with 1,720 TB of inactive storage identified for archival or decommissioning.
- Automatic tiering continuously moves cold data to lower-cost capacity pool.
- 646 SnapMirror/DP replica volumes identified and sized with production workloads.
VMware environment assessment
In this example, a customer with a VMware environment in the Europe (Ireland) Region provided an RVTools export for assessment.The current state was as follows:
- Total workloads: 7,743 VMs.
- Allocated capacity: 4,530 TB.
- Used capacity: 1,421 TB (31% utilization).
- Collection method: RVTools export (point-in-time).
The assessment yielded the following findings:
- 2,693 VMs excluded: 980 duplicate VMs, 909 powered off, 804 desktop OS.
- 5,050 VMs in scope, classified across four AWS target services.
- 69% over-provisioned (4,530 TB allocated versus 1,421 TB used).
The recommended solution was as follows:
- Amazon EBS: 4,283 workloads (applications, databases, boot volumes).
- Amazon FSx for NetApp ONTAP NAS: 660 workloads (file servers, shared storage).
- Amazon FSx for NetApp ONTAP Block: 105 workloads (databases, applications on iSCSI).
- Amazon S3: 2 workloads (archive).
Figure 4 shows the first page of the example executive summary delivered to the customer.
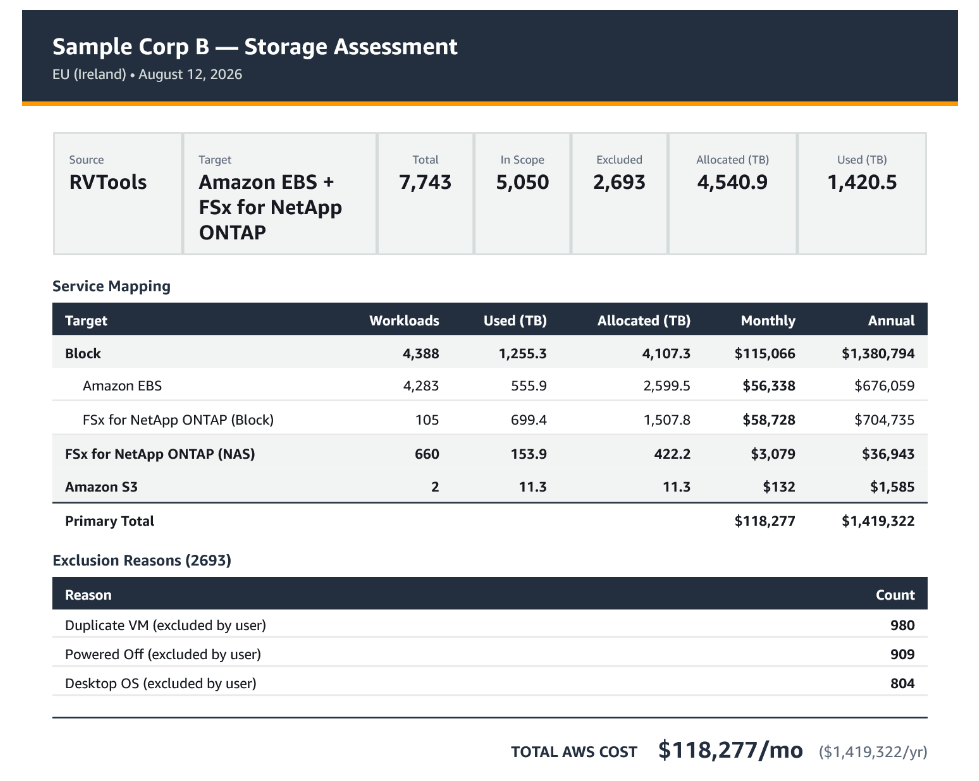
Figure 4: Sample assessment executive summary (VMware multi-target)
The solution resulted in the following key outcomes:
- Single RVTools export automatically mapped to four AWS services, with 2,693 VMs excluded through classification.
- 69% over-provisioning identified for right-sizing.
- Data protection (AWS Backup, Amazon Elastic Disaster Recovery, NetApp SnapMirror) available as add-ons from the same data.
What you receive
The assessment delivers a business case document designed for both technical teams and executive stakeholders:
- Multiple formats – Detailed Excel workbook for technical analysis, executive PowerPoint presentation for leadership, and consolidated PDF summary.
- Executive summary – AI-generated narrative covering key findings, cost analysis, migration approach with recommended tools, and architectural considerations.
- Workload classification – Every volume classified by type (database, file server, backup, application, archive) with service mapping rationale.
- Per-workload sizing – Specific AWS configuration for each volume with IOPS, throughput, capacity, and cost.
- Cost model – Monthly and annual costs by service, including data protection and transfer estimates.
- On-premises comparison – Side-by-side cost analysis against industry average on-premises rates (provisioned and used capacity baselines).
- Migration approach – Recommended migration tools and bandwidth estimates based on source and target service.
- Optimization findings – Inactive volumes, over-provisioning, efficiency opportunities, and tiering recommendations.
The executive summary recommends the correct migration tools based on your source and target combination: AWS DataSync for NAS file migrations, NetApp SnapMirror for replication to FSx for ONTAP volumes, AWS Transform MGN for server and block migrations to Amazon EBS and FSx for ONTAP, or third-party partner tools as applicable.
The deliverable is ready for leadership review.
Getting started
The Storage Assessment is provided at no cost. An AWS Migration Solutions Architect leads the engagement, handles the analysis, and delivers the business case. No consulting fees, no software licenses, no commitment to migrate.To get started:
- Define scope – Identify which storage systems to include. Prioritize systems approaching hardware refresh or end-of-support.
- Choose your path – Already have data from existing tools (RVTools, vendor monitoring, discovery platforms)? Share it for a quick assessment in days. Need comprehensive analysis? Deploy automated collection for 7–30 days to capture full workload behavior.
- Engage – Contact your AWS account team, email migration-assessment@amazon.com, or request an assessment.
For self-service analysis, AWS Transform assessments provides automated storage assessment capabilities that process telemetry data from multiple sources.
For organizations migrating workloads that include Microsoft SQL Server, Windows Server, Oracle, or VMware, consider pairing the Storage Assessment with an AWS Optimization and Licensing Assessment (OLA). While the Storage Assessment covers your data layer, the OLA optimizes your compute and licensing costs together they give you a complete, data-driven migration business case.
Conclusion
In this post, we covered how storage migration planning stalls when teams lack unified data across their storage landscape, and how the Storage Assessment replaces estimates with evidence: actual performance patterns, utilization-based sizing, and validated cost models from live AWS pricing. The assessment accepts data from whatever tools you already have deployed, analyzes workload characteristics across your entire environment, and delivers a business case with per-workload service recommendations at no cost. In Part 2 of this blog series, Inside AWS Storage Assessment: How intelligent analysis replaces guesswork, we go deeper into the classification, tiering, and optimization methods that power these results.
Learn More
Read the 3 part blog series:
Part 2: Inside the AWS Storage Assessment: How intelligent analysis replaces guesswork