AWS News Blog
CloudWatch Logs Subscription Consumer + Elasticsearch + Kibana Dashboards
Many of the things that I blog about lately seem to involve interesting combinations of two or more AWS services and today’s post is no exception. Before I dig in, I’d like to briefly introduce all of the services that I plan to name-drop later in this post. Some of this will be review material, but I do like to make sure that every one of my posts makes sense to someone who knows little or nothing about AWS.
- Amazon Kinesis is a fully-managed service for processing real-time data streams. Read my introductory post, Amazon Kinesis – Real-Time Processing of Streaming Big Data to learn more.
- The Kinesis Connector Library helps you to connect Kinesis to other AWS and non-AWS services.
- AWS CloudFormation helps you to define, create, and manage a set of related AWS resources using a template.
- CloudWatch Logs allow you to store and monitor operating system, application, and custom log files. My post, Store and Monitor OS & Application Log Files with Amazon CloudWatch, will tell you a lot more about this feature.
- AWS Lambda runs your code (currently Node.js or Java) in response to events. It manages the compute resources for you so that you can focus on the code. Read AWS Lambda – Run Code in the Cloud to learn more. Many developers are using Lambda (often in conjunction with the new Amazon API Gateway) to build highly scalable microservices that are invoked many times per second.
- VPC Flow Logs give you access to network traffic related to a VPC, VPC subnet, or Elastic Network Interface. Once again, I have a post for this: VPC Flow Logs – Log and View Network Traffic Flows.
- Finally, AWS CloudTrail records AWS API calls for your account and delivers the log files to you. Of course, I have a post for that: AWS CloudTrail – Capture AWS API Activity.
The last three items above have an important attribute in common — they can each create voluminous streams of event data that must be efficiently stored, index, and visualized in order to be of value.
Visualize Event Data
Today I would like to show you how you can use Kinesis and a new CloudWatch Logs Subscription Consumer to do just that. The subscription consumer is a specialized Kinesis stream reader. It comes with built-in connectors for Elasticsearch and S3, and can be extended to support other destinations.
We have created a CloudFormation template that will launch an Elasticsearch cluster on EC2 (inside of a VPC created by the template), set up a log subscription consumer to route the event data in to ElasticSearch, and provide a nice set of dashboards powered by the Kibana exploration and visualization tool. We have set up default dashboards for VPC Flow Logs, Lambda, and CloudTrail; you can customize them as needed or create other new ones for your own CloudWatch Logs log groups.
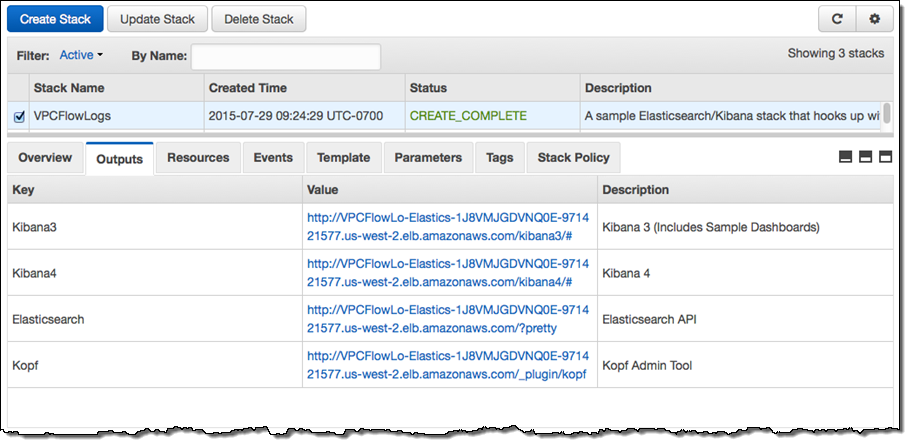
The stack takes about 10 minutes to create all of the needed resources. When it is ready, the Output tab in the CloudFormation Console will show you the URLs for the dashboards and administrative tools:
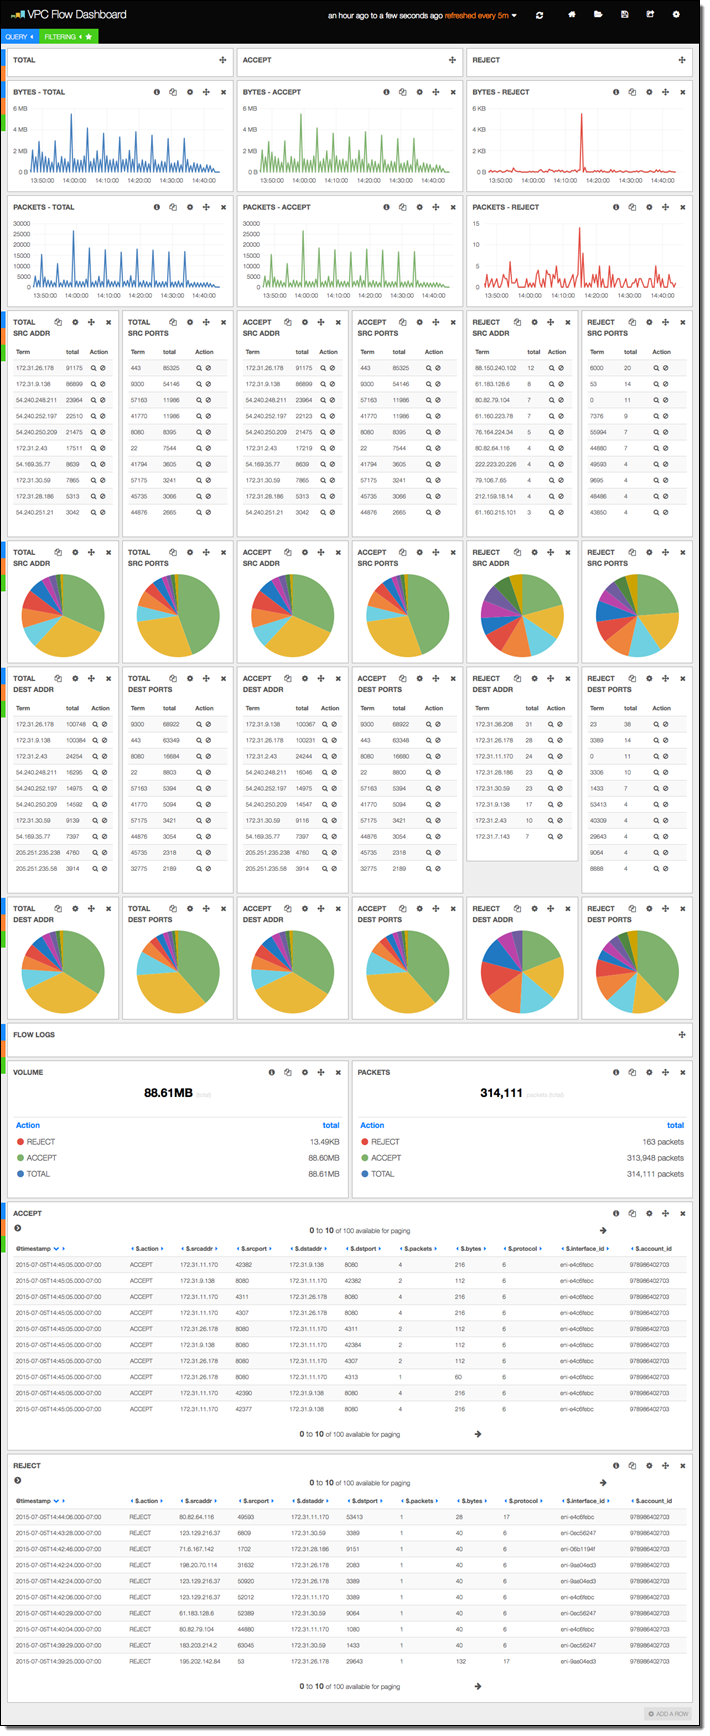
The stack includes versions 3 and 4 of Kibana, along with sample dashboards for the older version (if you want to use Kibana 4, you’ll need to do a little bit of manual configuration). The first sample dashboard shows the VPC Flow Logs. As you can see, it includes a considerable amount of information:
The next sample displays information about Lambda function invocations, augmented by data generated by the function itself:
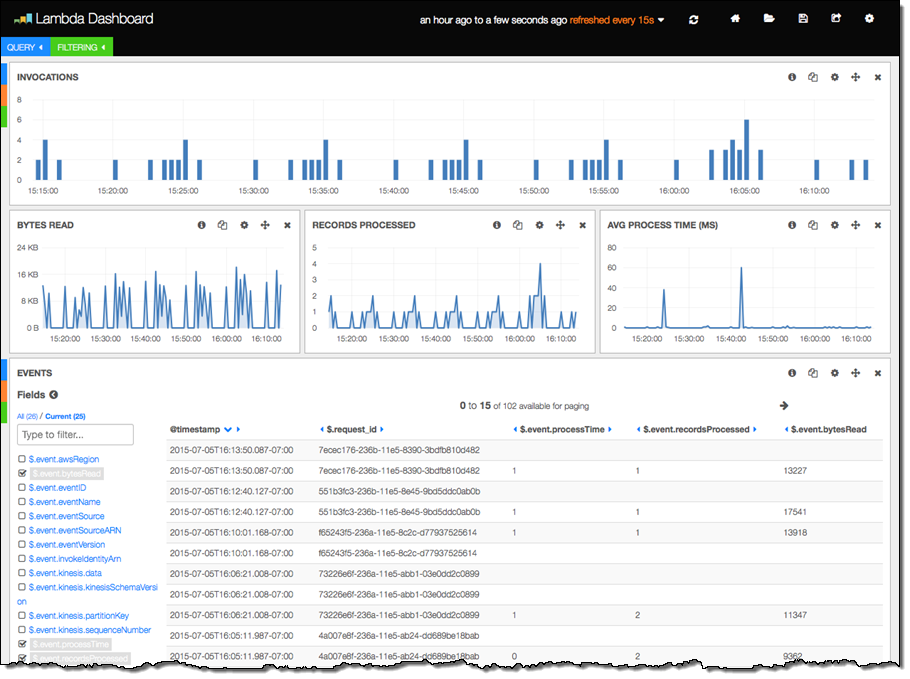
The final three columns were produced by the following code in the Lambda function. The function is processing a Kinesis stream, and logs some information about each invocation:
exports.handler = function(event, context) {
    var start = new Date().getTime();
    var bytesRead = 0;

    event.Records.forEach(function(record) {
        // Kinesis data is base64 encoded so decode here
        payload = new Buffer(record.kinesis.data, 'base64').toString('ascii');
        bytesRead += payload.length;

        // log each record
        console.log(JSON.stringify(record, null, 2));
    });

    // collect statistics on the function's activity and performance
    console.log(JSON.stringify({
        "recordsProcessed": event.Records.length,
        "processTime": new Date().getTime() - start,
        "bytesRead": bytesRead,
    }, null, 2));

    context.succeed("Successfully processed " + event.Records.length + " records.");
};
There’s a little bit of magic happening behind the scenes here! The subscription consumer noticed that the log entry was a valid JSON object and instructed Elasticsearch to index each of the values. This is cool, simple, and powerful; I’d advise you to take some time to study this design pattern and see if there are ways to use it in your own systems.
For more information on configuring and using this neat template, visit the CloudWatch Logs Subscription Consumer home page.
Consume the Consumer
You can use the CloudWatch Logs Subscription Consumer in your own applications. You can extend it to add support for other destinations by adding another connector (use the Elasticsearch and S3 connectors as examples and starting points).
— Jeff;