AWS News Blog
Amazon CloudWatch Update – Percentile Statistics and New Dashboard Widgets
There sure is a lot going on with Amazon CloudWatch these days! Earlier this month I showed you how to Jump From Metrics to Associated Logs and told you about Extended Metrics Retention and the User Interface Update.
Today we are improving CloudWatch yet again, adding percentile statistics and two new dashboard widgets. Time is super tight due to AWS re:Invent, so I’ll be brief!
Percentile Statistics
When you run a web site or a cloud application at scale, you need to make sure that you are delivering the expected level of performance to the vast majority of your customers. While it is always a good idea to watch the numerical averages, you may not be getting the whole picture. The average may mask some performance outliers and you might not be able to see, for example, that 1% of your customers are not having a good experience.
In order to understand and visualize performance and behavior in a way that properly conveys the customer experience, percentiles are a useful tool. For example, you can use percentiles to know that 99% of the requests to your web site are being satisfied within 1 second. At Amazon, we use percentiles extensively and now you can do the same. We prefix them with a “p” and express our goals and observed performance in terms of the p90, p99, and p100 (worst case) response times for sites and services. Over the years we have found that responses in the long tail (p99 and above) can be used to detect database hot spots and other trouble spots.
Percentiles are supported for EC2, RDS, and Kinesis as well as for newly created Elastic Load Balancers and Application Load Balancers. They are also available for custom metrics. You can display the percentiles in CloudWatch (including Custom Dashboards) and you can also set alarms.
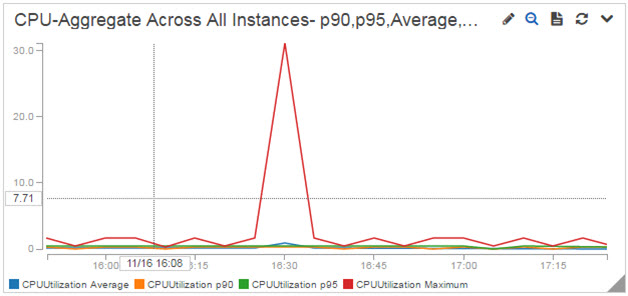
Percentiles can be displayed in conjunction with other metrics. For example, the orange and green lines indicate p90 and p95 CPU Utilization:
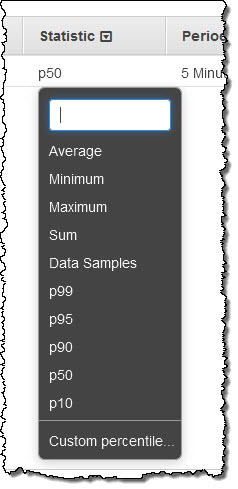
You can set any desired percentile in the CloudWatch Console:
Read Elastic Load Balancing: Support for CloudWatch Percentile Metrics to learn more about how to use the new percentile metrics to gain additional visibility into the performance of your applications.
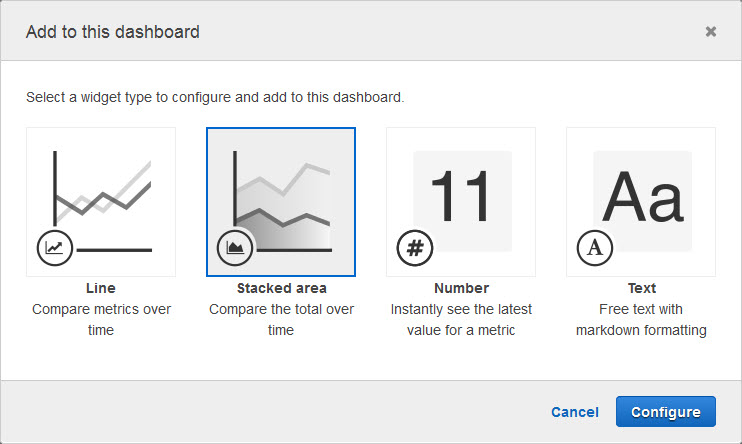
New Dashboard Widgets
You can now add Stacked Area and Number widgets to your CloudWatch Custom Dashboards:
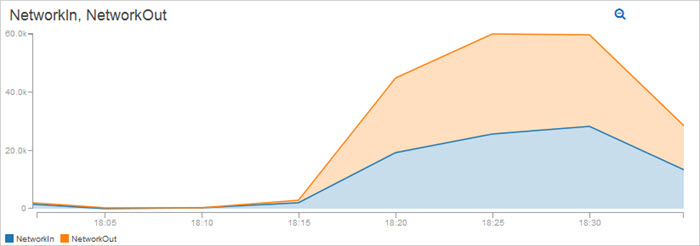
Here’s a Stacked Area widget with my network traffic:
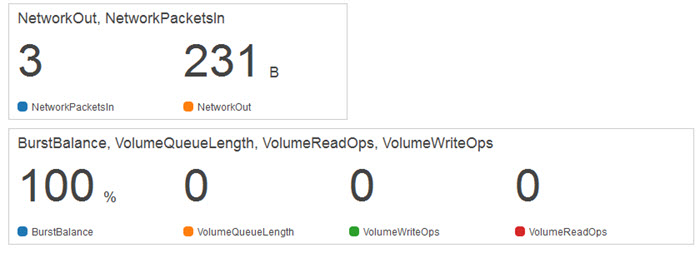
And here’s a Number widget with some EC2 and EBS metrics:
Available Now
These new features are now available in all AWS Regions and you can start using them today!
— Jeff;