AWS News Blog
CloudWatch Update – Jump From Metrics to Associated Logs
A few years ago I showed you how to Store and Monitor OS & Application Log Files with Amazon CloudWatch. Many AWS customers now create filters for their logs, publish the results as CloudWatch metrics, and then raise alarms when something is amiss. For example, they watch their web server logs for 404 errors that denote bad inbound links and 503 errors that can indicate an overload condition.
While the monitoring and alarming are both wonderful tools for summarizing vast amounts of log data, sometimes you need to head in the opposite direction. Starting from an overview, you need to be able to quickly locate the log file entries that were identified by the filters and caused the alarms to fire. If you, like many of our customers, are running hundreds or thousands of instances and monitoring multiple types of log files, this can be statistically more difficult than finding a needle in a haystack.
Today we are launching a new CloudWatch option that will (so to speak) reduce the size of the haystack and make it a lot easier for you to find the needle!
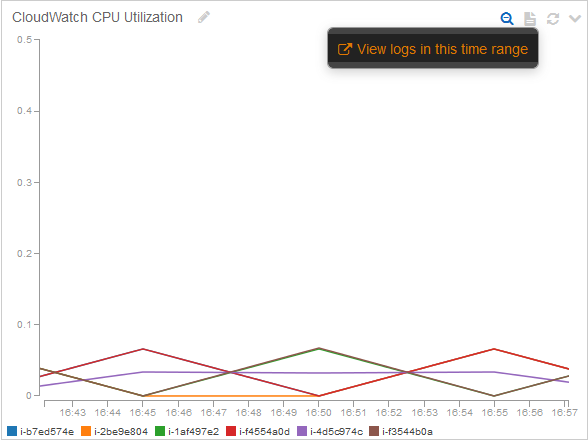
Let’s say that I am looking at this graph and want to understand the spike in the ERROR metric at around 17:00:
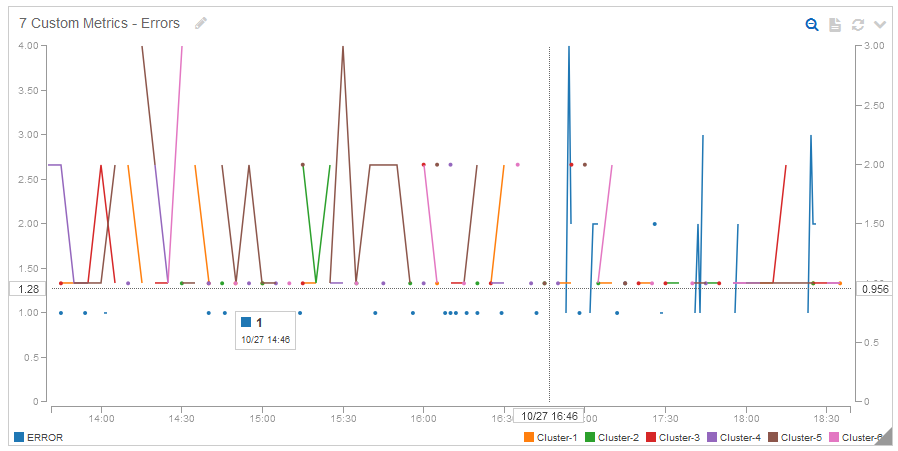
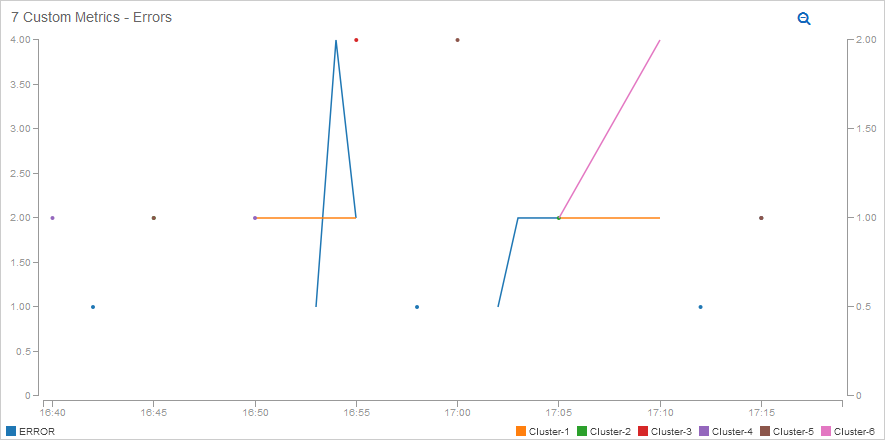
I narrow down the time range with a click and a drag:
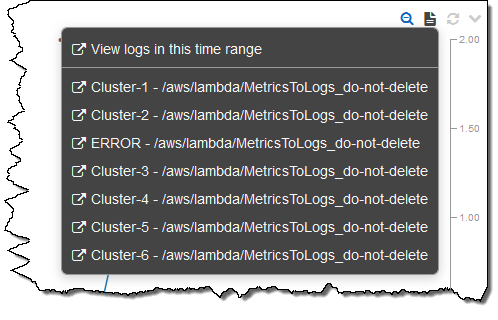
Then I click on the logs icon (it, along with the other icons, appears only when the mouse is over the graph), and select the log file of interest (ERROR):
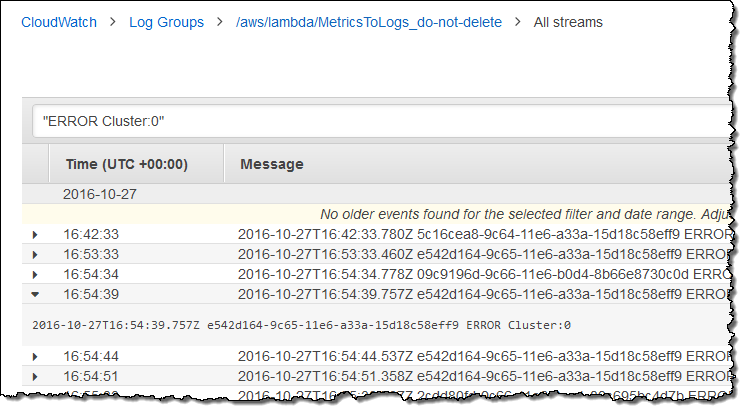
CloudWatch opens in a second tab, with a view that shows the desired log files, pre-filtered to the desired time span. I can then expand an entry to see what’s going on (these particular errors were manufactured for demo purposes; they are not very exciting or detailed):
This feature works great for situations where filters on log files are used to publish metrics. However, what if I am looking at some CloudWatch system metrics that are not associated with a particular log file? I can follow the steps above, but select View logs in this time range from the menu:
I can see all of my CloudWatch Log Groups, filtered for the time range in the graph:
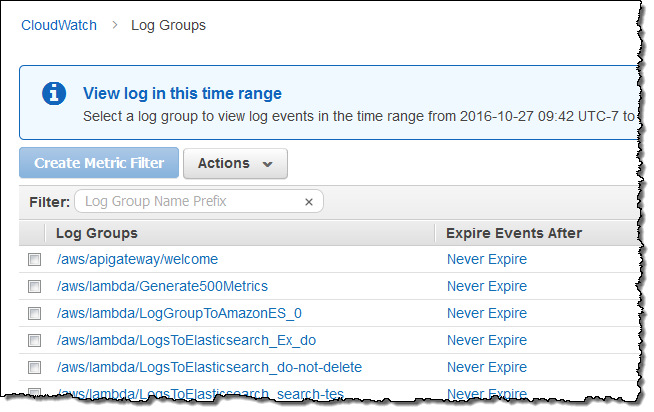
At this point I can use my knowledge of my application’s architecture to guide my decision-making and to help me to choose a Log Group to investigate. Once again, the events in the log group will be filtered so that only those in the time frame of interest will be visible. If a chart contains metrics in the Lambda namespace, links to the log group will be displayed even if no metric filters are in effect.
This new feature is available now and you can start using it today!
— Jeff;