AWS News Blog
Amazon CloudWatch Update – Extended Metrics Retention & User Interface Update
Amazon CloudWatch is a monitoring service for your AWS resources and for the applications that you run on AWS. It collects and tracks metrics, monitors log files, and allows you to set alarms and respond to changes in your AWS resources.
Today we are launching several important enhancements to CloudWatch:
- Extended Metrics Retention – CloudWatch now stores all metrics for 15 months.
- Simplified Metric Selection – The CloudWatch Console now makes it easier for you to find and select the metrics of interest.
- Improved Metric Graphing – Graphing of selected metrics is now easier and more flexible.
Let’s take a look!
Extended Metrics Retention
When we launched CloudWatch back in 2009 (New Features for Amazon EC2: Elastic Load Balancing, Auto Scaling, and Amazon CloudWatch), system metrics were stored for 14 days. Later, when we gave you the ability to publish your own metrics to CloudWatch, the same retention period applied. Many AWS customers would like to access and visualize data over longer periods of time. They want to detect and understand seasonal factors, observe monthly growth trends, and perform year-over-year analysis.
In order to support these use cases (and many others that you’ll undoubtedly dream up), CloudWatch now stores all metrics for 15 months at no extra charge. In order to keep the overall volume of data reasonable, historical data is stored at a lower level of granularity, as follows:
- One minute data points are available for 15 days.
- Five minute data points are available for 63 days.
- One hour data points are available for 455 days (15 months).
In order to allow you to understand the value of this new feature first-hand, you can immediately access three months of retained metrics. Over the course of the next 12 months, metrics will continue to be retained up until the point where a full 15 months of history are stored.
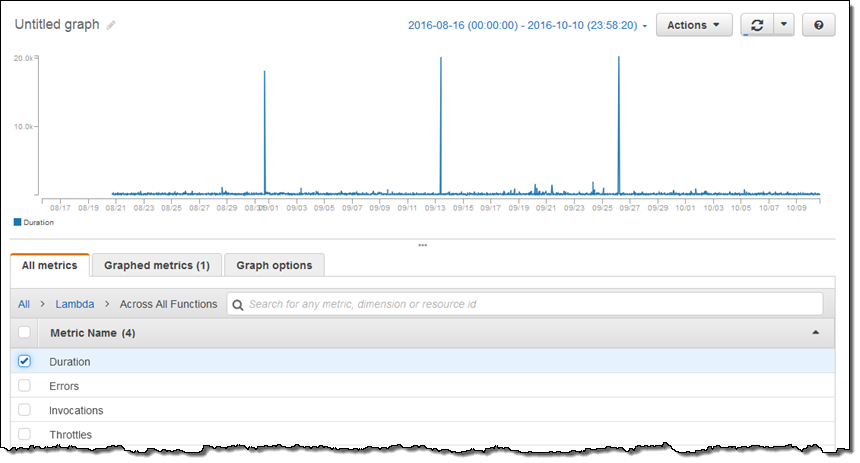
As a first-hand illustration of the value of extended metrics retention, this long-term view of the Duration of my AWS Lambda functions tells me that something unusual is happening every two weeks:
Simplified Metric Selection
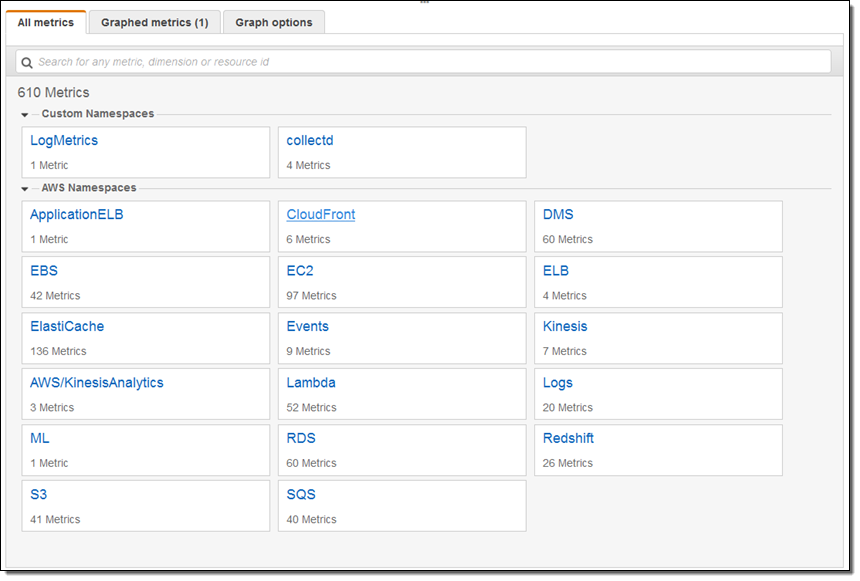
In order to make it easier for you to find and select the metrics that you would like to examine and graph, the CloudWatch Console now includes a clean, clutter-free card style view with a clean demarcation between AWS metrics and custom metrics:
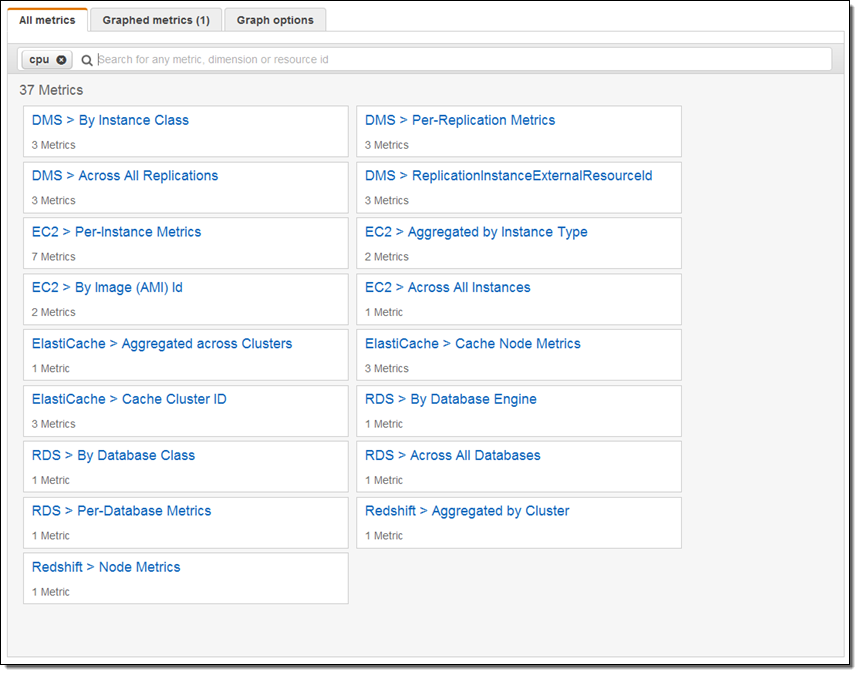
The next step is to search for metrics of interest. For example, I’m interested in metrics with “CPU” in the name:
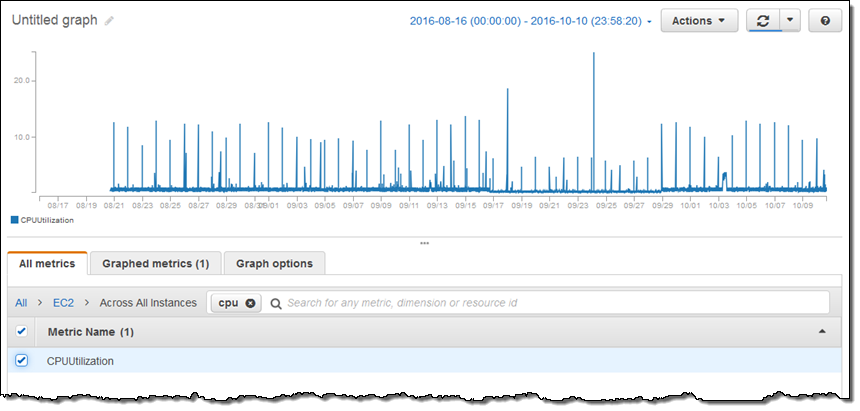
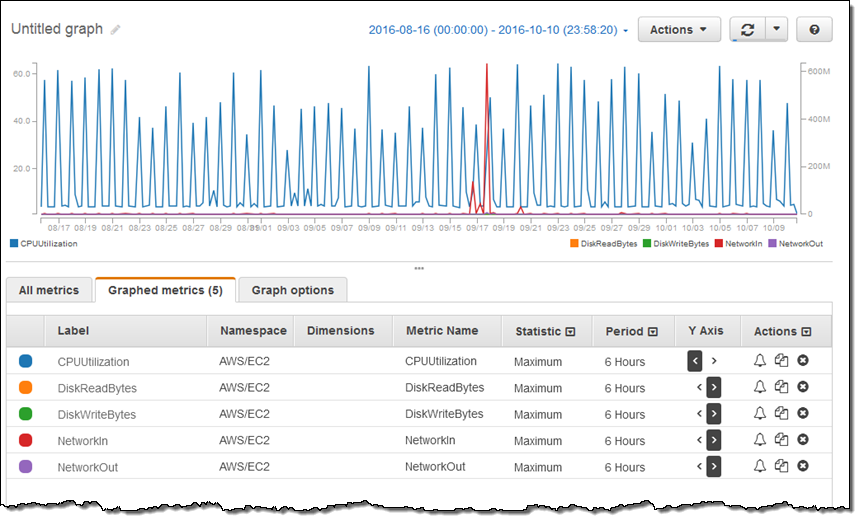
From there I can drill down, select a metric, and graph it. Here’s the CPU Utilization metric across all of my EC2 instances:
I can also show multiple metrics on the same graph:
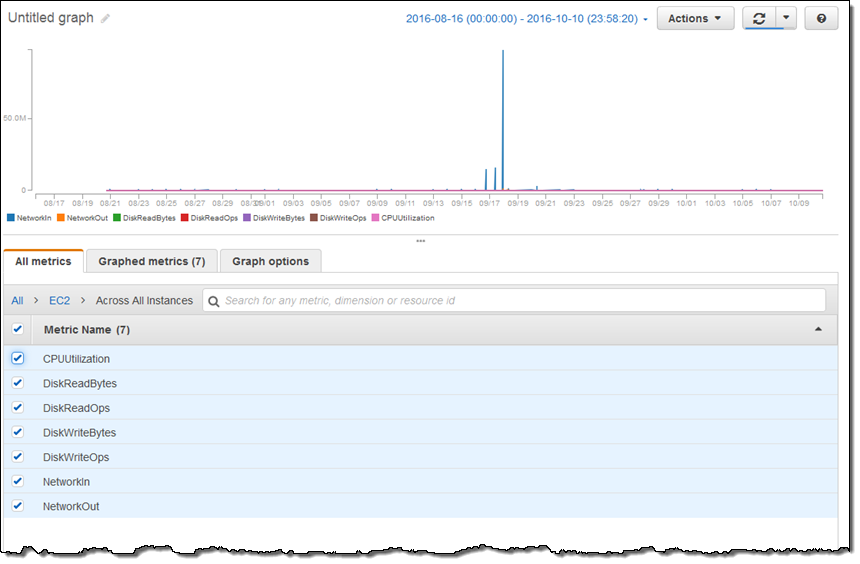
This is not as illuminating as I would like; I’ll show you how to fix that in just a minute.
Improved Metric Graphing
With metrics now stored for 15 months and easier to find and to select, the next step is to make them easier to comprehend. This is where the new tabs (Graphed metrics and Graph options) come in to play.
The Graphed metrics tab gives me detailed control over each metric:
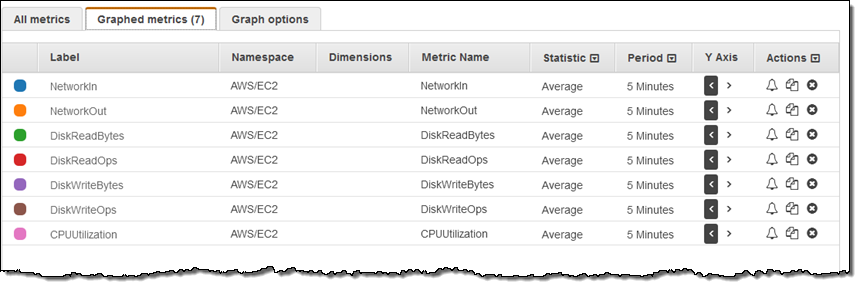
The Actions column on the right lets me create alarms, duplicate a metric, or to delete it from the graph.
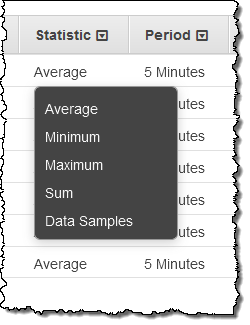
I can click on any of the entries in the Statistic column to make a change:
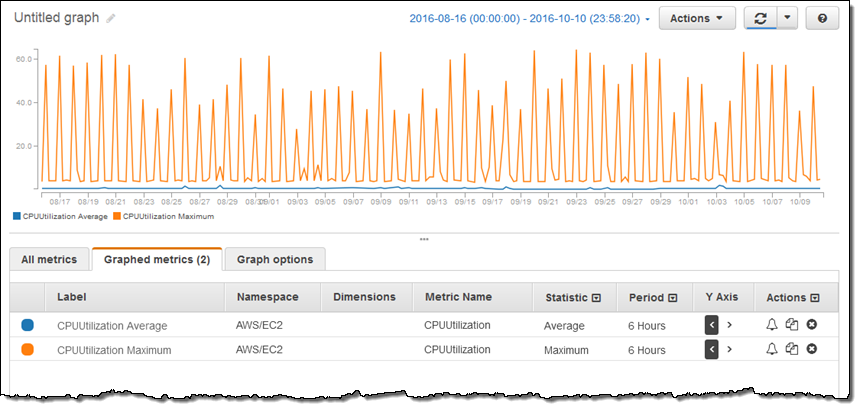
The ability to duplicate a metric and then change a statistic lets me compare, for example, maximum and average CPU Utilization (I also changed the Period to 6 hours):
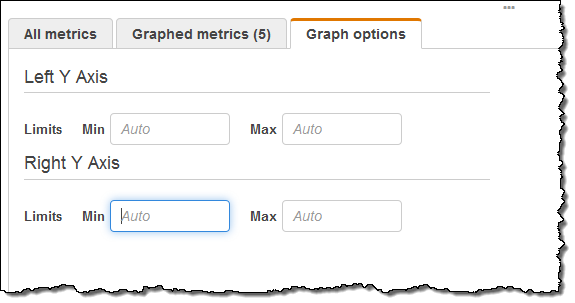
Now let’s take a look at the Y Axis control on the Graph options tab. In the last section I graphed seven EC2 metrics at the same time. Due to the variation in range, the graph was not as informative as it could be. I can now choose independent ranges for the left and right Y axes, and then assign metrics to the left or to the right:
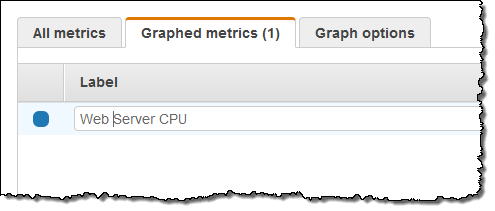
I can edit the label for a metric by clicking on it:
 I can also choose to set ranges for the left and the right Y axes:
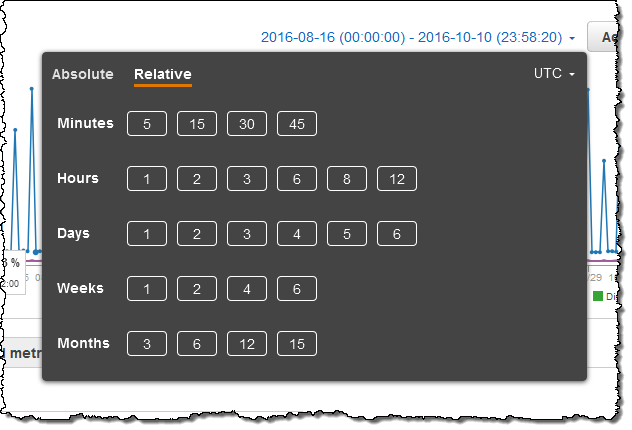
I can use the new date picker to choose the time frame of interest to me. I can look at metrics for a desired absolute date range, or relative to the current date. Here’s how I choose an absolute date range:
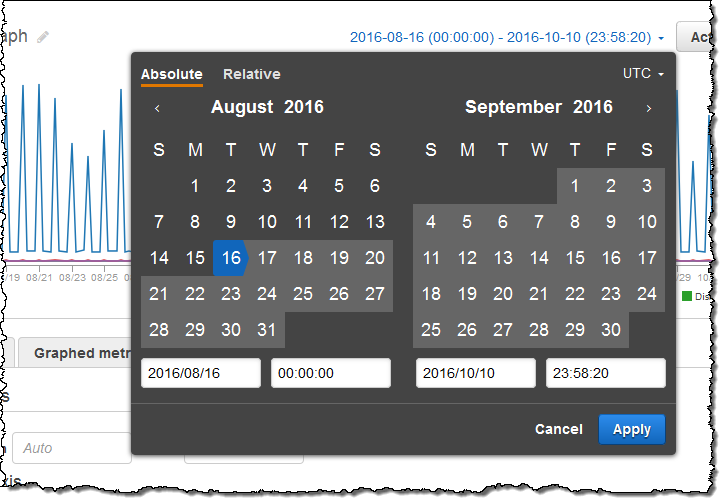
And here’s how I choose a relative one:
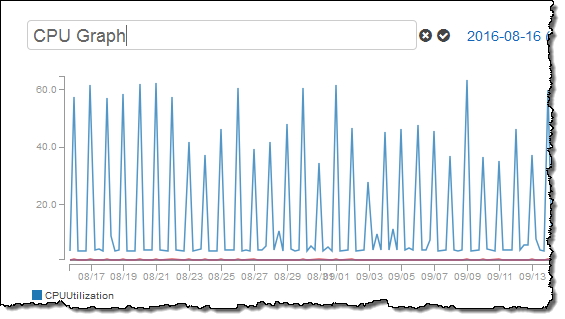
I can rename a graph by clicking on the current name and entering a new one:
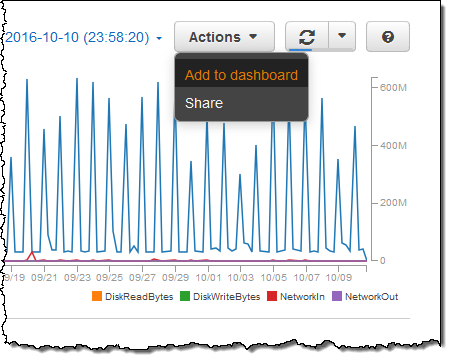
After I have fine-tuned the graph to my liking I can add it to an existing dashboard or create a new one:
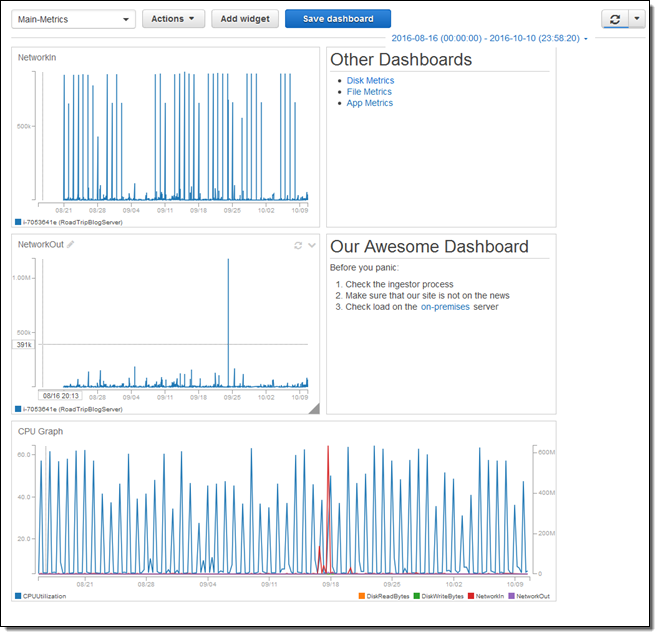
Here’s one of my existing dashboards with the new graph at the bottom:
Available Now
The extended metric storage and all of the features that I described above are now available in the US East (N. Virginia), US West (Oregon), US West (N. California), Europe (Ireland), Europe (Frankfurt), South America (São Paulo), Asia Pacific (Singapore), Asia Pacific (Tokyo), Asia Pacific (Seoul), Asia Pacific (Mumbai), and Asia Pacific (Sydney) Regions.
As I noted before, there is no extra charge for the extended metric storage.
— Jeff;