AWS for Industries
Improve overall quality control in manufacturing: using ML at edge and central dashboards at scale
Introduction
As the manufacturing industry evolves rapidly in the industry 4.0 era, industry professionals are exploring technologies to improve and optimize their industrial process. Building better products is one of the top priorities of industrials, along with reducing overall costs, increasing revenues, offering products at a lower price and reducing time to market. The critical process of quality control ensures customers receive products free from defects. Yet, this manufacturing process is still pre-dominantly human driven in a vast majority of use cases.
Amazon Web Services (AWS) offers over 200 fully featured services from data centers globally. On top of that, the AWS Partner Network (APN) includes thousands of independent software vendors (ISVs) who adapt their technology to work on AWS. This provides our customers with tools and capacity to support many workloads, but also to customize their applications to their business needs by using “the right tool for the right job”.
In this blog post, we will explore how to set-up an ML based image detection system to identify manufacturing product defects including alarming dashboards at various steps of the manufacturing process as well as describe the back-end sensor ingestion, storage, and alerting architecture. Using a reproducible and automated mechanism allows you to increase the number of quality checks along the production line, leading to improved inspection tasks, reduced errors and more visibility into the manufacturing chain. Moreover, you’ll be able to correlate data produced by this automation process with data produced by machines, to monitor the Overall Equipment Efficiency (OEE) measured by performance, availability and quality. Breaking data silos and placing data into a central manufacturing data lake raises monitoring to the enterprise level while still preserving the factory and machine details. This helps to better understand your manufacturing processes and obtain insights on how to improve them using a data driven approach.
Defining KPIs
Defining the dashboards, and the KPIs to monitor, at early stages, helps to set your solution and customer experience and work backwards from them from a technology perspective. So first we will take a deeper look into the dashboards we want to create and the KPIs we need to monitor to address the challenges described in the introduction.
To set the context, we use an aluminum bottle manufacturing process as an example. But keep in mind that you can adapt and apply this to other manufacturing use cases as the underlying concepts (ML – Data Ingestion – Data Analytics) remain the same.

In Figure 1 above, we have modeled the aluminum bottle manufacturing process by representing each manufacturing step: aluminum slug – lubrication – cold impact extrusion – aluminum shell – neck forming – heat treatment – threading – hydrotesting – inspection and shipping. This allows us to monitor the output of each step and traceback the root cause of a defect to address it at the right level.
This view is integrated into our monitoring dashboard to augment human inspection, by making it more visual (in contrast of having only plain data/logs). With that, we can quickly highlight the manufacturing step that failed at a point in time, as we correlate the defect detection event with telemetric data from the machines.
Figure 2 (below) is an example of how we want monitoring alert to highlights a defect detected at the inspection step.

To create those dashboards, we are going to use Thingsboard, an open-source IoT platform for data visualization that is available on the AWS Marketplace, Thingsboard provides custom widgets for facilitating dashboard creation, it also allows you to send commands to devices and receive results of commands execution.
As described in the introduction, on top of having the low-level view of the production in one factory, we also want to have a high-level view of the production state at the enterprise level. To do so, we used a metric called OEE, which is calculated based on availability and performance of the machines, as well as the quality of the products. The objective is to aggregate those metrics at different levels to provide a view per region, per countries, per factories (see Figure 3 below, there are 8 regions covered here – Beijing, Bangkok, Sydney, Nairobi, Luxembourg, Buenos Aires, New York and Mexico).
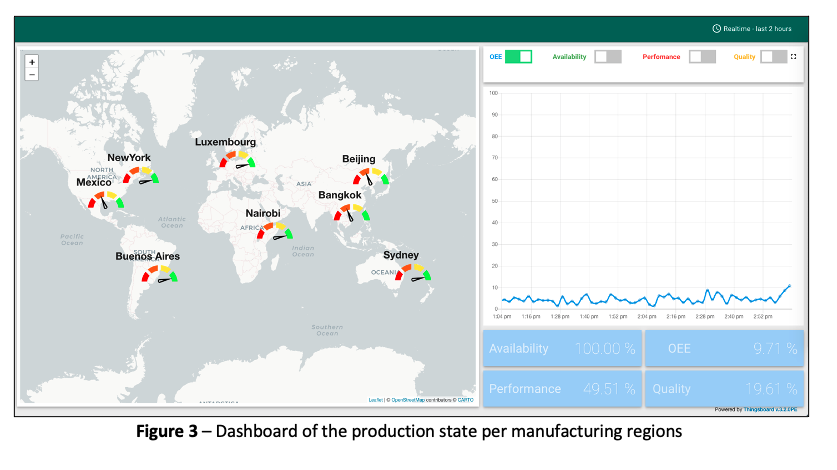
Using this dashboard, we are able to quickly identify if there is a problem in any of those regions, and have a high-level view of the problem. In our prototype, we have used metrics such as conveyor belt real-time speed, designed max speed, motor status (on/off) to calculate the availability and performance. For a production line in real world, you will add more metrics in the equation. Looking at the color gauges, you can compare the performance of different regions.
Now if we click on one of those regions, we want an intermediate view (between the high level one in Figure 3 and the production chain one in Figure 2) to show data and on-going alerts at a factory level (see Figure 4 below).

On the top left side of the screen, we show the OEE that is now specific to the region you clicked on, with the ability to toggle on or off the Availability, Performance and Quality KPIs to get more details. At the bottom left is the count of defects detected, sorted by types of defects (e.g., paint scratch, missing cap). On the right part of the screen are the on-going alerts with their status, after a defect is detected. Alerts can be acknowledged and assigned (for someone in your team to work on it), or simply cleared after inspecting the defect.
Backend
Now that we’ve covered how the dashboards look like and behave, we will have a deeper look on the architecture and services behind it (see Figure 5 below) to understand the requirements for building this type of monitoring platform.
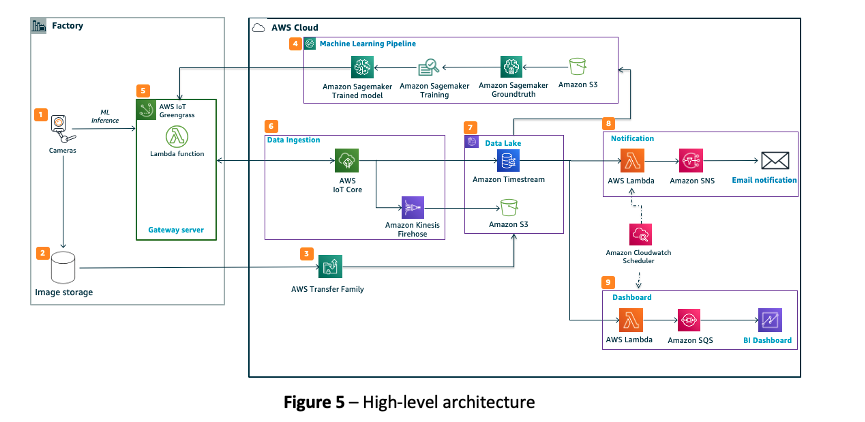
We create the dashboards in the section above using data generated by multiple hardware systems working together. These include conveyer belts, cameras and edge-based machine learning compute (together called Computer Vision). We capture in near real time the metrics using AWS IoT Core, and upload periodically new photos of the product to Amazon S3 using AWS Transfer Family. We also send the metrics to Amazon Timestream from AWS IoT Core. Those two cloud storage services (see block “7” in Figure 5) act as our manufacturing data lake:
1. Amazon Simple Storage Service (Amazon S3), is an object storage service that offers industry-leading scalability, data availability, security, performance and low cost, and is an ideal storage layer for an industrial data lake. We use Amazon S3 here to store raw data and unstructured data such as product images. We reuse those images to train the machine learning models in Amazon SageMaker (we will come into more details to this in the sections below).
2. Amazon Timestream, is a fast, scalable and serverless time series database service for IoT and operational applications, and enables us to do near-real time anomaly detection and finally make the data available in milliseconds.
The data lake acts as a central piece in the architecture where it stores different types of data transferred from factories and enables two major workflows: Computer Vision and Equipment Data Analytics.
Computer Vision (CV) on AWS
Automating quality inspection of products requires machine learning (ML) models running at the edge to provide near-real time inference and to prevent issues that can be generated by external network disconnection. The Computer Vision setup comprises of edge cameras (e-CAM130 13MP) and an edge computer (Jetson Xavier AGX). These are housed in an enclosure custom built for our prototype that is placed on top of a conveyer belt as shown in Figure 6.

The product (aluminum bottle in our case) passes through the enclosure where we capture 4 images from a variety of angles. To carry out inference on the images and identify defects such as scratches and missing caps, we use a Jetson Xavier AGX edge computer with two ML models. We have trained Single Shot Multibox Detector (SSD) algorithms using Amazon SageMaker and deployed on the edge using AWS IoT Core. The current inference rate is under 200ms per image i.e., it takes less than a quarter of a second for an incoming image to be processed by our ML model. The inference results are combined with additional metadata such as conveyer belt speed and ingested into AWS Cloud via AWS IoT Greengrass running on the Jetson device (see block “6” in Figure 5).
Our choice of hardware is based on 1) compute capacity 2) cost 3) availability in the market. Selecting Jetson Xavier AGX device over other offerings (e.g., Jetson Nano) allows us to run multiple ML models in parallel without losing performance. It runs Ubuntu 16.04 OS which provides flexibility to implement custom machine learning code without being tied down to third-party vendor specific software. e-CAM130 camera module allows up to 4 cameras to be connected to the Jetson Xavier AGX device and stream images at a resolution of 1280×720.
The image below (Figure 7) is an example of a bottle with defects highlighted by the ML model.

For every product that passes through the conveyer belt, we record different metrics. In Figure 8 below you can see a Sample JSON that represents a recording. The edge computer is configured with AWS IoT GreengrassV2 and sends real time data to the AWS Cloud. The frequency of the JSON metadata upload to the cloud depends on how many products pass through the conveyer belt. For this demonstrator, we tested the setup with a frequency of 1 JSON upload every 3 seconds.
1. siteId: Location of the manufacturing site
2. timestamp: date and time when the product was checked
3. productDetected: Boolean flag of whether a product is present
4. productionLineStatus: Whether the manufacturing line is in operation
5. conveyerBeltSpeed: speed of the manufacturing line
6. cam1, cam2, cam3, cam4: list of bounding box coordinates where the system detects a defect.
7. defectDetected: Boolean flag whether a defect is detected
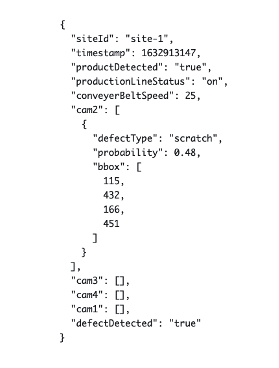
Figure 8 – Sample JSON
Series of different services work together to store, process and feed the above data into Thingsboard dashboard (see block “6”, “7” in Figure 5). The motivation for selecting these services was to have an architecture that is serverless, and scalable.
1. AWS IoT Core: Acts as a single source of entry for all raw metrics from the field and makes it available to be processed by several downstream services.
2. Amazon Kinesis Firehose: Intermediatory service to ingest raw metrics from IoT Core into S3 to enable data logging.
3. Amazon Timestream: Enables modelling time as a first-class citizen to ingest real time data. Also provides analytic functions (e.g., Avg, Sum, Between, Bin, Interpolate) to aggregated and process raw data into business consumable metrics for downstream visualization
Currently, our setup can assess the quality of a bottle every 1 second which includes time for the bottle to pass through our quality control system and the results to be uploaded to the cloud for downstream processing. Thingsboard dashboard can intake results of 10 such factories in parallel to showcase business relevant metrics such as OEE. Our architecture is designed to scale this to multiple factories as required.
Equipment Data Analytics
In order to traceback the root cause of defects and generate meaningful alerts for anomaly, we correlate the defect inference results with real-time machinery metrics during the manufacturing process (“data enrichment”). For example, a machine datapoint “belt speed=100 rps” doesn’t provide any meaningful information by itself, but when combined with its equipment ID, production line ID, timestamp, normal thresholds as well as other related equipment data such as temperature and vibration, this allows us to leverage an anomaly detection (or outlier detection) algorithm to discover abnormal patterns in the process.
In order to do this (see block “5”, “6”, “7” in Figure 5), we deploy an AWS Lambda function on the edge gateway device to consolidate equipment metrics in JSON format and to send data to AWS IoT core. AWS IoT core routes the real-time equipment metrics (e.g., equipment ID, conveyor belt speed, production status) to Amazon Timestream.
We then schedule with Amazon CloudWatch to execute another AWS Lambda function every 1 minute: it retrieves a bulk of data during the last 60 seconds from Amazon Timestream and puts the packet in a queue of Amazon SQS. Thingsboard ingests the packet from the queue and refreshes the dashboards. (See block “9” in Figure 5)
The reason to have Amazon SQS in the middle is to make the system loosely coupled and more robust, which avoids data loss in scenarios such as:
– Connectivity issues between the lambda function and Thingsboard;
– Thingsboard is overloaded and cannot ingest data before next packet arrives.
Notifications
Lastly, in-time notifications can help industrials act quickly once there is something abnormal detected. We define business logics (e.g., quality ratio is lower than 80% for x minutes) in an AWS Lambda function and use Amazon Simple Notification Service to send the notification to industrials (See block “8” in Figure 4).
Conclusion
Manufacturing companies can use Amazon Machine Learning and IoT services, along with partner software and hardware, to reinvent their industrial processes and improve quality control of their manufactured products. A typical deployment follows the path to “prove with one site” and “scale with many sites”. Together with AWS services, companies can build and test complex solutions in one site and immediately deploy them to other sites using the same APIs by leveraging AWS global infrastructure. Having the ability to use a reproducible mechanism to automate quality inspection allows to multiply the number of quality checks among the production line, making it easier to trace back defect and detect them proactively – improving ultimately the overall quality of products exiting the factory for the benefit of your customers.
If you want to discover more industrial use-cases, have a look at our AWS for Industrial website.