AWS Partner Network (APN) Blog
Calculating Tenant Costs in SaaS Environments
By Tod Golding, Partner Solutions Architect at AWS
In traditional single-tenant environments, calculating and aggregating infrastructure costs is a pretty straightforward exercise.
Typically, each application or customer has its own collection of dedicated resources and tallying the costs is simply a matter of categorizing and summing those costs. However, in multi-tenant software as a service (SaaS) environments, this becomes a much more challenging problem.
With SaaS, tenants often share some or all of a system’s infrastructure resources. A database, for example, may hold all the data for all tenants. How, then, do you apportion costs to each tenant? This gets even more complicated with other forms of tenant consumption like compute or bandwidth. Generally, with the varying flavors of system partitioning that are used to build SaaS systems, it becomes increasingly difficult to associate tenants with specific infrastructure costs.
While the challenges of calculating tenant costs continue to get more complex, the need for tenant cost data is still essential for many SaaS businesses. SaaS organizations often rely on some understanding of the cost per tenant as a key element of their broader economic and business model. This cost data can directly influence the pricing dimensions and tiering strategies that are adopted by a SaaS provider.
This blog post examines some of the strategies that you can use to capture and analyze tenant consumption data in multi-tenant environments. It highlights some of the challenges associated with instrumenting your services and architecture to enable a more granular view of consumption that you can use to inform your price modeling.
Do I Really Need Cost Per Tenant?
For some SaaS teams, the calculation of per-tenant costs can seem like overkill. It’s easy to assume that the energy expended to gather and analyze this data may not be worthy of the investment. Even when technical teams might be advocating this direction, the business may resist moving this requirement ahead of other features and functions that are essential to customers. These factors generally conspire to push cost-per-tenant calculations to the back burner.
The challenge here is that—without this data—you may be missing key insights into your system’s profile that may directly impact both the technical and business dimensions of your offering. Imagine, for example, that you have a tiered product offering with basic, advanced, and professional tiers. Let’s presume that the basic tier is somewhat inexpensive, while the professional tier is more on the pricey end of the spectrum. Without a clear picture of your system’s underlying cost metrics, the business might pick some consumption dimension to define the boundary between each tier.
Let’s say, for example, we’re an e-commerce product and we’ve used catalog size as the defining metric that separates the tiers of our system. In this scenario, the business would simply begin acquiring customers and pouring them into the system without any concern for how this might impact the bottom line. Now, if we take this system and begin to collect cost per tenant data, the infrastructure consumption breakdown might end up looking like the bar chart shown below. Here, you’ll notice that most of the tenants have signed up for the basic tier. However, the infrastructure costs associated with the basic tier far exceed that of the other two tiers.
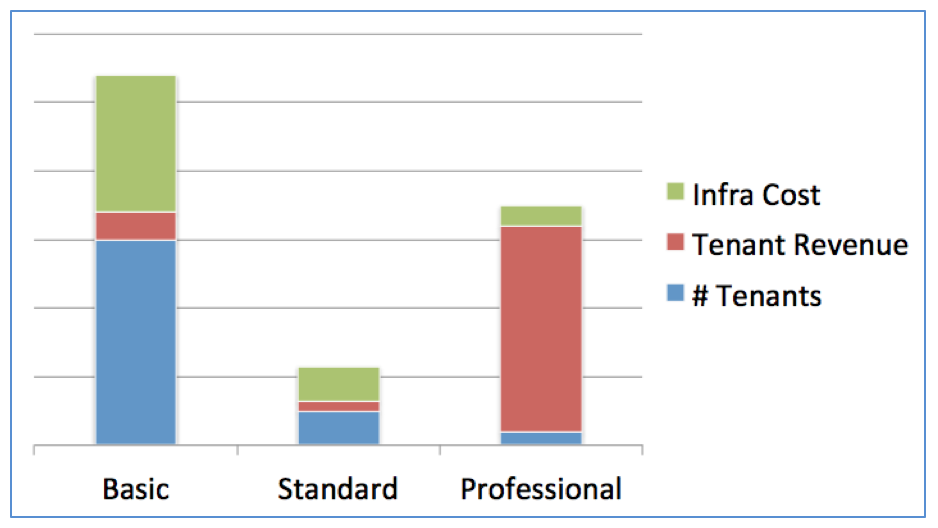
Diving deeper, we see that a flaw in the pricing model assumed that infrastructure consumption would correlate directly to catalog size. However, in reality, consumption ended up being driven by the mix of products that were for sale at a store. This created a significant imbalance between revenue and costs where the lowest revenue customers were generating a disproportionate level of expenses.
This scenario highlights a very common challenge for SaaS organizations where their business model and tiering strategies don’t always align with the overhead associated with each tenant. So, while the business may not always be focused on the cost-per-tenant number, it’s still essential to give it visibility since its impact can often go overlooked.
Giving the Business Options
The previous example highlights the tight linkage that often exists between the business and technical SaaS teams. The architectural choices that are made by SaaS developers have the potential to shape and influence the menu of pricing and packaging options offered by the business. The more flexibility you are able to provide the business, the more likely it is that you’ll be able to rapidly respond to the diverse requirements of tenants—each of which may have their own scale, performance, and consumption profiles.
Equipped with cost data, SaaS architects are in a much better position to make tradeoffs that will consider the current and, potentially, future needs of the business. This data becomes a tool that can be used to offer the business options that may have otherwise been outside the view of product managers and strategists who are responsible for defining packaging and pricing options. Teams will often find points of inflection in their cost dynamics that can translate directly into differentiators that separate the tiers of their SaaS system.
The broader goal here is to make choices in your SaaS architecture that better align a tenant’s expectations with their experience. If a tenant is a $29/month, basic tier tenant, they are likely to understand that their experience will be different than that of the $5000/month, professional tier tenant. Supporting this model often means introducing variations in policies and—in some cases—architectural models that offer distinct tenant experiences for each tier of your solution. Examples of how this can be achieved is outlined in a blog post on Optimizing SaaS Tenant Workflows and Costs as well as a presentation on Optimizing SaaS Solutions on AWS.
Ultimately, this is all about giving the business options. If, tomorrow, the business comes to you with some new way they’d like to package your solution to address a new opportunity or market segment, you’d want to be in a position to understand how this new offering might impact costs. The data you provide to this discussion could be fundamental to determining the viability of the new offering.
The Hard Part: Instrumenting Your Solution
While the value of cost per tenant data is easy to grasp, capturing and aggregating this data can be a bit more involved. The nature of your tenant partitioning model, the compute model you’re using, and any number of other factors could influence your approach to assembling your view of tenant costs. The following sections provide a breakdown of common considerations that might affect how you instrument your solution to capture tenant cost data.
Analyzing Costs in a Silo Model
Some SaaS providers rely exclusively on a siloed partitioning model where each tenant is housed in a mostly isolated infrastructure. This isolation might be mandatory for some domains that have strict regulations that prohibit shared infrastructure. For these environments, more pronounced boundaries between each tenant can simplify the efforts to aggregate and derive cost analytics.
Amazon Web Services (AWS) offers architects a few constructs for implementing tenant isolation. Two common strategies involve the usage of AWS accounts and virtual private clouds (VPCs). With the account model, each tenant is provisioned into a completely separate account. This account creates a distinct view of all the resources associated with the tenant. These accounts can also use the AWS linked account model, which associates an account with a master account. This enables all tenant consumption to be rolled up to a single account while giving you a view of consumption at the linked account level so you can easily identify all the costs associated with a single tenant.
The other common isolation scheme involves creating separate VPCs for each tenant. With this approach, you can isolate tenants without creating separate accounts for each tenant. This often scales better and simplifies the provisioning model. However, it also adds a degree of complexity to the cost instrumentation. Instead of relying on linked accounts to summarize tenant spend, you’ll need to apply AWS tags to your infrastructure to associate it with your tenants. These tags will then be used to aggregate the spend of each tenant.
In a more siloed model, you may want to consider leveraging partner solutions to simplify the aggregation and analytics of your tenant costs. AWS Partner Network (APN) Partners like CloudHealth and Cloudability, for example, provide cost analytics tools that can streamline your ability to perform tenant analytics.
Analyzing Costs in a Pooled Model
In a pooled model, where tenant resources are shared, the attribution of tenant costs can be more challenging. Here, you must employ more specialized strategies to properly capture and classify tenant activity. You’ll need to rely on measurements of actual tenant interactions with your systems resources to apportion load and consumption, and derive an approximation of tenant costs. This typically demands more effort to both instrument your solution and to aggregate the resulting metrics.
Further complicating the pooled model is the reality that each resource type may require a slightly different approach to instrumenting and aggregating cost information for individual tenants. Compute, for example, will likely require a very different approach than storage. The different types of storage (block, object, relational, and NoSQL), for example, might demand separate strategies for measuring consumption.
Let’s consider how, in a pooled environment, you might derive a tenant’s consumption from their activity. The diagram below depicts a simplified view of an Amazon EC2 Container Service (Amazon ECS) cluster running services in a pooled, multi-tenant environment. This cluster includes two services that are running in containers (Checkout and Catalog), both of which are being invoked by individual tenants.
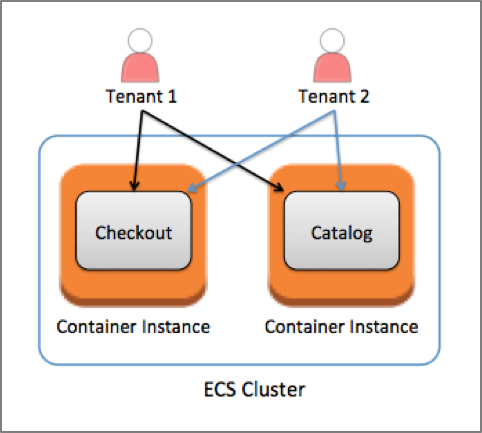
As the tenants use these services, they consume compute resources. The question is: How much of these resources are actually being consumed by each tenant? Tenant 1, for example, may be pushing the system very hard and selling lots of items, forcing the scale out of the cluster, or consuming a disproportionate number of the containers in the cluster. Tenant 2, on the other hand, may be imposing minimal load.
The challenge, then, is to instrument these services to surface metrics data that can be used to infer the level of consumption for each tenant. Ultimately, this comes down to selecting a strategy that best maps activity to consumption for a service. You might decide to track changes in CPU activity, or you might track the frequency of calls to a service—there’s no absolute model that can universally characterize consumption for all your services. However, with some notion of frequency, you should be able to get close to a reasonable approximation of consumption for many of the services that are part of your SaaS solution.
Fortunately, instrumenting your compute services will likely mesh nicely with other logging and metrics gathering mechanisms you already employ. The general strategy here would be to instrument all the entry points of your services with log events. With this data, you’ll be able to determine which methods are being called and with what frequency. If you add the tenant context to these logging calls, you’ll have the foundational elements that can be used to infer tenant consumption of these services.
The diagram below provides a conceptual model for how you might aggregate a series of calls to a service and use that data to determine a tenant’s consumption. Here, we’ve simply used the frequency of calls to determine a percentage of activity for a tenant. This gives you a model for apportioning the compute costs associated with this service to each tenant based on these percentages.

This represents a highly simplified version of what you might build. Still, it gives you a sense of what might be involved in arriving at a reasonable distribution of tenant compute costs. The good news here is that the mechanisms needed to support the collection of this data overlap heavily with the general analytics tooling that you’ll want to put in place to analyze and evaluate tenant activity. The key is to ensure you’ve collected the data you need with the context that is required to support your cost allocation model.
Calculating Storage Costs
While the previous example gave us some sense of how we might calculate compute consumption, this same model may not be a good fit for analyzing storage costs. A tenant could, for example, consume significant amounts of compute and still have a minimal impact on storage costs. There is no guaranteed correlation between compute and storage consumption in SaaS environments.
Storage also adds some new wrinkles to the cost equation. With storage, you may need to consider how both the size of the data and the IOPS impact a given tenant’s costs. This means your cost analytics must apportion all the elements of storage costs that may appear in your AWS bill to the tenants of your system.
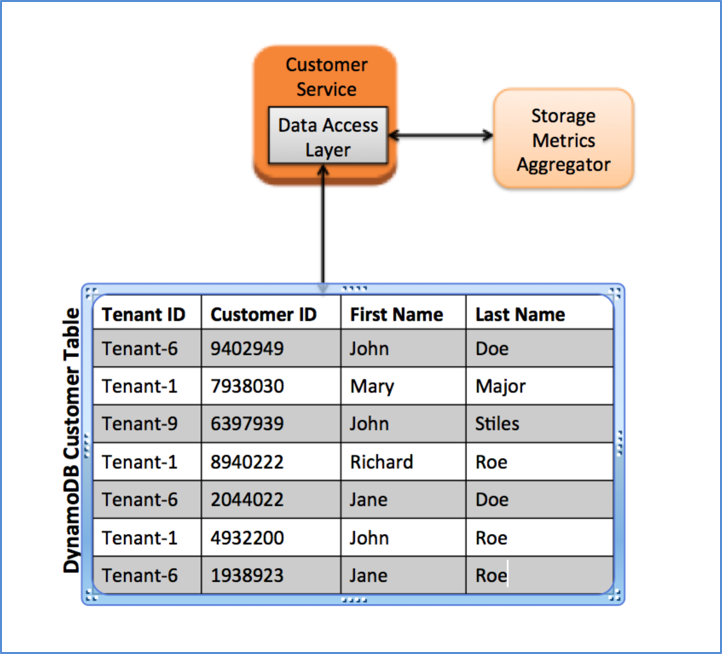
The analysis of a metric like IOPS has parallels to what we’ve discussed for analyzing compute consumption. The goal would be to derive some notion of tenant storage activity from a tenant’s interactions with the data. These metrics could be derived from each tenant’s interactions with a data access layer that is employed by your solution (as depicted in the following diagram). With this approach, each call to acquire or manage data would be processed by a common framework that would capture and aggregate tenant storage activity. This activity would then be used to apportion costs to each tenant.
Determining a tenant’s impact on the system’s storage footprint is a less dynamic process. Here, you may have data stored in some AWS services (Amazon DynamoDB, Amazon Simple Storage Service (Amazon S3), Amazon Redshift, Amazon Elastic Block Store (Amazon EBS), and so on) and you’ll need to determine what percentage of that storage belongs to each tenant. Assessing this data will typically require a process that can periodically analyze the data distribution to determine a tenant’s storage consumption. The mechanism used for this analysis will vary based on your data partitioning model and the type of storage resource being evaluated. Amazon S3 and DynamoDB, for example, would require very different strategies for analyzing tenant storage consumption.
As you put these storage metrics into place, you’ll need to determine how best to aggregate these costs. Should there be one flat cost that aggregates all the aspects of storage, or should you provide a more detailed breakdown of the costs that provides access to all the dimensions of storage? There is no one right answer here. However, having the details could help inform some of the choices you might make with your architecture.
Being Good Enough
Accuracy is certainly important when you’re capturing metric data. At the same time, when working with tenant cost calculations, it’s important to remember that—in most cases—you’re not attempting to achieve a perfect level of accounting that tracks every ounce of consumption. Unless this data is directly driving billing, which it often is not, the goal is to get data that is good enough. The focus should be on building a model that accurately represents the general distribution of tenant consumption. Equipped with this data, you and the business will be in a much better position to assess the effects of the product and architecture changes you’re considering.
As you start down this path, you may choose to incrementally introduce elements of metrics collection into the different aspects of your system. You may find compromises and tradeoffs along the way that can simplify your approach and still return enough data to give you a manageable level of insight into customer spending profiles.
Bonus Operational Value
The added effort to instrument your application with these tenant metrics has value beyond the economics of understanding tenant spend. The data captured can also have operational value, providing tenant-centric views into system activity that may be used to detect or troubleshoot issues that might arise.
The data captured can also be used to help shape your operational policies. Suppose you see that a tenant’s activity is imposing load at a rate that is stretching the scaling policies of your environment. With the tenant view of consumption, you can see how tenant-specific usage patterns are exercising the architecture of your environment and react with more precision.
Billing Metering vs. Tenant Consumption
Metering is an essential aspect of many SaaS environments. SaaS providers will often develop a billing and tiering strategy around some dimension of consumption. These consumption dimensions cover a wide range of possibilities. Bandwidth, number of users, storage usage—these are all flavors of billing models that are used to correlate tenant activity with some billing construct.
On the surface, this sounds like the same model of consumption we’ve been discussing, and there can be some conceptual overlap. However, this notion of metering is targeted at capturing just those metrics that are meant to derive a tenant’s bill. They may not map to the notion of tenant infrastructure consumption, which is focused squarely on determining the actual cost associated with each tenant’s activity. It’s essential for SaaS businesses to understand and separate these two concepts as they develop pricing and packaging models.
Correlating AWS with Billing Data
There are two parts to the tenant consumption equation. So far, we’ve focused on the instrumentation and allocation of tenant consumption. This data tells us the portion of the system’s resources that are being used by a given tenant. What it doesn’t tell you is the actual costs that a tenant is incurring. Getting to this next level of insight could be viewed as optional, but having the full picture of consumption mapped to cost represents the real payoff.
Acquiring and correlating the data will require you become familiar with the AWS billing data. You’ll need to dig into your AWS bill and consider how best to correlate the detailed billing information with your consumption data. There are a number of options and approaches, ranging from a high-level allocation of overall costs to more granular, detailed mappings of line items in your bill. Generally, in the spirit of being “good enough” as outlined above, you might want to start with a fairly basic model that eliminates the need to dig into the details of AWS billing reports. Again, this is more about having some approximation of the cost—not building an accounting system.
The Business May Not Ask—But They’ll care
Often, in the rush to address customer and market needs, it’s very easy for SaaS providers to push tenant costs to the background. This might make sense in the fail fast mindset of getting a product out the door. The business is rarely going to make infrastructure costs—especially before they have lots of customers—a central part of their thinking.
While tenant costs may not be at the forefront of your product strategy, the business often pays closer attention when they begin to see how this data can impact the bottom line. Once organizations see the numbers, they will begin to ask more informed questions about how new features and product strategies might impact the cost per tenant. You’ll also find that technical teams will begin to use this data to find new and creative ways to evolve an application’s architecture without over-inflating the operational costs.
Metrics Matter
Most SaaS businesses rely heavily on metrics. Having the pulse of your customer’s often-complex usage patterns is essential to understanding how to market, price, position, and build your solution. Infrastructure overhead often represents a significant percentage of a SaaS provider’s costs. So, having a precise view of how tenants are imposing load on your system gives the business and technical teams another variable that can shape the pricing and tiering strategies you choose to offer.
As you look at strategies for capturing and analyzing cost metrics, you should view this as an iterative process. You can start with some very basic mechanisms to gain insights into tenant footprints that might otherwise go overlooked. Then, with time, you can evolve and mature this model to add depth to your cost analytics.
The key is to bring visibility to the cost per tenant metric and make it part of the mental math of the business.
About AWS SaaS Factory
AWS SaaS Factory helps organizations at any stage of the SaaS journey. Whether looking to build new products, migrate existing applications, or optimize SaaS solutions on AWS, we can help. Visit the AWS SaaS Factory Insights Hub to discover more technical and business content and best practices.
SaaS builders are encouraged to reach out to their account representative to inquire about engagement models and to work with the AWS SaaS Factory team.
Sign up to stay informed about the latest SaaS on AWS news, resources, and events.