- Databases
- Amazon Neptune
- Graph and AI
Graph and AI
Why graph?
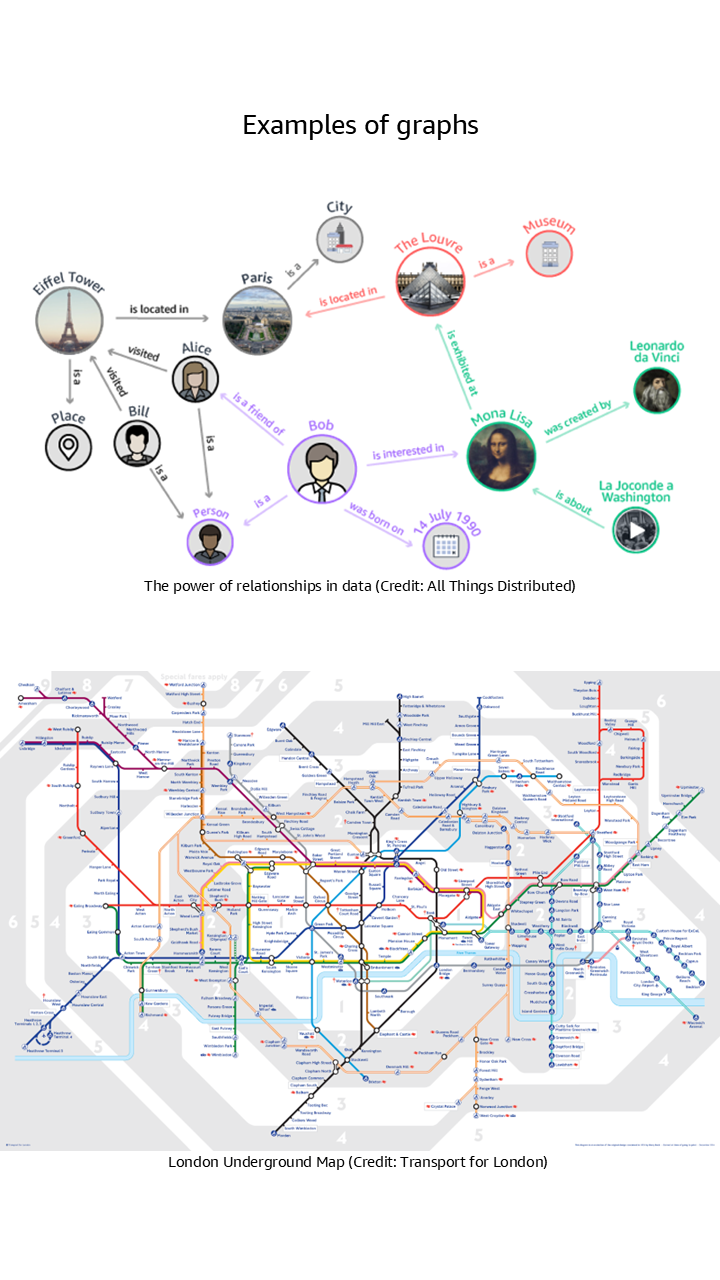
Every organization wants to get value from their data which requires them to query the relationships in their data. If you ever ran a SQL query with a JOIN, you have queried a relationship which defines how data in one part of the system relates to data in another (e.g., customer ID and order number). Relationships can be one-to-one, one-to-many, and many-to-many.
The more data is connected and as the size and complexity of the connected data increases, the relationships become more complex to store and query. Attempting to use SQL to query connected data is futile as multiple JOINs result in performance degradation. Graphs, however, are uniquely designed to query connected data.
If you want to build and deploy generative AI or agentic AI, using connected data is imperative. With generative AI, querying connected data is vital to improve AI accuracy and explainability. For agentic AI, connected data provides the essential contextual information that enables agentic AI to perform complex, multi-step tasks autonomously.
We will dive into knowledge graphs, which are foundational for both generative AI and agentic AI. Then, we will review additional graph types such as fraud graphs for fraud detection, security graphs for cybersecurity, and identity graphs for customer 360. Before we dive, some definitions:
- Nodes are data points representing entities such as people, products, transactions, and more.
- Edges are connections between nodes which represent the relationships between the data points.
- Properties are key-value pairs that store additional information about nodes and edges.
Why graph databases?
The most effective way to build and store a graph is to use a graph model and a graph database. Graph databases are designed to store and navigate connected data. They make it easier to model and manage highly connected data, treat relationships as “first class citizens”, have flexible schemas, and provide higher performance for graph traversal queries.
Understanding knowledge graphs
What is a knowledge graph
A knowledge graph captures the semantics of a domain’s data – both structured and unstructured – using a graph data model that structures data as a network of connected entities linked by defined relationships.

Why you need a knowledge graph
For agentic AI, knowledge graphs are a core technology for creating a semantic layer of your data so agents can understand the contextual meaning of data. Knowledge graphs enable better interoperability, data discovery, and deeper insights by making data understandable to both humans and machines. If you ever used Google Search, odds are the search results used a knowledge graph.
For generative AI applications, you need to use GraphRAG to improve the accuracy of the LLMs. The core component of GraphRAG is a knowledge graph. If you want a fully managed GraphRAG experience, Amazon Bedrock Knowledge Bases automates the entire workflow and uses Amazon Neptune under the hood for its knowledge graph technology. If you prefer to build your own GraphRAG experience, Neptune offers a GraphRAG toolkit, an open source Python library that lets you easily build GraphRAG workflows, and other architectural patterns by industry (such as Customer 360).

Use cases
- Build virtual assistants, chatbots, or agentic AI. Build context-aware systems that can derive an answer based on queries and a vast knowledge base. As an example, an airline can build a chatbot that provides real-time assistance to help customers book tickets, check flight status, check in, and track bags.
- Analyze unstructured and structured data together. Data, documents, and processes may be stored across teams and tools. By linking relevant pieces of data, you can build systems that can recommend people to projects, connect related projects, or centralize access to avoid duplicate efforts. You can extract entities from text-heavy content such as emails, word documents, PDF, and spreadsheets or meta-data from video, audio, and photos to build a knowledge graph. You can augment this knowledge graph with structured data from CRM and ERP systems to get a comprehensive.
- Improve process efficiency and analyze dependencies. In manufacturing, you can track the different stages building and delivering a product from changes to inventory levels to store shipments using a knowledge graph. In life sciences, you can use a knowledge graph to track an experiment, trials and characteristics of drugs. In financial services, you can build a knowledge graph for the holding company of a security, the security, and the beneficial holding. You can augment this graph with social media and industry events to record the relationships to provide insights into dependencies between firms.
- Insights with machine learning. You can use machine learning services with knowledge graphs for better decision making and knowledge discovery. You can use machine learning services to build a knowledge graph from unstructured data such as text, audio or video. You can also use the knowledge graph as input to machine learning to build smarter systems to detect fraud or recommend a product.

Understanding identity graphs
What is an identity graph
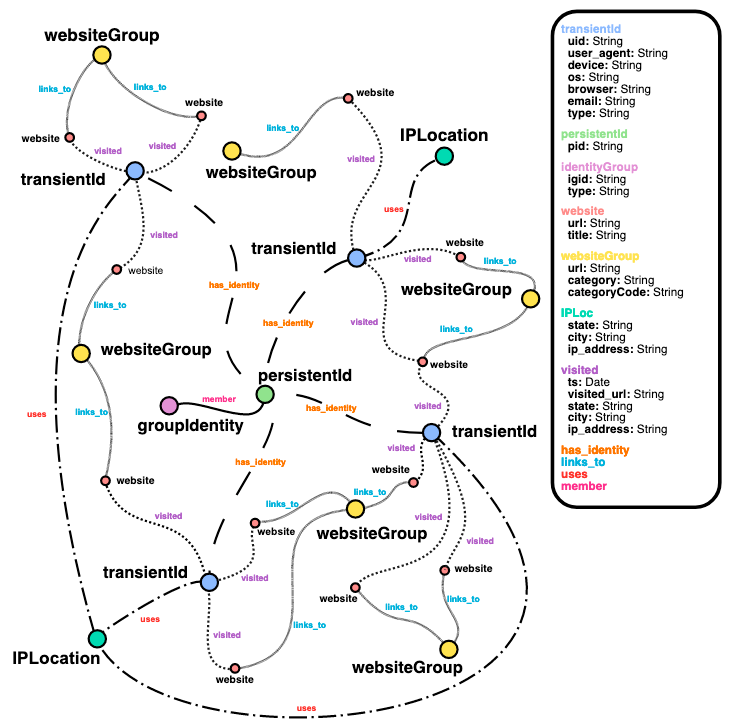
An identity graph provides a 360 view of customers and prospects based on their interactions with a product or website across a set of devices and identifiers. It helps you understand the journey, such as a purchase journey, in chronological order so you can make recommendations to close a deal. Identity graphs can store profile data and easily connect new consumer identifiers to profiles.
Why you need an identity graph
If you want to deploy real-time personalization, build advertising targeting for millions of users with 360 view of each customer, or build a customer data platform (CDP) with your own proprietary business rules to respond to customer signals in real-time that informs workflow orchestration, you need an identity graph.

Use cases
- Link customer identifiers. Your customers interact with multiple devices, browsers, apps, and email addresses to interact with products and ads. An identity graph allows you to establish persistent identifiers to link all related customer devices and identifiers, enabling you to create unified customer profiles which can be used for targeting and personalization.
- Build audiences and segmentation. Your customers view billions of web pages and apps, and generate billions of cookies across devices, generating billions of data relationships that hold hidden insights on customer behavior. An identity graph allows you to tap into these data relationships to create audiences based on similar interests, preferences, and purchases.
- Analyze customer journeys. Your customers generate many signals of intent such as search queries, product page views, ad clicks, purchases, and loyalty program enrollments. An identity graph allows you to analyze end-to-end customer behavior to gain a 360° view of your customers so you can better understand purchasing patterns and improve marketing attribution.
- Leverage customer data with privacy compliance. Managing your customers’ personally identifiable information (PII) and Non-PII data separately is operationally complex, and some regulations require combining PII and Non-PII sources to support request for information (RFI) and delete requests. An identity graph allows you to store and manage PII and non-PII data together.

Understanding security graphs
What is a security graph
A security graph is a graph representing assets that you want to protect and the relationships between these assets and roles within your organization. Assets can include computer networks, telecom networks, distribution routes, payment systems and other parts of your IT infrastructure. Security graphs can be used for proactive detection, reactive investigation, and as part of a defense-in-depth strategy to improve IT security posture.

Why you need a security graph
It’s simple. Bad actors plan their schemes using graphs to understand what infrastructure have pathways to the system or data they target, what identities they can compromise that will give them access to that infrastructure, and what telemetry or monitoring they need to circumvent. Therefore, to protect your organization’s resources, you should use a graph as today’s security profiles take a layered approach to provide redundancy should any layer fail. These layers are often loosely coupled and individually managed.
By storing this information in a graph, the relationships between those layers can be modeled and analyzed to easily identify weaknesses, such as over extended permissions leading to resources vulnerability. Then, you can put protections in place. If a resource is compromised, you can query your graph to find out the attack surface and where security may be compromised through the installation of backdoors or other malware. As an example, you can use a security graph to query for resources or pathways that expose a cluster with a public IP address to check for security and compliance.

Use cases
- Cloud Security Posture Management (CSPM). CSPM is the process of continuously monitoring the cloud infrastructure to detect gaps in the security, misconfigurations, compliance risks, and enforce policies where such gaps exist. With graph databases, you can visualize your cloud infrastructure and resources. Getting a holistic, contextual view of your cloud inventory provides visibility into cloud assets, helping you to plan, predict, and mitigate any risk associated with your infrastructure.
- Data flow/exfiltration prevention. Data exfiltration is a malicious activity involving targeting, copying, and transferring sensitive data outside of your control. Common targets include financial records, customer data, and intellectual property. Attackers can often do this remotely and disguise it to look like legitimate traffic, making it difficult to detect. You can graph your data flow from source to destination, which helps you to capture incidents when data was transferred out of your control. For example, mapping the process of loading data from an Amazon S3 bucket to Amazon Neptune helps you to identify cases where data is copied elsewhere, such as a different S3 bucket.
- Identity and access management. You can use graph databases to monitor and visualize IAM policies and ensure that the right users and roles have the appropriate access to the right resources. A graphical representation of the resources an IAM policy has access to will help you uncover details such as unwanted access to a resource for a security group.
- Digital forensics. In the event of data theft, breaches, or unauthorized network penetration, organizations need various digital forensic tools to identify, preserve, analyze, and present digital evidence. By using graph databases to map your users to the organization’s network resources and data, you can establish a chain of custody for the affected data and resources, outlining access patterns and pointing out possible areas of vulnerabilities.

Understanding fraud graphs
What is a fraud graph
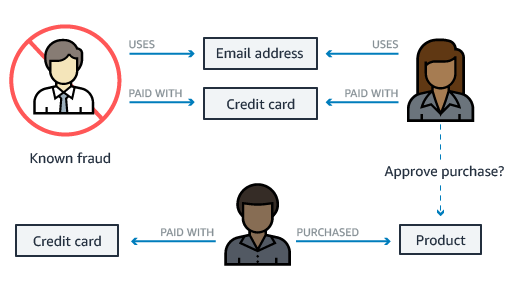
A fraud graph stores the relationships between the transactions, actors, and other relevant information to enable you to find common patterns in the data and build applications that can detect fraudulent activities. Using a fraud graph, you can identify a network of connected users and items such as e-mail accounts, addresses, and phone numbers that they have in common. This results in a highly connected and complex network of information, which can be queried, visualized, and analyzed to detect fraud.
Why you need a fraud graph
You need a fraud graph for fraud prevention. Globally each year, organizations lose tens of billions of dollars to fraud. Fraud can be carried out by a single bad actor, or a network of participants using multiple identities colluding with each other. Multiple people can collude to commit fraudulent transactions and create fraud rings, which may have hundreds of members making it challenging to detect fraud. As an example, transactional data, such as credit card transactions, has basic attribute information but lacks the relationships between people, shared addresses, and more, which makes fraud detection challenging.
With a graph database, you can execute fast graph queries to detect fraud scenarios such as loan fraud, credit card fraud, anti-money laundering, and online gaming fraud. You can use Neptune to build real-time fraud detection solution and get started with these fraud graph code samples.

Use cases
- Detect transaction fraud rings. You can easily detect money laundering activities using a fraud graph with your fraud detection app by uncovering suspicious activity and hidden patterns.
- Investigate claims fraud. Through the use of a fraud graph, you can accelerate fraud investigations through visualization of the interactions across all involved parties to identify duplicae claim, identity collusion, and more.
- Identify hidden account takeovers. You can swiftly identify cyberattacks that bypass traditional security alerts in which a fraudster uses unauthorized access to a legitmate user's account and takes control to drain financial accounts.
- Detect quote fraud. With a fraud graph, you can efficiently expose ghost brokers that attempts to trick people into purchasing fake insurance or credit instruments with fake websites.

Did you find what you were looking for today?
Let us know so we can improve the quality of the content on our pages