AWS News Blog
Visualize and Monitor Highly Distributed Applications with Amazon CloudWatch ServiceLens

|
Increasingly distributed applications, with thousands of metrics and terabytes of logs, can be a challenge to visualize and monitor. Gaining an end-to-end insight of the applications and their dependencies to enable rapid pinpointing of performance bottlenecks, operational issues, and customer impact quite often requires the use of multiple dedicated tools each presenting their own particular facet of information. This in turn leads to more complex data ingestion, manual stitching together of the various insights to determine overall performance, and increased costs from maintaining multiple solutions.
Amazon CloudWatch ServiceLens, announced today, is a new fully managed observability solution to help with visualizing and analyzing the health, performance, and availability of highly distributed applications, including those with dependencies on serverless and container-based technologies, all in one place. By enabling you to easily isolate endpoints and resources that are experiencing issues, together with analysis of correlated metrics, logs, and application traces, CloudWatch ServiceLens helps reduce Mean Time to Resolution (MTTR) by consolidating all of this data in a single place using a service map. From this map you can understand the relationships and dependencies within your applications, and dive deep into the various logs, metrics, and traces from a single tool to help you quickly isolate faults. Crucial time spent correlating metrics, logs, and trace data from across various tools is saved, thus reducing any downtime incurred by end users.
Getting Started with Amazon CloudWatch ServiceLens
Let’s see how we can take advantage of Amazon CloudWatch ServiceLens to diagnose the root cause of an alarm triggered from an application. My sample application reads and writes transaction data to a Amazon DynamoDB table using AWS Lambda functions. An Amazon API Gateway is my application’s front-end, with resources for GET and PUT requests, directing traffic to the corresponding GET and PUT lambda functions. The API Gateway resources and the Lambda functions have AWS X-Ray tracing enabled, and the API calls to DynamoDB from within the Lambda functions are wrapped using the AWS X-Ray SDK. You can read more about how to instrument your code, and work with AWS X-Ray, in the Developer Guide.
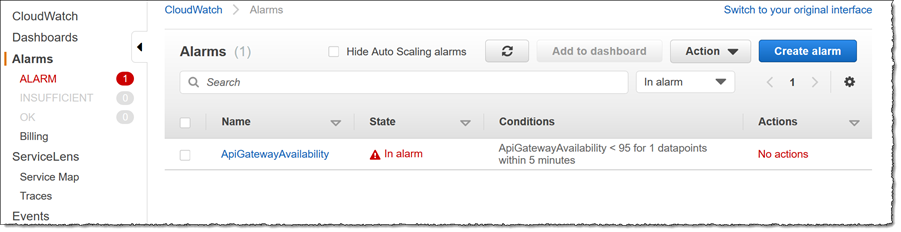
An error condition has triggered an alarm for my application, so my first stop is the Amazon CloudWatch Console, where I click the Alarm link. I can see that there is some issue with availability with one or more of my API Gateway resources.
Let’s drill down to see what might be going on. First I want to get an overview of the running application so I click Service Map under ServiceLens in the left-hand navigation panel. The map displays nodes representing the distributed resources in my application. The relative size of the nodes represents the amount of request traffic that each is receiving, as does the thickness of the links between them. I can toggle the map between showing Requests modes or Latency mode. Using the same drop-down I can also toggle the option to change relative sizing of the nodes. The data shown for Request mode or Latency mode helps me isolate nodes that I need to triage first. Clicking View connections can also be used to aid in the process, since it helps me understand incoming and outgoing calls, and their impact on the individual nodes.

I’ve closed the map legend in the screenshot so we can get a good look at all the nodes, for reference here it is below.

From the map I can immediately see that my front-end gateway is the source of the triggered alarm. The red indicator on the node is showing me that there are 5xx faults associated with the resource, and the length of the indicator relative to the circumference gives me some idea of how many requests are faulting compared to successful requests. Secondly, I can see that the Lambda functions that are handling PUT requests through the API are showing 4xx errors. Finally I can see a purple indicator on the DynamoDB table, indicating throttling is occurring. At this point I have a pretty good idea of what might be happening, but let’s dig a little deeper to see what CloudWatch ServiceLens can help me prove.
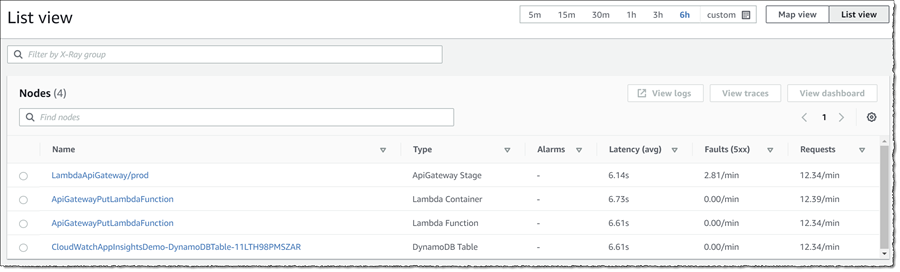
In addition to Map view, I can also toggle List view. This gives me at-a-glance information on average latency, faults, and requests/min for all nodes and is specifically ordered by default to show the “worst” node first, using a sort order of descending by fault rate – descending by number of alarms in alarm – ascending by Node name.
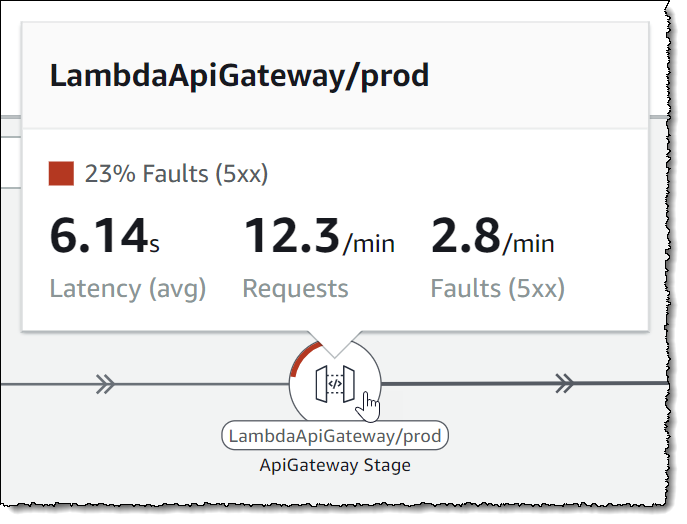
Returning to Map view, hovering my mouse over the node representing my API front-end also gives me similar insight into traffic and faulting request percentage, specific to the node.
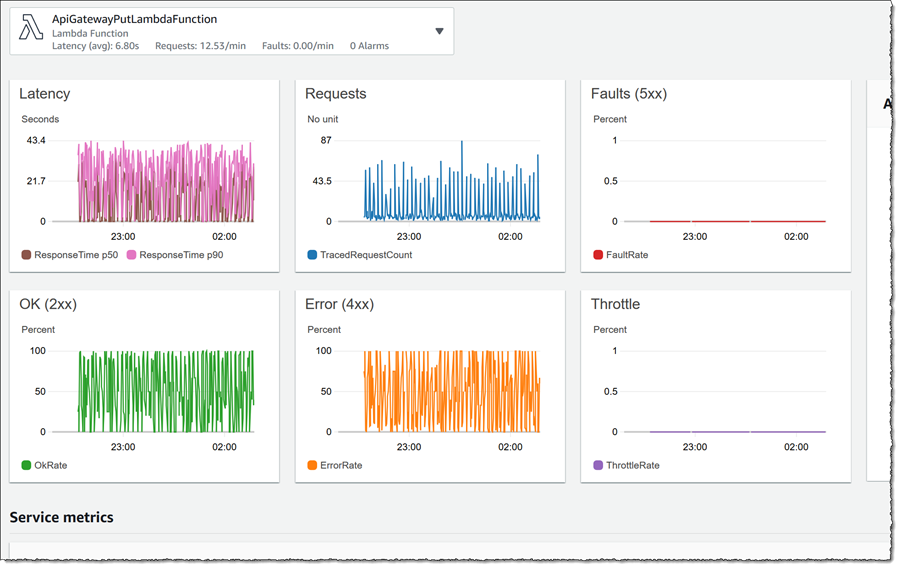
 To see even more data, for any node, clicking it will open a drawer below the map containing graphed data for that resource. In the screenshot below I have clicked on the ApiGatewayPutLambdaFunction node.
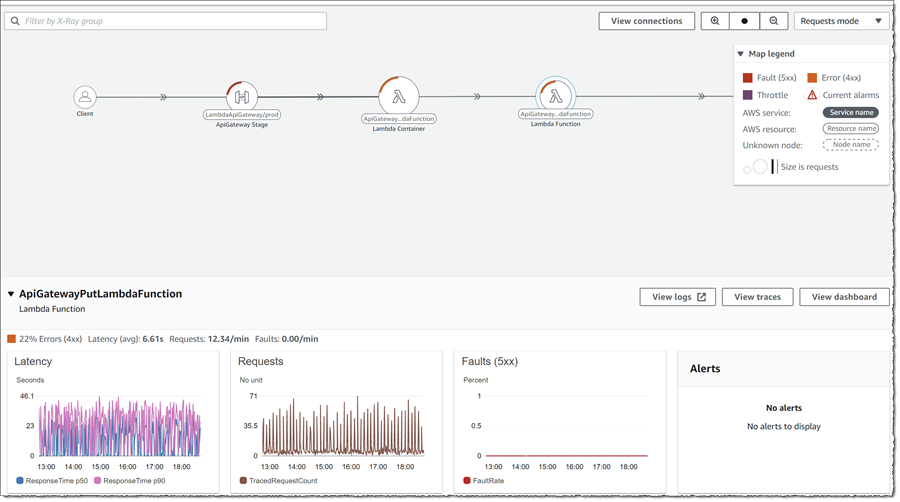
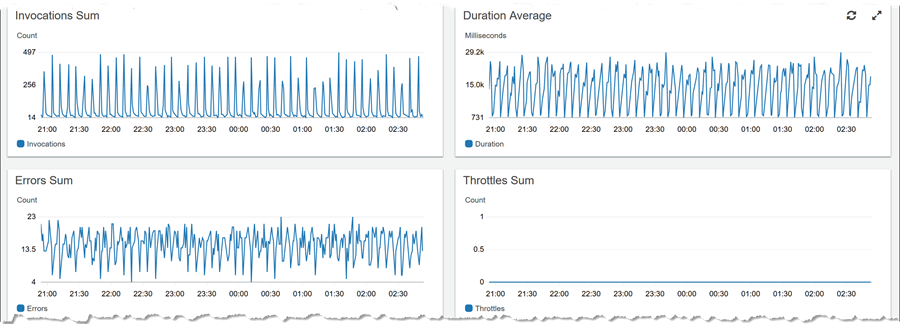
The drawer, for each resource, enables me to jump to view logs for the resource (View logs), traces (View traces), or a dashboard (View dashboard). Below, I have clicked View dashboard for the same Lambda function. Scrolling through the data presented for that resource, I note that the duration of execution is not high, while all invokes are going into error in tandem.
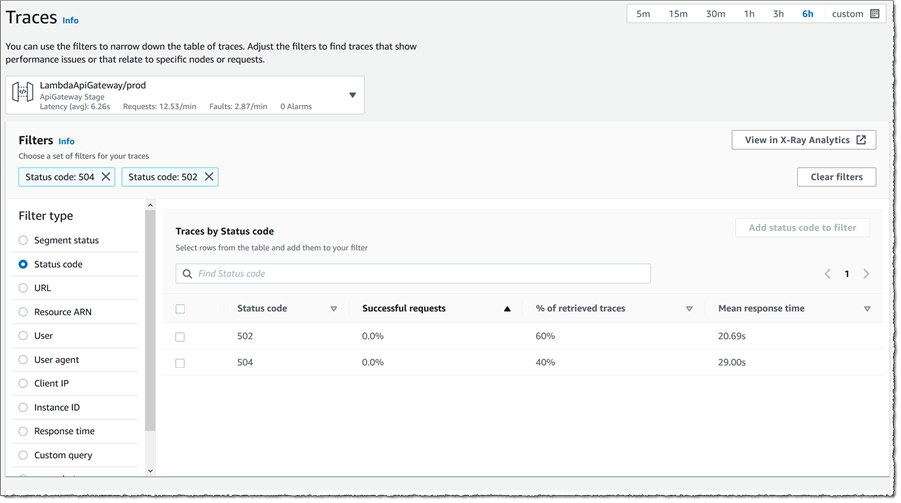
Returning to the API front-end that is showing the alarm, I’d like to take look at the request traces so I click the node to open the drawer, then click View traces. I already know from the map that 5xx and 4xx status codes are being generated in the code paths selected by PUT requests coming into my application so I switch Filter type to be Status code, then select both 502 and 504 entries in the list, finally clicking Add to filter. The Traces view switches to show me the traces that resulted in those error codes, the response time distribution and a set of traces.
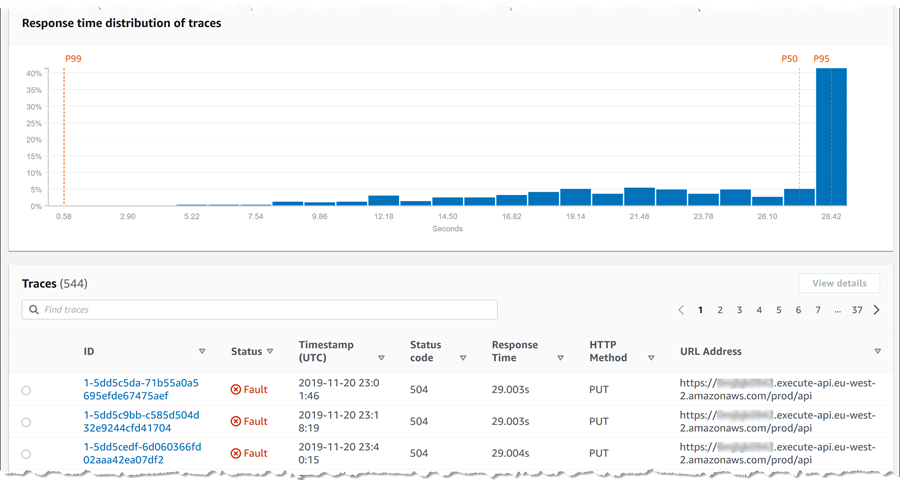
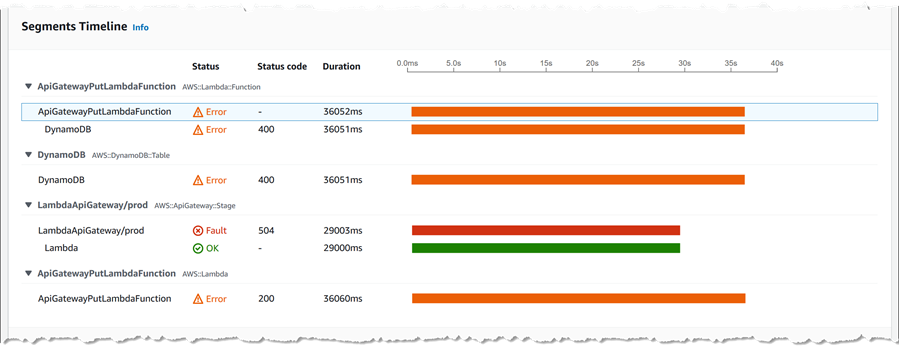
Ok, now we’re getting close! Clicking the first trace ID, I get a wealth of data including exception messages about that request – more than I can show in a single screenshot! For example, I can see the timelines of each segment that was traced as part of the request.
Scrolling down further, I can view exception details (below this I can also see log messages specific to the trace too) – and here lays my answer, confirming the throttling indicator that I saw in the original map. I can also see this exception message in the log data specific to the trace, shown at the foot of the page. Previously, I would have had to scan through logs for the entire application to hopefully spot this message, being able to drill down from the map is a significant time saver.
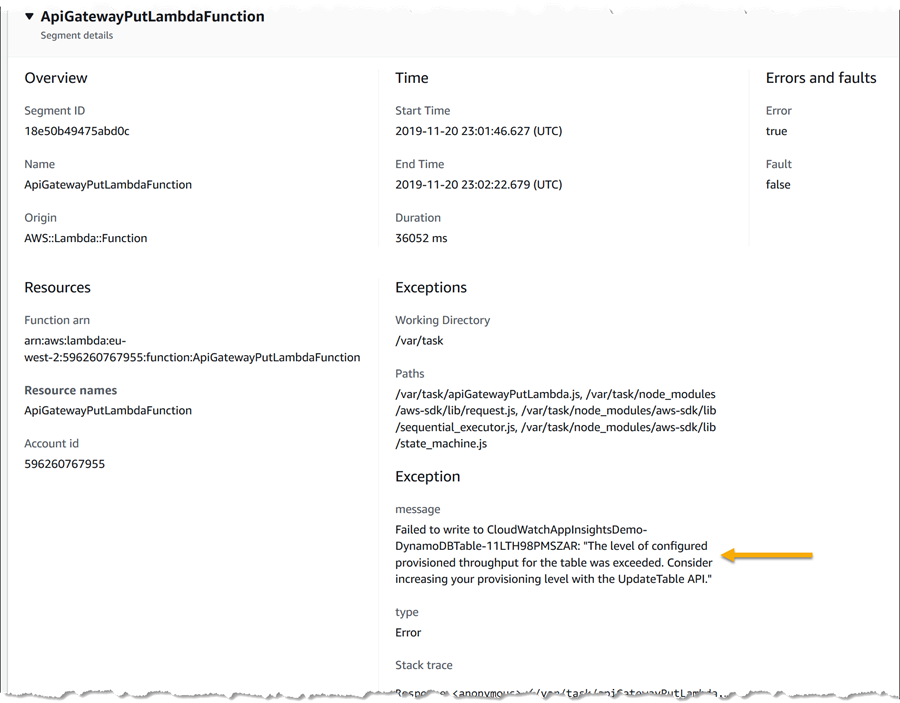

Now I know how to fix the issue and get the alarm resolved – increase the write provisioning for the table!
In conjunction with CloudWatch ServiceLens, Amazon CloudWatch has also launched a preview of CloudWatch Synthetics that helps to monitor endpoints using canaries that run 24×7, 365 days a year, so that I am quickly alerted of issues that my customers are facing. These are also visualized on the Service Map and just as I did above, I can drill down to the traces to view transactions that originated from a canary. The faster I can dive deep into a consolidated view of an operational failure or an alarm, the faster I can root cause the issue and help reduce time to resolution and mitigate the customer impact.
Amazon CloudWatch ServiceLens is available now in all commercial AWS Regions.
— Steve