What Is Kubernetes Monitoring?
What is Kubernetes monitoring?
Kubernetes monitoring is the process of analyzing container performance within Kubernetes clusters. Kubernetes is an open-source container orchestration software that uses computing nodes, called clusters, to run containerized applications. Containerization is a software deployment and runtime process that bundles an application's code with all the files and libraries it needs to run on any infrastructure. Kubernetes monitoring includes tools and methods to collect and visualize cluster performance data. It provides insights for identifying and troubleshooting performance issues to ensure applications run as expected at all times. Kubernetes monitoring is complex as it involves managing thousands of containers in multi-cloud environments.
Why is Kubernetes monitoring important?
Observing the health, performance, and other metrics of the Kubernetes cluster allows software teams to resolve issues, optimize performance, and scale workloads more effortlessly. Many underlying services and components are abstracted in a Kubernetes architecture, which reduces observability. As apps become more complex, developers face difficulties like:
-
Ensuring availability
-
Tracing faults
-
Managing resources
-
Sustaining performance
-
Optimizing application health
With Kubernetes monitoring solutions, software teams can improve resource usage, resolve misconfigurations, improve performance, and save costs. Developers can diagnose issues more confidently and preempt potential failures from impacting user experience. A robust Kubernetes monitoring tool also allows organizations to strengthen the security of clusters, nodes, pods, and services.
What Kubernetes components require monitoring?
A Kubernetes platform consists of nodes that can host multiple pods. It orchestrates containerized application deployment by dividing and delegating workloads to various components. Each component has specific functions but works interdependently to ensure the app's functionality. We describe the primary components below.
Pods
A Kubernetes pod is the most basic unit in the Kubernetes architecture. It holds one or multiple containers. Instead of running the containerized application directly, Kubernetes runs them in pods to share resources more efficiently. This also makes scaling and fault recovery easier. Kubernetes can replicate pods, along with the resources and containers, to improve service availability. If one pod fails, its duplicate can take over. Moreover, the replicas can handle additional traffic if the original pod is overwhelmed by excessive requests.
Nodes
Kubernetes nodes are physical or virtual machines that run pods and provision resources to them. A Kubernetes node streamlines resource allocation, communication, and orchestration of the pods it manages. All nodes consist of:
-
A software component called kubelet that ensures all containers are running in their pods
-
Component kube-proxy that streamlines the communication between pods and the control plane.
-
A container runtime service that provisions resources to containerized applications and manages their operation throughout the entire container lifecycle.
Cluster
A Kubernetes cluster is a group of computing services that run containerized applications at scale. When you install Kubernetes, you get a Kubernetes cluster with at least a node, one or several pods, and a control plane. To enable fault-resilient applications, you can back up an entire Kubernetes cluster, including all the nodes deployed.
Kubernetes control plane
The Kubernetes control plane manages and responds to requests from Kubernetes pods. It enforces policies, assigns resources, creates backups, and distributes workloads among the cluster nodes. For example, the control plane can assign workloads to Kubernetes nodes according to their capacities. When deploying Kubernetes on the cloud, the control plane also acts as an intermediary to ensure access to cloud resources. These are services that enable the control plane to manage cluster nodes.
-
kube-APIServer allows users to interact with Kubernetes functions through an application programming interface (API).
-
kube-controller-manager is a service that orchestrates processes for nodes, pods, and other components in the platform.
-
etcd is a backup database for Kubernetes cluster data.
-
cube-scheduler finds nodes with sufficient capacity for new pods to run.
-
cloud-controller-manager connects the Kubernetes cluster to third-party cloud services.
What are the metrics in Kubernetes monitoring?
Kubernetes operations involve multiple and overlapping interactions of various components, which are observable through metrics. Cluster operators measure the key metrics below to troubleshoot problems, scale workloads, provision resources, and more.
Kubernetes control plane metrics
Measuring the metrics for the Kubernetes control plane provides an overview of the health and performance of cluster components. Kubernetes operators perform cluster monitoring to retrieve insights such as the number of operational nodes, cluster resource utilization, and whether pods are assigned to the correct nodes.
Nodes metrics
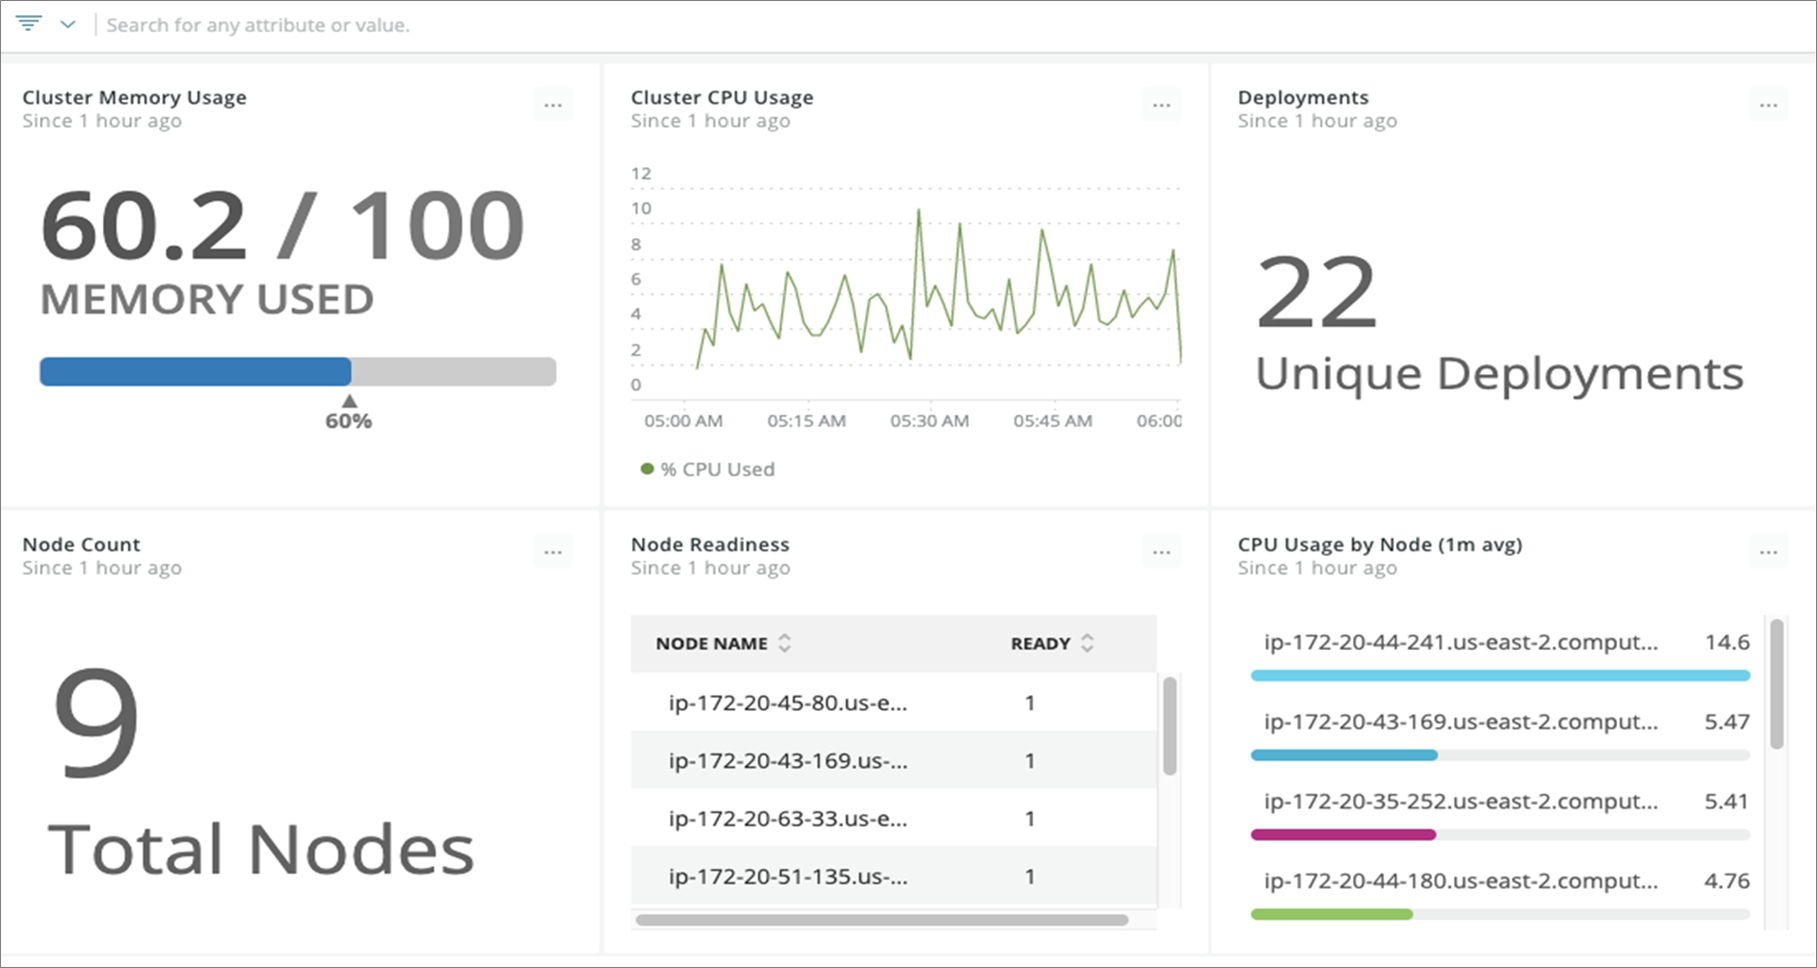
Node metrics reveal the readiness, network capacity, CPU, and memory usage of Kubernetes nodes in the cluster. Kubernetes has built-in node metrics agents to collect and send metrics back to the operator. Monitoring Kubernetes node metrics ensures there are always available nodes to handle growing service requests.
Pod metrics
Pod metrics provide insights on pod health, availability, and status. They also help Kubernetes operators understand pod and application behaviors. For example, pod misconfiguration can result in performance issues that prevent applications from running or suffer from latency.
Software teams can get more information on Kubernetes pod health by analyzing the monitoring data collected by the kubelet. The kubelet probes all containers for readiness, liveliness, and startup status.
-
Readiness indicates if all pods are ready to accept incoming requests. If any containers are not ready, the pod is removed from the service.
-
Liveliness detects containers that have become unresponsive and require a restart.
-
The startup status checks if a container was successfully launched.
Container metrics
Monitoring container metrics ensures each container operates within its allocated resource limits. For example, the metrics report each container's CPU usage, memory utilization, and network bandwidth. They allow software teams to troubleshoot resource allocation issues within pods.
Application metrics
Application metrics clarify the logical and functional part of the software running on Kubernetes environments. For example, you deploy a streaming app on the cloud with Kubernetes. With application metrics, you can learn how users interact with the app, the time they spend, and the loading speed for on-screen elements.
Resource utilization
Nodes and pods consume CPU, memory, network, storage, and other cluster resources. Measuring the resources they utilize allows software engineers to preempt bottleneck issues, accelerate service delivery, and reduce costs. For example, they can provide more computing resources for additional nodes when necessary.
How is Kubernetes monitoring done?
There are several ways to collect metrics from the Kubernetes system.
Kubernetes metrics API
Kubernetes internally collects and aggregates cluster, node, and pod metrics with a metrics server. Developers can retrieve the metrics by establishing a resource metrics or full metrics pipeline. Both approaches use the API the platform provides to retrieve data collected by the kubelet. The resource metrics pipeline provides limited types of data stored in short-term memory. Meanwhile, the full metrics pipeline allows developers to retrieve richer data to understand the cluster performance better.
DaemonSet
DaemonSet is a special type of pod that monitors the pod activities within a node. Every node created in a Kubernetes cluster consists of at least one DaemonSet pod, which remains operational as long as its host node is not destroyed. Some Kubernetes monitoring tools leverage the DaemonSet structure to deploy metrics-collecting pods to each node.
Kubernetes dashboard
The Kubernetes dashboard is a web-based user interface that lets developers deploy containerized applications, manage Kubernetes resources, observe cluster health, and resolve issues. It offers basic monitoring capabilities useful for development and testing but lacks the depth that comprehensive Kubernetes monitoring solutions offer.
Third-party monitoring solutions
Various solutions are available to retrieve, store, and visualize Kubernetes metrics. These solutions can automatically discover all Kubernetes cluster nodes and pods in a deployment. They are engineered as a normal pod that resides in the Kubernetes node. When installed, the monitoring pod collects key metrics by communicating with the kubelet or cAdvisor. cAdvisor is an open-source agent that gathers performance data from containers up to the cluster level. After collecting relevant metrics, the pod sends the data to persistent storage, which the solution transforms into tables and charts.
What are the challenges of Kubernetes monitoring?
Kubernetes allows applications to operate and scale independently of operating systems and hardware. Despite its flexibility, there are significant challenges to turning raw data collected from Kubernetes activities into actionable insights.
Architecture complexity
Monitoring the activities of Kubernetes components and the applications they host requires precise data logging, storage, and visualization. Often, Kubernetes operators might need more than one tool to enable complete oversight of the cluster health. Using the Kubernetes monitoring tool also requires expertise, training, and an understanding of the Kubernetes architecture. Organizations without such budget and technical capacities might find monitoring Kubernetes applications challenging.
Data security
Data security and privacy are other concerns that further complicate Kubernetes monitoring. Kubernetes monitoring software must retrieve and store observability data in a separate database. Since some pods might transfer or exchange sensitive data, organizations take precautionary measures to protect user privacy and prevent unauthorized access.
Scalability
As a Kubernetes cluster grows, organizations must invest in different monitoring tools or upgrade existing ones to accommodate increasing cluster activities. Without proper planning, ramping up monitoring capacity might consume all the Kubernetes resources initially budgeted for the nodes, negatively impacting application performance and availability.
What are Kubernetes monitoring best practices?
Adopting these practices helps make Kubernetes monitoring more manageable, sustainable, and cost-efficient.
Monitor cloud cost
Cost monitoring is an essential aspect of managing your Kubernetes in the cloud. By gaining visibility into your cluster costs, you can optimize resource utilization, set budgets, and make data-driven decisions about your deployments.
Label pods
Navigating and searching for specific containers or components in a complex Kubernetes environment is tedious. Applying tags and labels based on application or other parameters can reduce search time and speed up issue remediation.
Collect user experience metrics
The Kubernetes monitoring strategy primarily focuses on the performance, availability, and activity of nodes, pods, and clusters. However, assessing how customers interact with your applications is equally important. It allows you to refine on-app elements, optimize user experience, and improve business outcomes.
Set up alerts
Configure alerts to detect events that disrupt cluster operations and enable effective monitoring. For example, application issues can cause disk utilization to spike beyond the normal threshold. Receiving prompt alerts allows software teams to preempt problems or quickly resolve them.
How can AWS help?
Amazon Elastic Kubernetes Service (Amazon EKS) is a fully managed service that allows you to deploy, manage, and scale Kubernetes clusters on-premise or with AWS cloud infrastructure. With Amazon EKS, you can:
-
Run a Kubernetes control plane across three available zones to ensure high availability.
-
Unify cluster management, observation, and troubleshooting with an integrated console.
-
Deploy nodes on Amazon EC2 Spot Instances to reduce costs further.
You can monitor Kubernetes data in Amazon EKS using many available monitoring or logging tools. Your Amazon EKS log data can be streamed to AWS services or to partner tools for data analysis. Many services in the AWS Management Console provide data for troubleshooting your Amazon EKS issues.
Get started with Kubernetes monitoring on AWS by creating a free account today.
Browse all cloud computing concepts
Browse all cloud computing concepts content here:
Did you find what you were looking for today?
Let us know so we can improve the quality of the content on our pages