AWS Partner Network (APN) Blog
Data Reply Enables Autonomous Data Analysis Using a Serverless Self-Service Workflow
By Aimen Ziada, Sr. Data Consultant – Data Reply France
 |
| Reply |
 |
Data analytics and data science are constantly described as a black box that only technical people understand. To overcome this, Amazon Web Services (AWS) offers a set of services that make it easier for any user to learn firsthand from the data.
This self-service approach enables non-technical users without coding experience to be more autonomous in their analysis. It allows them to eliminate dependence from IT teams while mastering their data.
AWS applies different kinds of serverless, user-friendly, no-code services to perform data cleaning, data analysis, SQL queries, and dashboarding.
In this post, we will look into data preparation, analysis, and how AWS supports clients’ decision-making processes. We’ll illustrate how data is stored in Amazon Simple Storage Service (Amazon S3), and how with AWS Glue Studio and DataBrew users can manage their data through automatable transformation.
We’ll also discuss how to query the data with Amazon Athena employing SQL, and finally how to visualize patterns and tendencies with Amazon QuickSight to enhance any decision-making process.
Data Reply is part of Reply, an AWS Premier Tier Services Partner that specializes in the design and implementation of solutions based on new communication channels and digital media. Data Reply empowers organizations with advanced analytics to achieve outstanding outcomes through the right use of data.
Use Case Overview
The use case exemplified here refers to train cancellations in New Jersey, in March 2018, based on data provided by NJ Weather. In our example, the objective was to understand and identify the main cause(s) for train cancellations.
Comprehension and decision making needed to be fast to avoid any negative implications affecting train travelers. To achieve this, we demonstrate how to automate analysis and get business insights using Data Reply’s AWS serverless solution for self-service analysis.
The architecture below describes the end-to-end workflow followed to get value out of raw data.
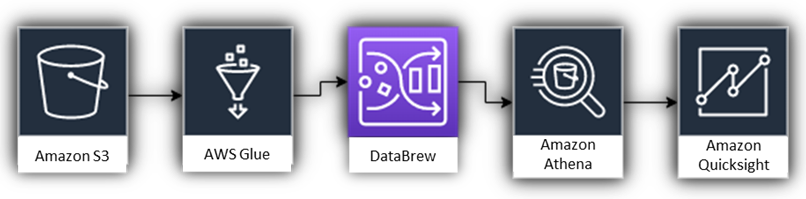
Figure 1 – AWS defined architecture.
Data Treatment and Exploration
Data was provided in CSV format, separated by commas and with no structure. It described the traffic of 28 lines from two different companies (NJ Transit and Amtrak), indicating each train stop status (departed or cancelled). The figure below displays the rail traffic of these two companies, highlighting the main lines in different colors.

Figure 2 – Map of rail traffic – New Jersey.
Traditionally, the first step would be to retrieve the appropriate schema, in Excel or Python, proceed with the data exploration and cleaning, and then run descriptive statistics analysis to understand its meaning.
With AWS, however, the first step is to upload the data in an Amazon S3 bucket, which enables cost reduction, data protection, and management.
To do so, we create a new bucket to act as a data container, which requires a unique name and to have its security policies defined, such as read-only access or data encryption. Amazon S3 offers a large set of classes to be chosen depending on the use case, ranging from simple storage with quick access to data to long-term storage with no need to instantly retrieve data.
Once the bucket is set, we can upload our data with the click of a button, inheriting all defined bucket policies.

Figure 3 – How to upload data into Amazon S3.
The next step is to define our extract, transform, load (ETL) job through a crawler that will run on our data.
Afterwards, the user can employ AWS Glue, a serverless service that makes it easy to prepare data for analytics, machine learning, or app development. AWS Glue provides all the required capabilities to schedule ETL jobs to transform and automatically retrieve any data schema.

Figure 4 – Defining a crawler (left), and automatically retrieving schema.
As illustrated above, the crawler automatically detected that our data was composed of 250,243 records and 13 columns and, based on the initially detected format, it also adjudicated a data type for each record. The date column was categorized as a string, a potential issue that was overcome thanks to AWS’s easy data manipulation services.
These tasks may be scheduled as jobs (defined here as a set of tasks) to be triggered whenever new data is uploaded to the S3 bucket.
Users can use DataBrew, a data preparation tool with a well-designed interface that allows them to clean data from over 250 pre-built transformations without having to write any new code. As before, those preparations are saved as recipes which can be scheduled and automated.
Being an AWS Glue service, DataBrew automatically gets the data in the right schema with the glue crawler, offering the following processes:
- Profiling to evaluate data quality, find patterns or detect anomalies.
- Cleaning and normalization (filtering, converting, correcting values).
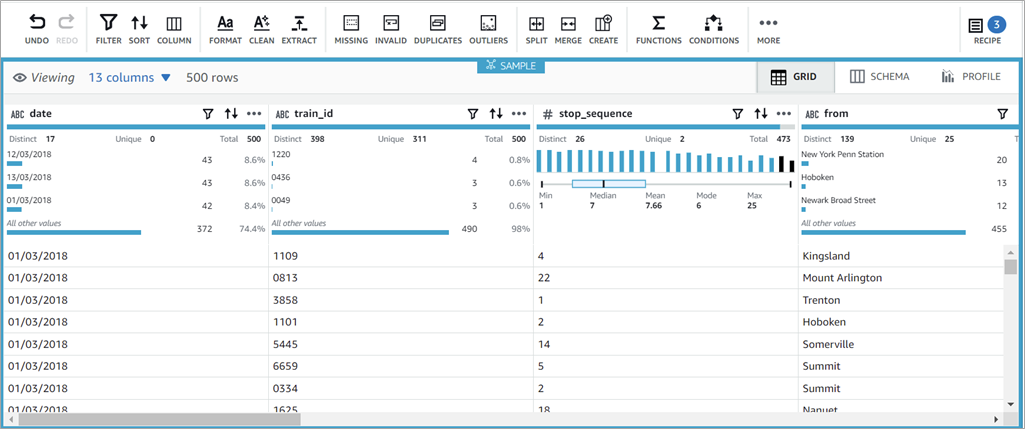
Figure 5 – DataBrew’s user-friendly interface.
As previously noted, the date format was considered a string. To transform it back to a date format in a user-friendly and flexible way, the user simply has to click on the “three dots” button over the date column and select the suitable option.
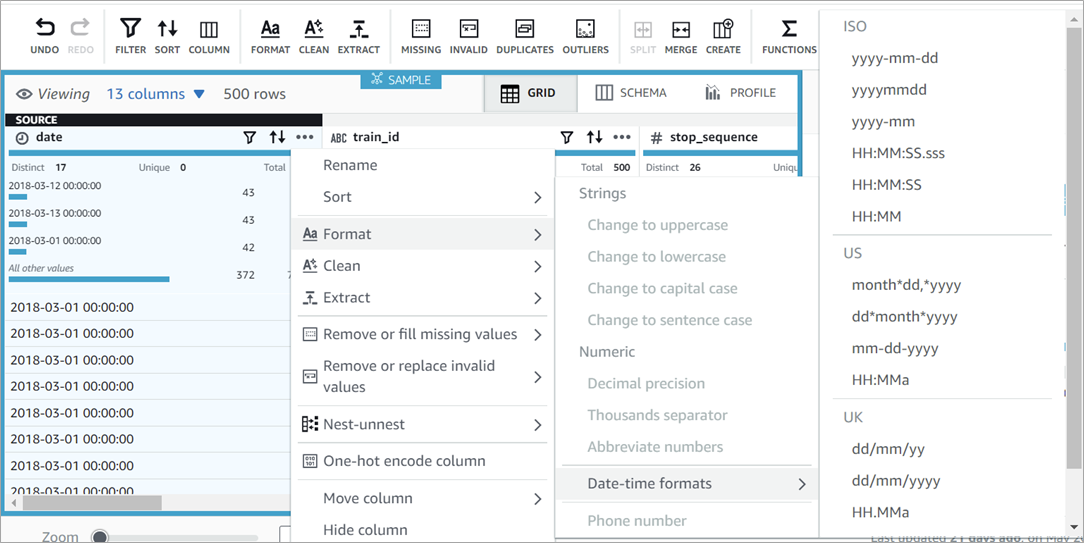
Figure 6 – How to easily apply data transformation.
The figure below illustrates the recipe for filling the missing values “delay_minutes” column with the value “0” and changing the format to decimal precision.
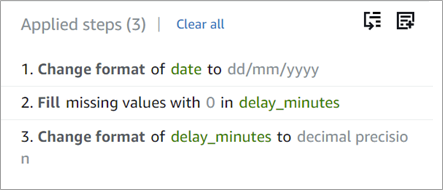
Figure 7 – Saved recipe steps.
DataBrew allows any user, with or without technical skills, to apply data transformation in a user-friendly manner and with easy-to-follow steps.
The process finalizes with the data lineage mapping, which illustrates all steps the data has gone through. The recipes can be versioned, allowing accessing previous version, building more steps or modifying existing ones.
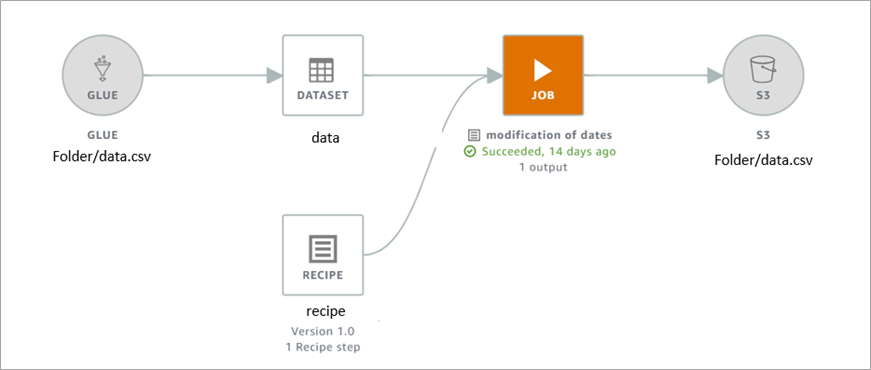
Figure 8 – Mapping data lineage.
Once the data is prepared, we use Amazon Athena, a Presto interactive service that makes it easy to run simple and standard SQL commands and export all required data. The resulting data becomes the input for Amazon QuickSight.
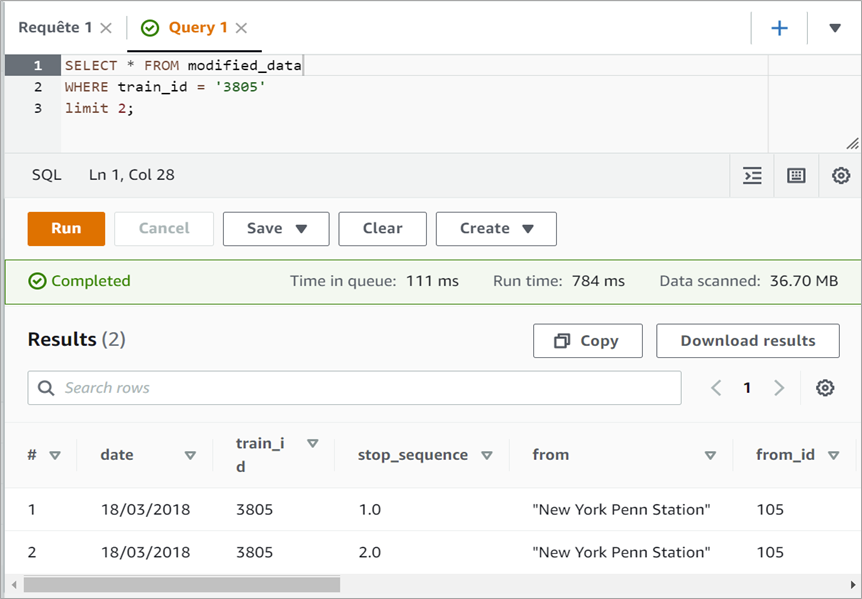
Figure 9 – Amazon Athena interface with a query example.
Amazon QuickSight can connect to all of your data in AWS, on premises, or on a third-party cloud. The data is sourced from Athena, which is a powerful tool that allows end users to ask questions in natural language, or business analysts to create serverless dashboards, without any software.
The objective of all previously listed steps in this post was preparing the data so it could become inputs for QuickSight, which in turn builds interactive dashboards, automatically looking for patterns, and does some forecasting. This way, every user can understand the data, get insights to make informed decisions.
How to build a dashboard is not illustrated in this post, but we discuss instead one already built. The figure below highlights which days of March 2018 were the ones with most cancelled trains for both companies, and which were the affected lines.
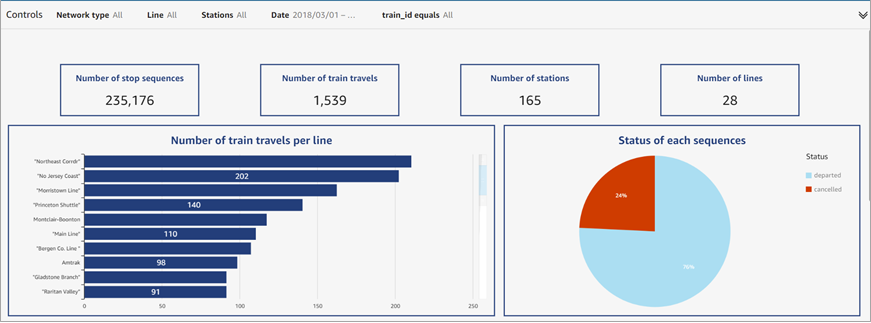
Figure 10 – QuickSight dashboard provides a global overview of the data.
This dashboard depicts 1,539 train travels (defined as a train getting from “station a” to “station b” regardless of the number of stop sequences) for 28 lines in March 2018. Those travels stopped a total of 235,176 times, in 165 different stations.
Out of the 28 different lines, “Northeast Corrdr” had the highest number of train travels per line, directly followed by “No Jersey Cost.” The pie chart shows that, although 76% of the sequences departed on time, 24% were cancelled, a considerable figure of disrupted train travels. Understanding the cause of this cancellations was key for preventing them in the future.
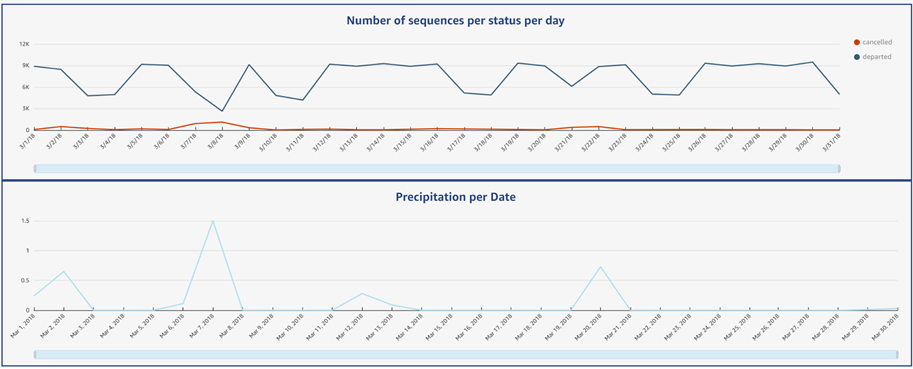
Figure 11 – QuickSight dashboard line charts.
The first line on the chart above shows the number of sequences departed on time or cancelled per day. First, we identified trends (a prevailing tendency that seems to repeat itself multiple times – 3/10/18 to 3/17/18, then 3/18/18 to 3/14/18 and finally 3/25/18 to 3/31/18). It represents the traffic from one week to another (Saturday to Saturday). On weekends, fewer departures are listed while on weekdays, traffic increases.
Two obvious anomalies were easily detected with this visualization of the data: from the 6th to 8th and the 21st of March 2018, with unusual low departures and high cancellations.
The second line chart displays the precipitation per date. We were able to identify that, on March 7th and 20th, abnormal precipitations might have caused the anomalies from the 6th to 8th and on the 21st. Here, we see how a combination of multiple source information enables users to determine the root cause.
Summary
AWS services assist with decision making by converting raw data into dashboards, which showcase relevant insights from data and prevent users from losing track of the processes applied to their data (the aforementioned black box phenomenon).
Within the same platform, Data Reply was able to perform data ingestion, cleaning, and transformation, to run SQL queries, and present information in dashboards.
Benefits for the client included:
- Step-by-step view of your data processing, where each step is detailed and versioned.
- Multiple data sourcing.
- Facilitation of the collaborative work. This platform allows for smooth communication and monitoring, as notifications can be triggered whenever a new action is performed and whenever transformations are applied to data.
Data Reply’s expertise in analytics, business intelligence, machine learning, and data engineering can help you add value to businesses and make decisions based on processed data and insights with the aid of AWS services.
For any further information, please contact Data Reply at info.data.fr@reply.com.
The content and opinions in this blog are those of the third-party author and AWS is not responsible for the content or accuracy of this post.
.

.
Reply – AWS Partner Spotlight
Data Reply is part of Reply, an AWS Premier Tier Services Partner that specializes in the design and implementation of solutions based on new communication channels and digital media. Data Reply empowers organizations with advanced analytics to achieve outstanding outcomes through the right use of data.