AWS Architecture Blog
Streaming CloudWatch metrics to VPC-based OpenTelemetry collectors using Lambda
Organizations are increasingly drawn to open-source observability frameworks like OpenTelemetry. They seek to reduce costs associated with third-party licensing and avoid vendor lock-in. Combining OpenTelemetry collectors with Amazon CloudWatch Metric Streams helps enterprises pursue their observability goals while eliminating third-party licensing fees and achieving sub-minute latency for real-time alerting. CloudWatch Metric Streams offer built-in support for publishing to OpenTelemetry endpoints, but organizations that self-host OpenTelemetry collectors within their VPC need a way to bridge the gap between metric streams and internal HTTP endpoints.
In this post, we demonstrate an approach we used to address this challenge for a customer by implementing an AWS Lambda transformation function that streams Amazon CloudWatch metrics directly to internal OpenTelemetry collectors running within a VPC.
Common observability challenges overcome with OpenTelemetry
Traditional monitoring becomes expensive and difficult to manage as cloud infrastructure grows. Many enterprises face a choice between expensive third-party observability solutions and the technical limitations of legacy metric collection methods. When organizations adopt cloud-native solutions and transition from monolithic applications to microservices, metric collection for observability becomes even more important.
Many operations and development teams face the challenge of building monitoring solutions that include tools and frameworks from different vendors and open-source projects, with different specifications and protocols, resulting in complex and fragmented landscape that’s difficult to maintain. OpenTelemetry is becoming the primary way to implement observability for many organizations. OpenTelemetry is an open-source framework for collecting traces, metrics, and logs. It works with any observability platform. Amazon CloudWatch, the AWS monitoring service, provides an open source distribution of OpenTelemetry called AWS Distro for OpenTelemetry to help you get started with OpenTelemetry. OpenTelemetry gained industry adoption primarily because of the standardization it provides enterprises through the following benefits:
- Single set of APIs and libraries to capture distributed traces and metrics that can be sent to any observability platform
- Future-proofing by avoiding vendor lock-in and enabling flexibility in choosing observability backends
- Broad vendor support because it is open sourced and natively supported by numerous vendors
Pull vs push-based monitoring architecture
In a pull model like Prometheus, the monitoring server periodically scrapes metrics from endpoints. Although this model provides more control over query frequency, it runs into challenges at scale. Our customer’s current monitoring solution with Prometheus and Amazon CloudWatch exporter using a pull-based approach resulted in higher API throttling. This caused metric loss and created gaps in observability data for business-critical systems. The frequent polling approach in this model also resulted in higher costs from API calls. This polling solution did not satisfy their requirement of sub-minute latency for real-time alerting.
To overcome these challenges, we recommend a push–based architecture. The push-based solution, using CloudWatch Metric Streams to push metrics to OpenTelemetry collector, addresses these challenges by reducing frequent polling and API calls, enabling near real-time data transmission, and potentially eliminating licensing costs from using third-party solutions. Using OpenTelemetry’s push-based model, enterprise applications can send telemetry (traces, metrics, logs) to a collector or backend that offers significant benefits for real-time observability, such as:
- Event-driven architecture: The push approach transmits data in near real-time by triggering collection based on events, not periodic polling. This is particularly valuable when using OpenTelemetry collectors that can push metrics to multiple services like Amazon Managed Prometheus (AMP), AWS X-Ray, Amazon CloudWatch, and Amazon OpenSearch.
- Cost efficiency: Push models are significantly more cost-effective than pull models. Instead of continuously scanning large datasets, systems only process and transmit data when relevant events occur, reducing both computational overhead and data transfer costs.
- Scalability: The OpenTelemetry collector serves as a central hub that can scale horizontally to handle varying traffic volumes while providing at-least-once delivery guarantees with automatic retry mechanisms.
- No licensing costs: The Apache 2.0 license is free and royalty-free, meaning you can use, modify, and distribute OpenTelemetry without any licensing fees or ongoing costs.
- No vendor lock-in: The permissive nature of Apache 2.0 means you’re not tied to any specific vendor’s implementation or support model. You can modify the code, switch between different OpenTelemetry distributions (like AWS Distro for OpenTelemetry), or even fork the project if needed.
How we built a scalable push-based observability solution
Our solution involves configuring an Amazon Data Firehose stream, that receives Amazon CloudWatch metrics and sends them to an OpenTelemetry collector within our customer’s VPC. Because of their strict data privacy requirements, our customer required the metric data and the OpenTelemetry collector to be within their VPC. A Network Load Balancer (NLB) serves as the internal endpoint to receive metric streams. Amazon Data Firehose natively supports data delivery to HTTP endpoints, but these endpoints must be public – they cannot be private endpoints inside a VPC. To overcome this limitation, we use the Amazon Data Firehose transform configuration, that invokes a Lambda function synchronously, which then securely pushes the metrics through the NLB endpoint to the collector running within the VPC. With this solution our customer could then aggregate and display all their metrics from AWS, other accounts, and on-prem systems in a single pane of glass dashboard.
The following diagram shows the architectural blocks of the solution:
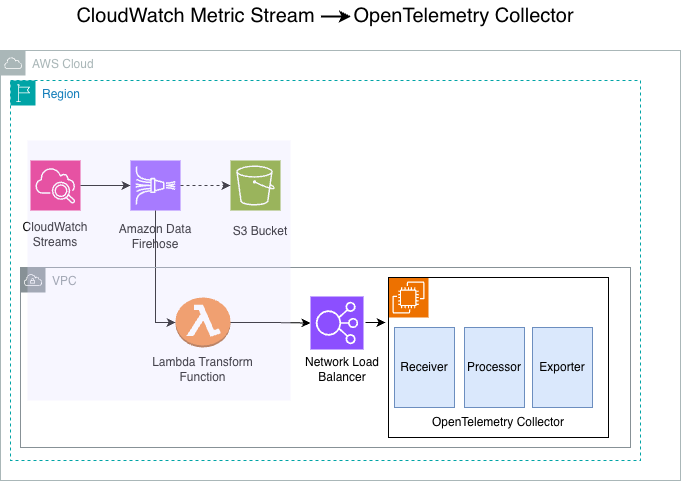
Figure 1: Reference architecture for the Amazon CloudWatch Streams to OpenTelemetry collector solution
The solution consists of 4 main components – CloudWatch Metric Streams, Amazon Data Firehose, AWS Lambda, and the OpenTelemetry collector.
- CloudWatch metric streams: CloudWatch Metric streams enables you to stream CloudWatch metrics in near real-time, with minimal setup and without writing code. In this architecture, CloudWatch streams metrics to our configured Amazon Data Firehose stream. With CloudWatch Metric Streams, you can stream metrics in OpenTelemetry 0.7, 1.0, and JSON formats. This architecture uses JSON format as the stream output.
- Amazon Data Firehose stream: A fully managed service that reliably captures, transforms, and delivers real-time streaming data to the customer’s internal endpoint.
- Lambda transform function: Amazon Data Firehose supports Lambda-based data transformation that allows you to preprocess, enrich, filter, or modify streaming data before delivery to destinations. Because Firehose cannot deliver metrics directly to private VPC endpoints, we use Firehose’s data transformation feature with Lambda to bridge this gap and deliver metrics to internal endpoints. Amazon Data Firehose buffers incoming data before synchronously invoking the Lambda function that streams the metrics to the internal HTTP endpoint.
- The OpenTelemetry collector: In this solution, the OpenTelemetry collector runs as a container in an EC2 instance. The collector is a central hub that receives, processes, and forwards telemetry data (metrics, traces, and logs) from various sources to multiple destinations in a vendor-neutral way. The OpenTelemetry collector operates through three primary components that work together in a processing flow: Receivers accept data in specified formats (like Prometheus or OpenTelemetry Protocol (OTLP)) and translate it into OpenTelemetry’s internal format; Processors manipulate and enrich the data as it flows through (filtering unnecessary data, batching for performance, transforming to mask sensitive information, or adding metadata like Kubernetes attributes); and Exporters send the processed data to destination backends such as Grafana Cloud, AWS X-Ray, Lightstep or Honeycomb.
The reference architecture also shows the following components:
- Amazon Simple Storage Service (Amazon S3) bucket: The S3 bucket is a redundant destination for the CloudWatch Streams. Because our Lambda transform function sends the data directly to OpenTelemetry endpoint, no metrics are sent to the S3 destination, and it does not incur any cost.
- Network Load Balancer: This NLB operates at the transport layer of the Open Systems Interconnection (OSI) model. In this architecture, the NLB distributes TCP traffic to the OpenTelemetry collectors running on EC2 Instances in the internal subnet within the VPC.
- Amazon Elastic Compute Cloud (Amazon EC2) instance: In this architecture, we run the OpenTelemetry collector on the EC2 instances. The instances run in the private subnet within our VPC.
The following sections detail the steps for deploying this solution in your own AWS environment. You can deploy this solution using either AWS CloudFormation or the AWS Command Line Interface (AWS CLI). Deployment time and complexity will vary based on your familiarity with these AWS services.
Implementation details
Prerequisites:
Before deploying this solution, verify that you have the following:
- An AWS account with permissions to create CloudWatch Metric Streams, Amazon Data Firehose, Lambda, and EC2 resources
- AWS CLI v2 installed and configured.
- AWS Serverless Application Model (AWS SAM) CLI installed.
- A VPC with at least two subnets configured in different Availability Zones and security groups to allow necessary inbound and outbound traffic.
We can implement this architecture in two ways: deploying with AWS CloudFormation or deploying with the AWS CLI.
Option 1: Deploying with AWS CloudFormation
This walkthrough creates a CloudFormation stack, that deploys an Amazon Data Firehose stream, Amazon CloudWatch stream, S3 bucket, Lambda function for data transformation.
Access the CloudFormation template by cloning the git repository.
Step 1 – Package the Lambda artifacts for the CloudFormation template.
This step creates the cf-packaged-file.yaml file and publishes the Lambda Layer code packaged to the specified S3 bucket cf-stage-bucket-203918862653:
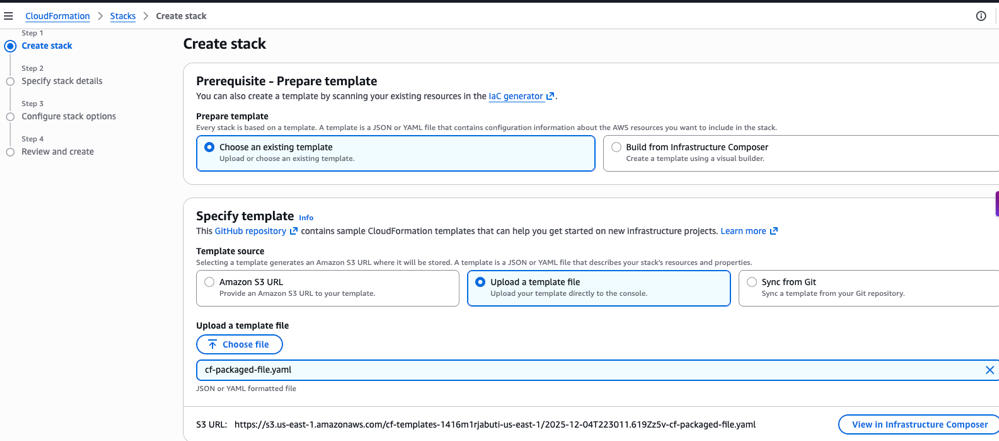
Step 2 – Create CloudFormation stack using the console.
- Sign in as an administrator to the AWS Management Console and use the navigation bar to select your preferred AWS Region for deployment.
- Navigate to the CloudFormation dashboard to create stack.
- Choose ‘Create Stack’ and choose “Choose an existing template”. Upload the template file and choose the cf-packaged-file.yaml created in the first step.
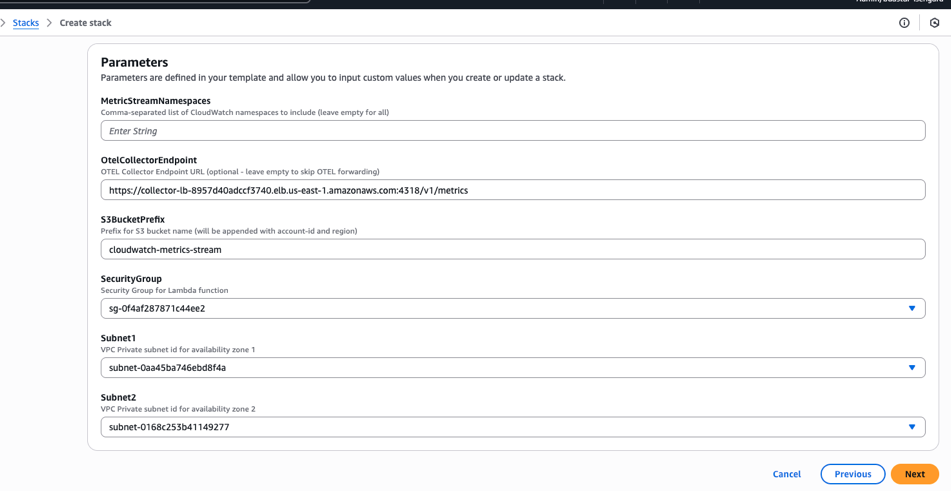
- Configure the key parameters.
- Acknowledge the Capabilities to allow CloudFormation to create the necessary LambdaExecutionRole IAM role with the required permissions.
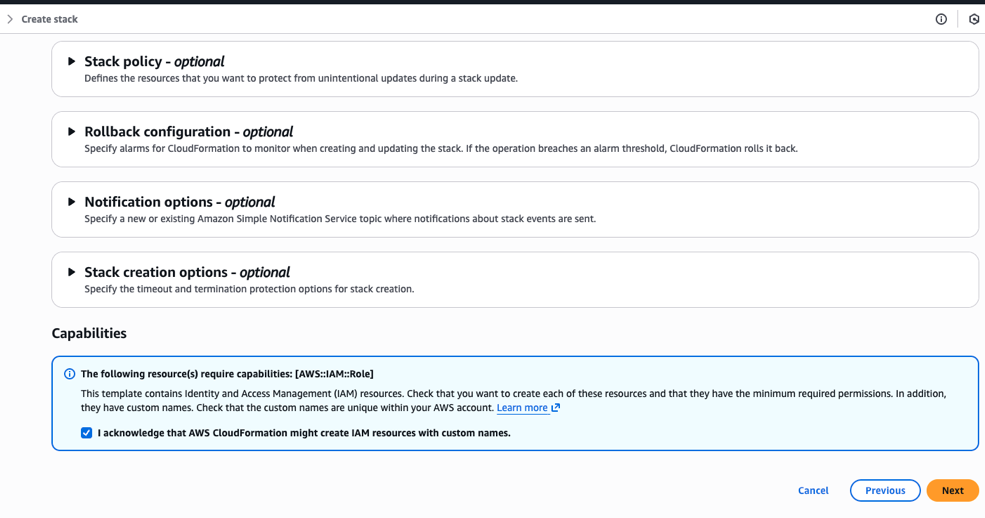
- Finally, review and choose ‘Next’ to create the CloudFormation stack.
Option 2: Deploying with AWS Command Line Interface
Alternatively, you can run the following steps from a terminal using the AWS CLI to package and create your CloudFormation stack.
Access the CloudFormation template by cloning the git repository.
Step 1 – Package the Lambda artifacts for the CloudFormation template.
This step creates the cf-packaged-file.yaml file and publishes the Lambda Layer code packaged to the specified S3 bucket cf-stage-bucket-203918862653.
Step 2 – Create stack using AWS Command Line Interface.
Create a parameters.json file as follows:
Run the CloudFormation create-stack CLI as follows:
After you deploy the infrastructure stack, CloudWatch Metric Streams initiates the flow by streaming near real-time metrics from customer applications. Amazon Data Firehose asynchronously invokes the Lambda transform function that sends metrics directly to the OpenTelemetry collector endpoint. You must then configure these collectors to apply additional processing, such as filtering, batching, and enrichment. The collectors forward metrics to one or more observability backends, such as Honeycomb, Jaeger, Grafana Cloud, or other dashboards.
Clean up
To avoid incurring unnecessary charges after testing the proof of concept (POC), clean up the resources. You can do so by deleting the CloudFormation stack to remove all deployed resources.
Option 1: Using the console:
- Sign in as an administrator to the AWS Management Console and use the navigation bar to select your preferred AWS Region for deployment.
- Navigate to the CloudFormation dashboard to create stack.
- Select the ‘cw-metrics-demo’ stack and choose “Delete”.
Option 2: Using AWS CLI:
Conclusion
In this post, we showed how moving from third-party observability tools to CloudWatch Metric Streams with OpenTelemetry can reduce costs and improve performance. The solution we implemented combines AWS streaming with the OpenTelemetry standard to create a flexible and scalable monitoring solution that can adapt to changing requirements while maintaining operational excellence. If you face similar challenges with your observability solution, this approach offers a proven path to reduce costs, improve performance, and maintain control over your monitoring data.