AWS News Blog
Access Logs for Elastic Load Balancers
Update (July 20, 2017) – Fixed the Hive commands and removed a reference to a tutorial that no longer exists.
AWS Elastic Load Balancing helps you to build systems that are highly scalable and highly reliable. You can automatically distribute traffic across a dynamically-sized collection of Amazon EC2 instances, and you have the ability to use health checks to keep traffic away from any unhealthy instances.
Access Logs
 Today we are giving you additional insight into the operation of your Elastic Load Balancers with the addition of an access log feature. After you enable and configure this feature for an Elastic Load Balancer, log files will be delivered to the Amazon S3 bucket of your choice. The log files contain information about each HTTP and TCP request processed by the load balancer.
You can analyze the log files to learn more about the requests and how they were processed. Here are some suggestions to get you started:
Statistical Analysis – The information in the log files is aggregated across all of the Availability Zones served by the load balancer. You can analyze source IP addresses, server responses, and traffic to the back-end EC2 instances and use the results to understand and optimize your AWS architecture.
Diagnostics – You can use the log files to identify and troubleshoot issues that might be affecting your end users. For example, you can locate back-end EC2 instances that are responding slowly or incorrectly.
Data Retention – Your organization might have a regulatory or legal need to retain logging data for an extended period of time to support audits and other forms of compliance checks. You can easily retain the log files for an extended period of time.
Full Control
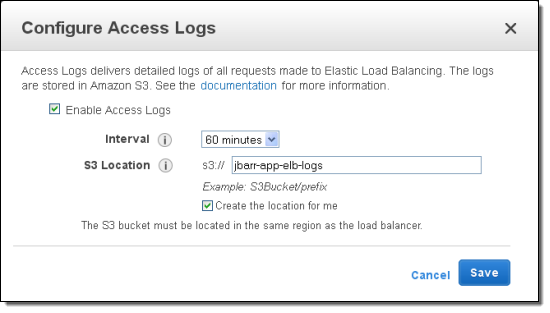
Access Logs are disabled by default for existing and newly created load balancers. You can enable it from the AWS Management Console, the AWS Command Line Interface (CLI), or through the Elastic Load Balancing API. You will need to supply an Amazon S3 bucket name, a prefix that will be used to generate the log files, and a time interval (5 minutes or 60 minutes).
This new feature can be enabled from the new version of the EC2 console. To enable this version, click on Load Balancers and then look for the “cartoon bubble” in the top right corner:
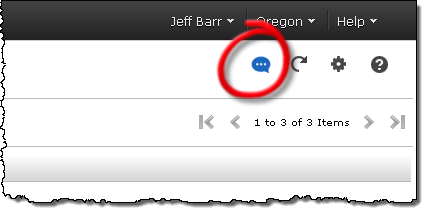
Click on the bubble to enable the new version of the console:

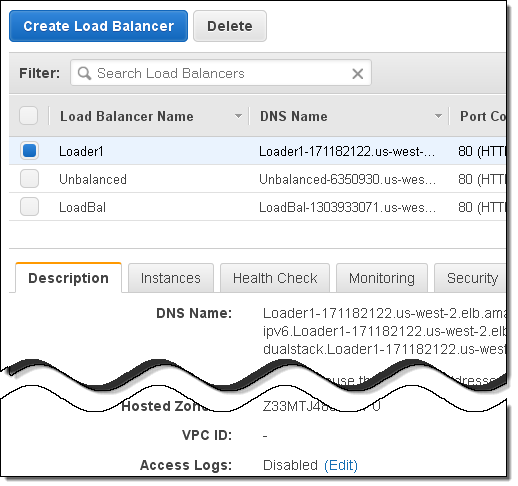
To enable Access Logs for an existing Elastic Load Balancer, simply select it, scroll to the bottom of the Description tab, and click on Edit:
Select the desired configuration and click Save:
You will also have to make sure that the load balancer has permission to write to the bucket (the policy will be created and applied automatically if you checked Create the location for me when you enabled access logs.
Log files will be collected and then sent to the designated bucket at the specified time interval or when they grow too large, whichever comes first. On high traffic sites, you may receive multiple log files for the same period.
You should plan to spend some time thinking about your log retention timeframes and policies. You could, for example, use S3’s lifecycle rules to migrate older logs to Amazon Glacier.
You can disable access logs at any time, should your requirements change.
Plenty of Detail
In addition to the bucket name and the prefix that you specified when you configured and enabled access logs, the log file name will also include the IP address of the load balancer, your AWS account number, the load balancer’s name and region, the date (year, month, and day), the timestamp of the end of the logging interval, and a random number (to handle multiple log files for the same time interval).
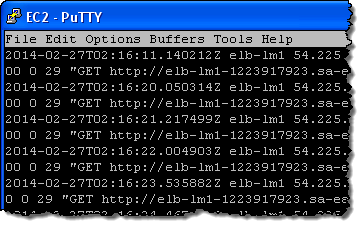
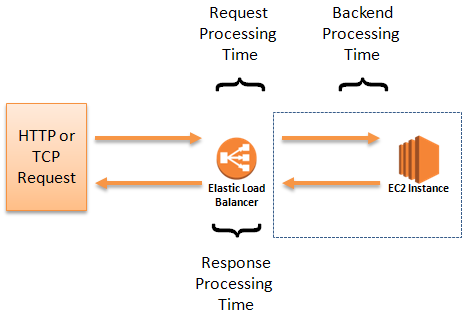
Log files are generated in a plain-text format, one line per request. Each line contains a total of twelve fields (see the Access Logs documentation for a complete list). You can use the Request Processing Time, Backend Processing Time, and Response Processing Time fields to understand where the time is going:
Log Processing With Elastic MapReduce and Hive
A busy web site can easily generate tens or even hundreds of gigabytes of log files each and every day. At this scale, traditional line-at-a- time processing is simply infeasible. Instead, an approach based on large-scale parallel processing is necessary.
Amazon Elastic MapReduce makes it easy to quickly and cost-effectively process vast amounts of data. It uses Hadoop to distribute your data and processing across a resizable cluster of EC2 instances. Hive, an open source data warehouse and analytics package that runs on Hadoop, can be used to pull your logs from S3 and analyze them.
Suppose you want to use your ELB logs to verify that each of the EC2 instances is handling requests properly. You can use EMR and Hive to count and summarize the number of times that each instance returns an HTTP status code other than 200 (OK).
If you don’t already have a load balancer and logs, see Create a Classic Load Balancer and Enable Access Logs. Keep in mind that you also need appropriate IAM permissions to access the S3 location where the logs are stored.
You also need an EMR cluster with Hive and Hue installed if you don’t already have one. You can follow the basic steps to quick create a cluster with defaults, which has these applications installed by default. Make sure you have SSH access to the master node on the EMR cluster. To enable SSH access, see Connect to the Master Node Using SSH. Keep the DNS name handy, and then use it when you Launch the Hue Web Interface.
In the Hue web interface, execute the following Hive query to create a Hive table. The query creates a Hive table, elb_raw_access_logs, from the S3 data. Replace s3://mybucket/path with the location of your ELB access log files in S3.
Now you can query the table. To select all records, run the following query:
If your log file has records, you can use the following query to list the non-200 responses grouped by backend, URL, and response code:
You could go even further, writing a script to perform multiple Hive queries or using the AWS Data Pipeline to process log files at hourly or daily intervals.
Partner Products
AWS partners Splunk and Sumo Logic have been working to support this new feature in their tools.
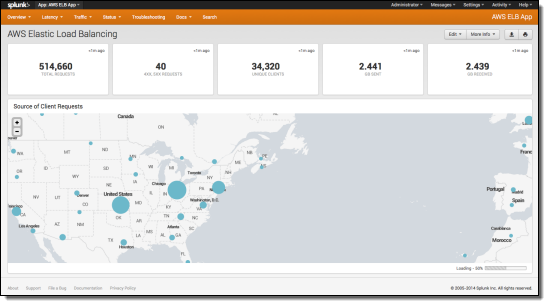
Splunk’s Hunk app can map requests to geographic locations and plot the source of client requests:
Splunk can also measure and display latency over time:
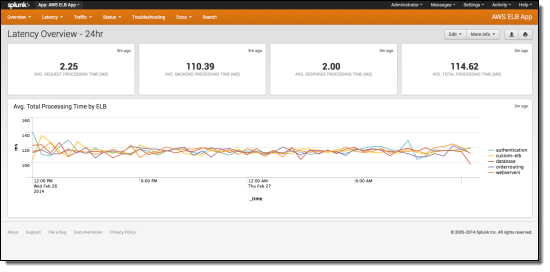
Read the Splunk blog post to learn more about this new feature.
The Sumo Logic Application for Elastic Load Balancing displays key metrics and geographic locations on one page:
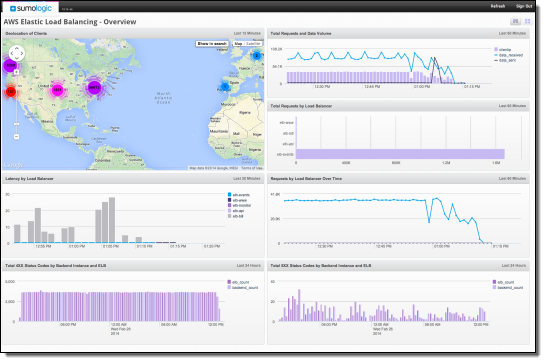
The product can also measure and analyze latency:
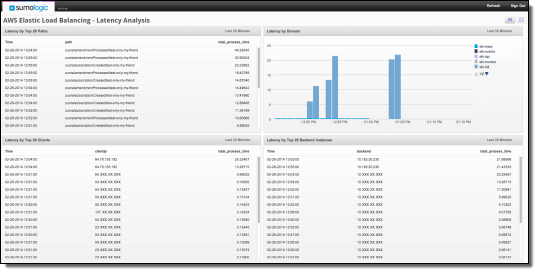
You can read their blog post to learn more about this new feature.
Start Logging Now
This feature is available now and you can start using it today!
— Jeff;