AWS News Blog
New – Amazon QuickSight Q Answers Natural-Language Questions About Business Data

|
We launched Amazon QuickSight as the first Business Intelligence (BI) service with Pay-per-Session pricing. Today, we are happy to announce the preview of Amazon QuickSight Q, a Natural Language Query (NLQ) feature powered by machine learning (ML). With Q, business users can now use QuickSight to ask questions about their data using everyday language and receive accurate answers in seconds.
For example, in response to questions such as, “What is my year-to-date year-over-year sales growth?” or “Which products grew the most year-over-year?” Q automatically parses the questions to understand the intent, retrieves the corresponding data and returns the answer in the form of a number, chart, or table in QuickSight. Q uses state-of-the art ML algorithms to understand the relationships across your data and build indexes to provide accurate answers. Also, since Q does not require BI teams to pre-build data models on specific datasets, you can ask questions across all your data.
The Need for Q
Traditionally, BI engineers and analysts create dashboards to make it easier for business users to view and monitor key metrics. When a new business question arises and no answers are found in the data displayed on an existing dashboard, the business user must submit a data request to the BI Team, which is often thinly staffed, and wait several weeks for the question to be answered and added to the dashboard.
A sales manager looking at a dashboard that outlines daily sales trends may want to know what their overall sales were for last week, in comparison to last month, the previous quarter, or the same time last year. They may want to understand how absolute sales compare to growth rates, or how growth rates are broken down by different geographies, product lines, or customer segments to identify new opportunities for growth. This may require a BI team to reconstruct the data, create new data models, and answer additional questions. This process can take from a few days to a few weeks. Such specific data requests increase the workload for BI teams that may be understaffed, increases the time spent waiting for answers, and frustrates business users and executives who need the data to make timely decisions.
How Q Works
To ask a question, you simply type your question into the QuickSight Q search bar. Once you start typing in your question, Q provides autocomplete suggestions with key phrases and business terms to speed up the process. It also automatically performs spell check, and acronym and synonym matching, so you don’t have to worry about typos or remember the exact business terms in the data. Q uses natural language understanding techniques to extract business terms (e.g., revenue, growth, allocation, etc.) and intent from your questions, retrieves the corresponding data from the source, and returns the answers in the form of numbers and graphs.
Q further learns from user interactions from within the organization to continually improve accuracy. For example, if Q doesn’t understand a phrase in a question, such as what “my product” refers to, Q prompts the user to choose from a drop-down menu of suggested options in the search bar. Q then remembers the phrase for next time, thus improving accuracy with use. If you ask a question about all your data, Q provides an answer using that data. Users are not limited to asking questions that are confined to a pre-defined dashboard and can ask any questions relevant to your business.
Let’s see a demo. We assume that there is a dashboard of sales for a company.
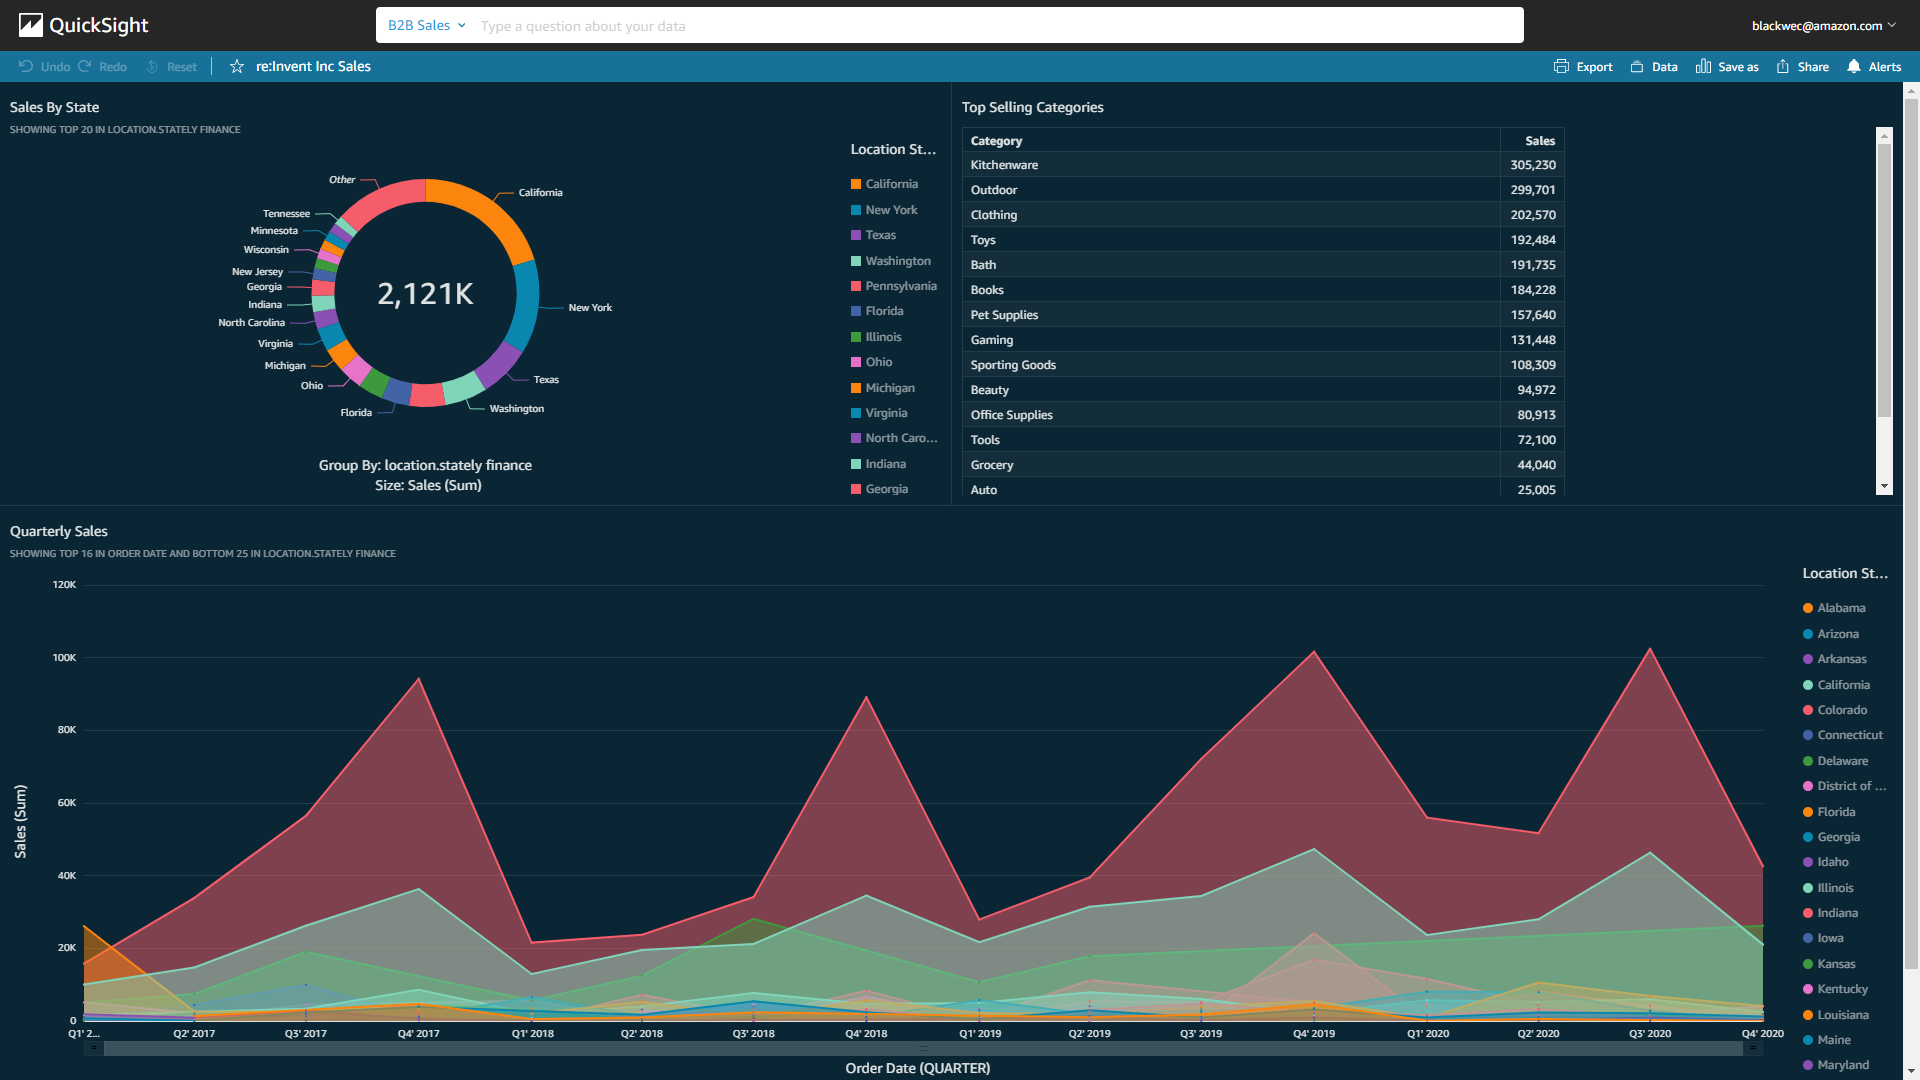
The business users of the dashboard can drill down and slice and dice the data simply by typing their questions on the Q search bar above.
![]()
Let’s use the Q search bar to ask a question, “Show me last year’s weekly sales in California.” Q generates numbers and a graph within seconds.
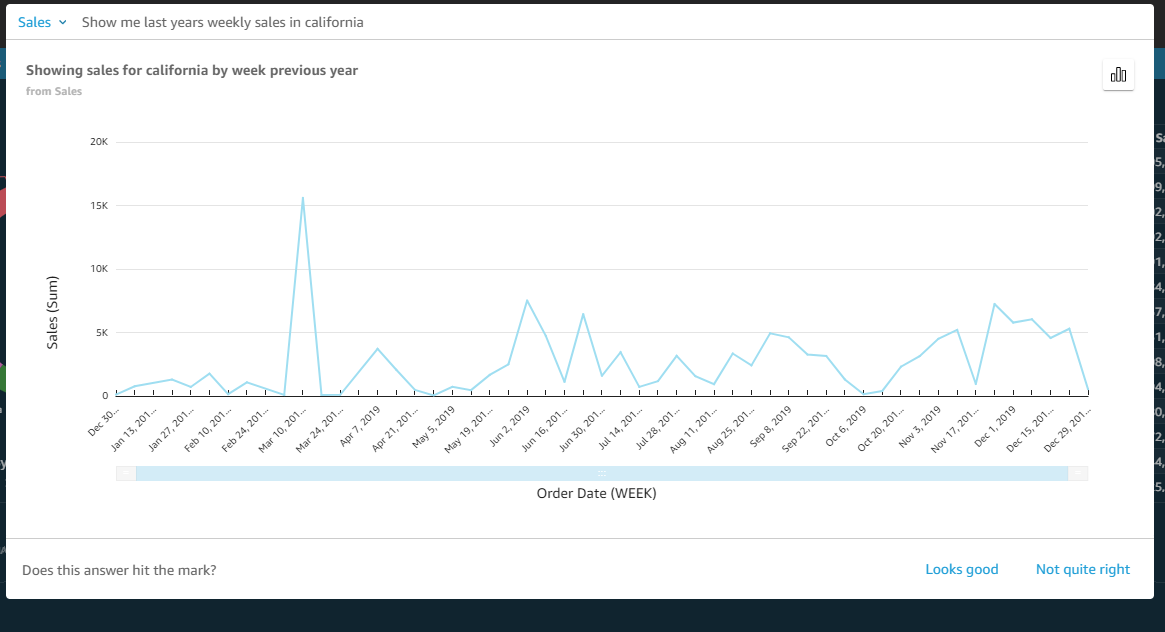
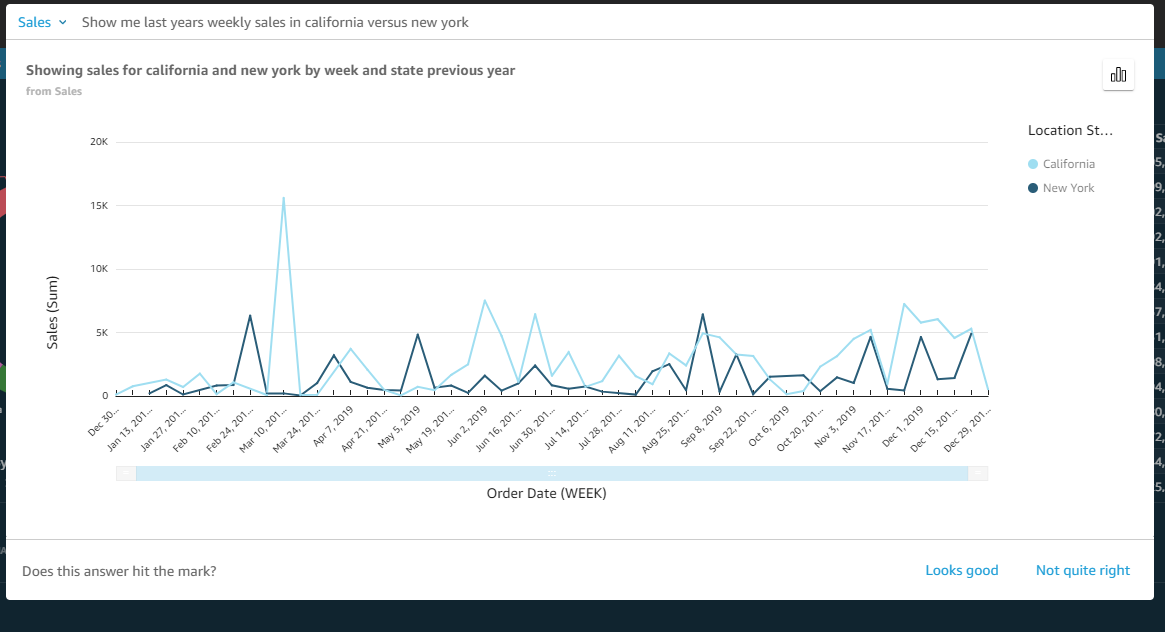
You can click “Looks good” or “Not quite right” on the answer. When clicking “Not quite right,” you can submit your feedback to your BI team to help improve Q. You can also investigate the answer further. Let’s add “versus New York” to the end of the question and hit enter. A new answer will pop up.
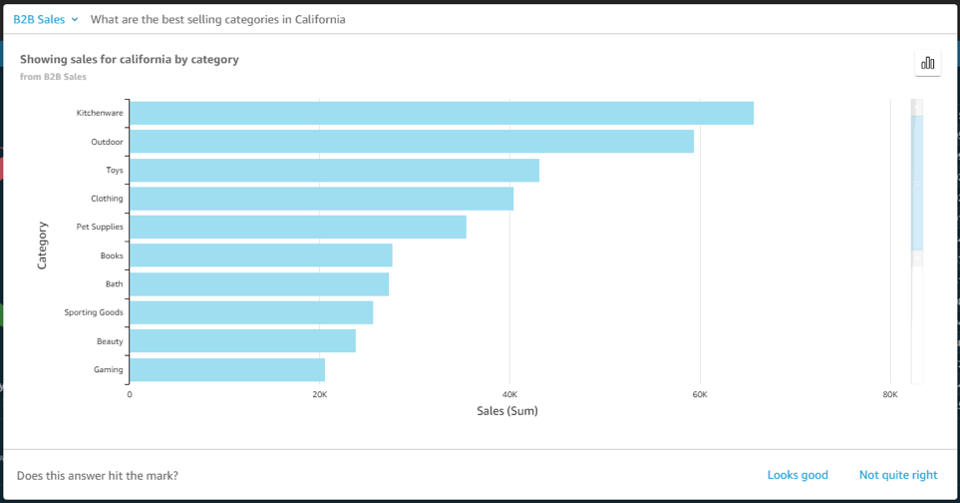
Next, let’s investigate further in California. Type in “What are the best selling categories in California.”

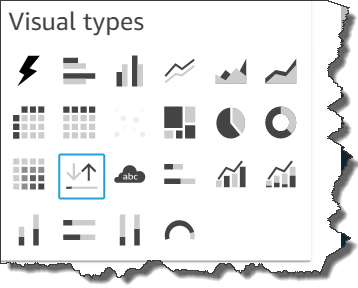
With Q, you can easily change the presentation. Let’s see another diagram for the same question.
Next, let’s take a look at the biggest industry, “Finance.” Type in “Show me the sales growth % week over week in the Finance sector” to Q, and specify “Line chart” to check weekly sales revenue growth.

The sales revenue shows growth, but it has peak and off-peak spikes. With these insights, you might now consider how to stabilize for a better profit structure.
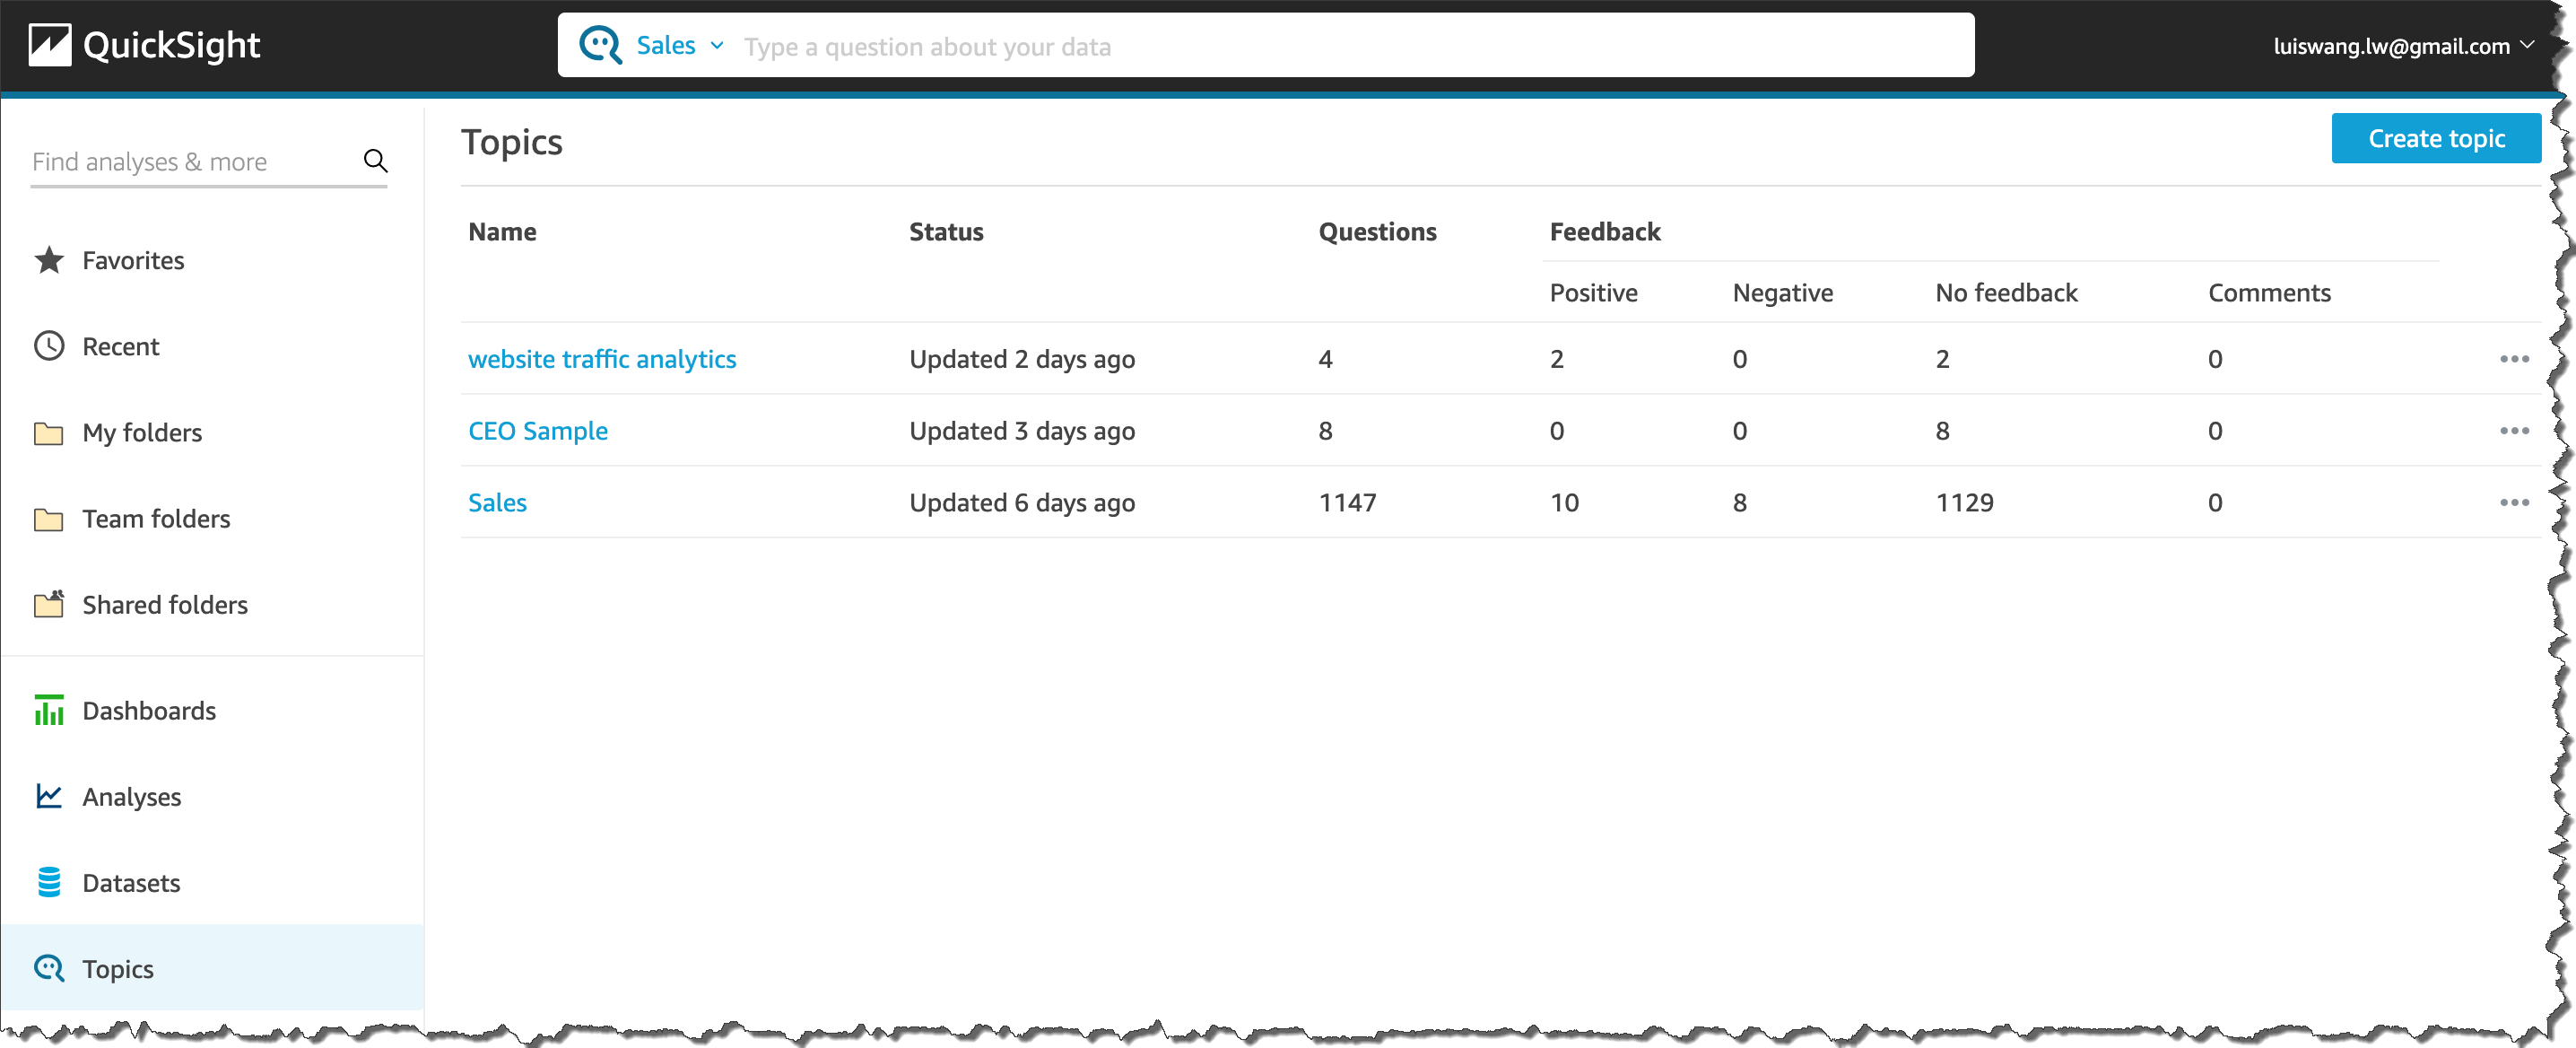
Getting Started with Amazon QuickSight Q
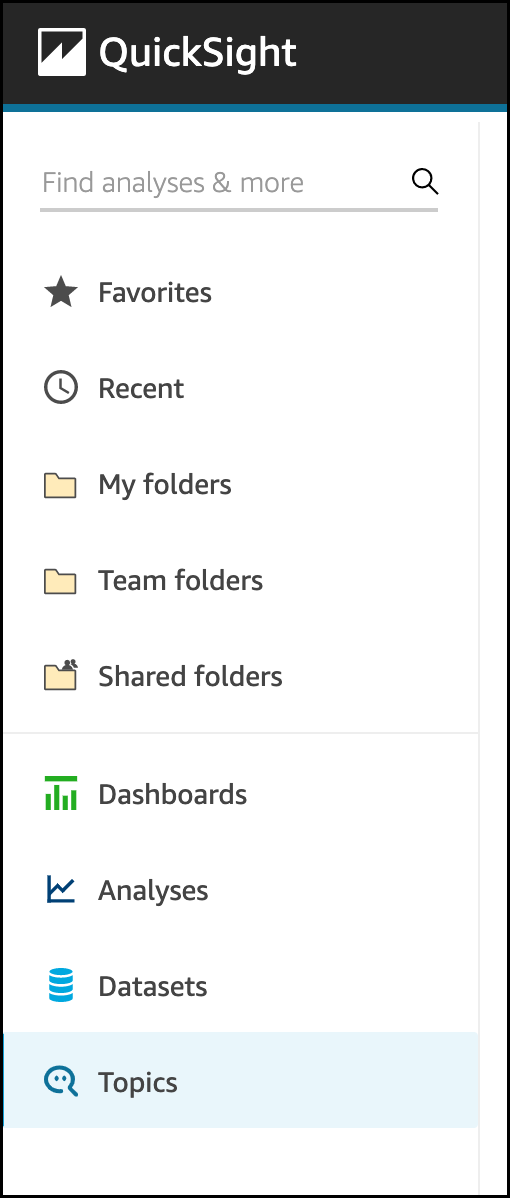
A new “Q Topics” link will appear on the left navigation bar. Topics are a collection of one or more datasets and are meant to represent a subject area that users can ask questions about. For example, a marketing team may have Q Topics for “Ad Spending,” “Email Campaign,” “Website Analytics,” and others. Additionally, as an author, you can:
- Add friendly names, synonyms, and descriptions to datasets and columns to improve Q’s answers.
- Share the Topic to your users so they can ask questions about the Topic.
- See questions your users are asking, how Q answered these questions, and improve upon the answer.
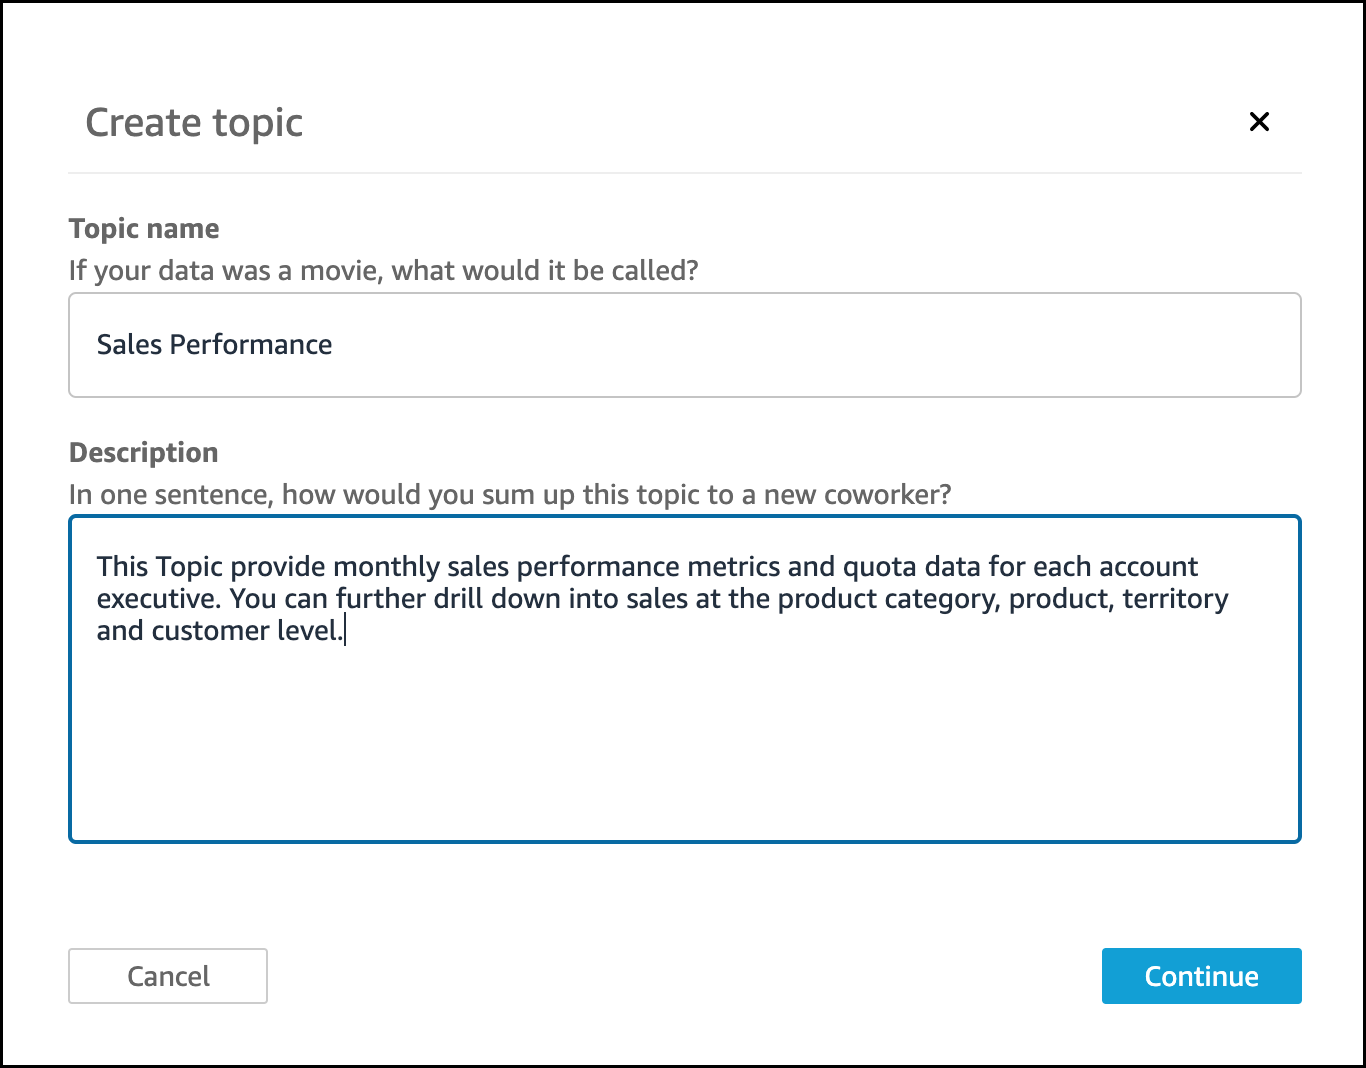
 Select Topics, and set Topic name and its Description.
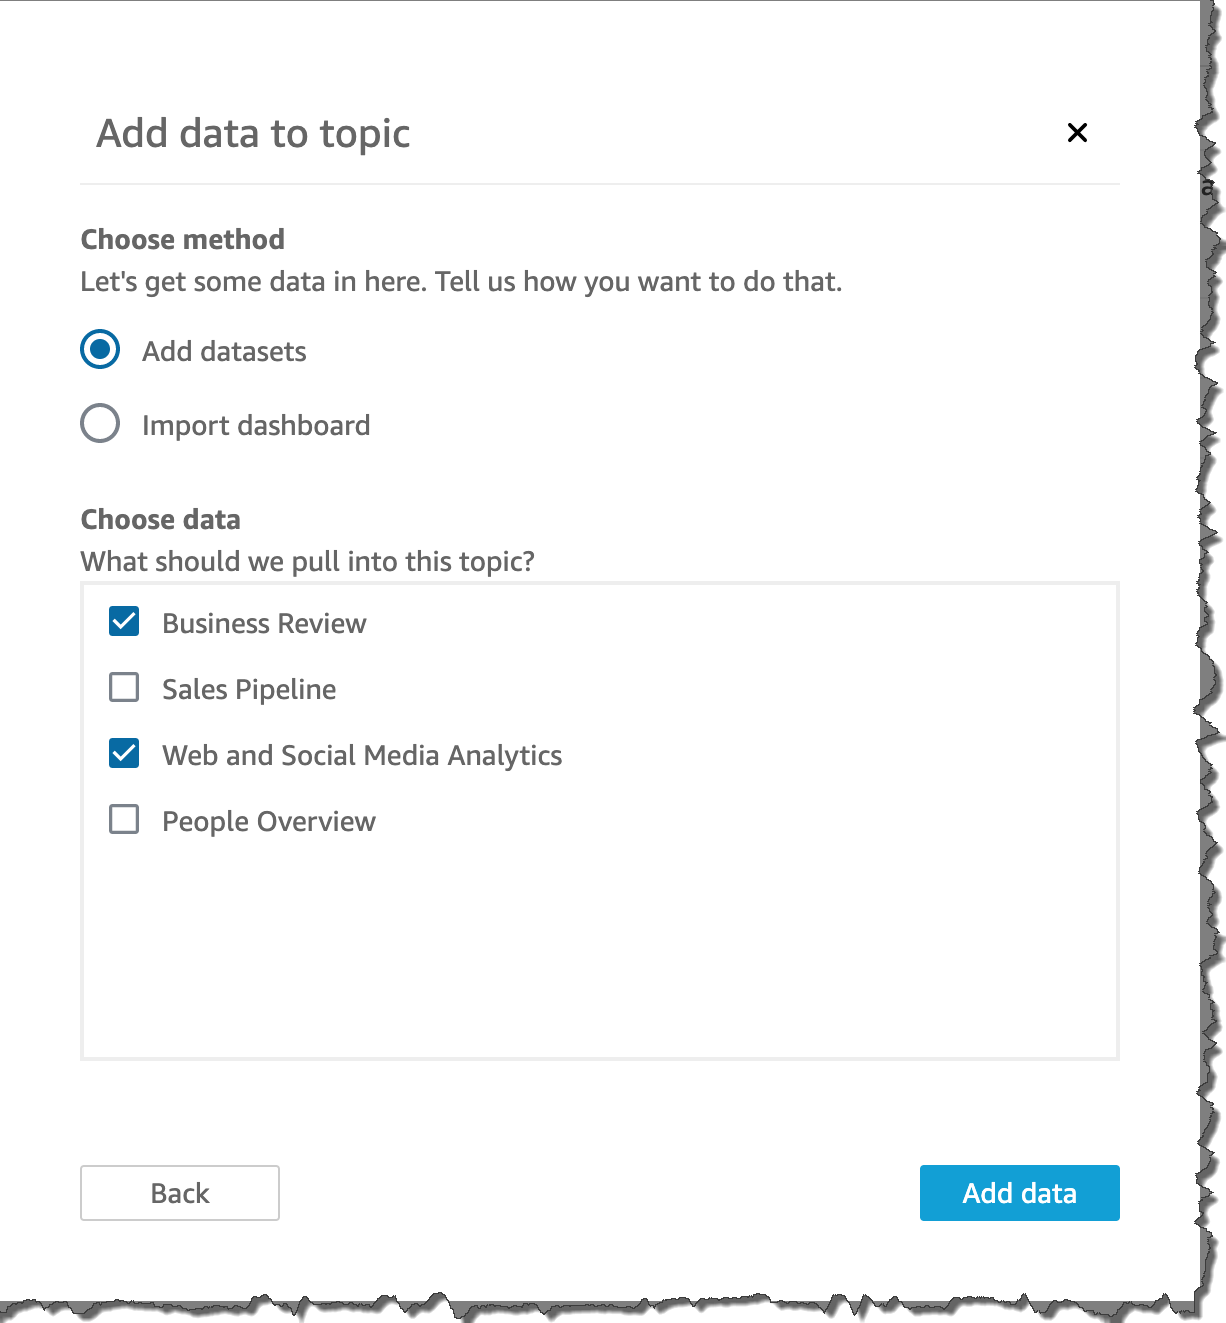
After clicking the Continue button, you can add datasets to a topic in two ways: You can add one or more datasets directly to your topic by selecting Add datasets, or you can import all the datasets in an existing dashboard into your topic by selecting Import dashboard.
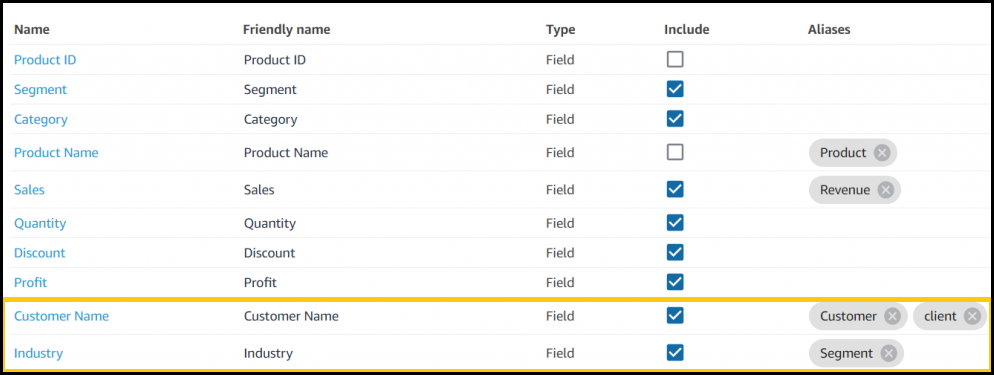
The next step is to make your datasets natural-language friendly. Generally, names of datasets and columns are based on technical naming conventions and do not reflect how they are referred to by end users. Q relies heavily on names to match the right dataset and column with the terms used in questions. Therefore, such technical names must be converted to user-friendly names to ensure that they can be mapped correctly. Below are examples:
- Dataset Name – D_CUST_DLY_ORD_DTL → Friendly Name: Customer Daily Order Details.
- Column Name: pdt_cd Column → Friendly name: Product Code
Also, you can set up synonyms for each column so users can use the terms they are most comfortable with. For example, some users might input the term “client” or “segment” instead of “industry.” Q provides a feature to correct to the right name when typing the query, but BI operators can also set up synonyms for frequently used words. Click “Topics” in the left pane and choose the dashboard where you want to set synonyms.
Then, choose “datasets.”

Now, we can set a Friendly Name or synonyms as Aliases, such as “client” for “Customer,” or “Segment” for “Industry.”
After adding synonyms, a user can save the changes and start asking questions in the Q search bar.
Amazon QuickSight Q Preview Available Today
Q is available in preview for US East (N. Virginia), US West (Oregon), US East (Ohio) and Europe (Ireland). Getting started with Q is just a few clicks away from QuickSight. You can use Q with AWS data sources such as Amazon Redshift, Amazon RDS, Amazon Aurora, Amazon Athena, and Amazon S3, or third-party commercial sources such as SQL Server, Teradata, and Snowflake. Salesforce, ServiceNow, and Adobe automatically integrate with all data sources supported by QuickSight, including business applications such as Analytics or Excel.
Learn more about Q and get started with the preview today.
– Kame