AWS News Blog
AWS DevOps Agent helps you accelerate incident response and improve system reliability (preview)

|
Updated on March 31, 2026 – AWS DevOps Agent is now generally available. New customers can explore AWS DevOps Agent with a 2-month free trial.
—
Today, we’re announcing the public preview of AWS DevOps Agent, a frontier agent that helps you respond to incidents, identify root causes, and prevent future issues through systematic analysis of past incidents and operational patterns.
Frontier agents represent a new class of AI agents that are autonomous, massively scalable, and work for hours or days without constant intervention.
When production incidents occur, on-call engineers face significant pressure to quickly identify root causes while managing stakeholder communications. They must analyze data across multiple monitoring tools, review recent deployments, and coordinate response teams. After service restoration, teams often lack bandwidth to transform incident learnings into systematic improvements.
AWS DevOps Agent is your always-on, autonomous on-call engineer. When issues arise, it automatically correlates data across your operational toolchain, from metrics and logs to recent code deployments in GitHub or GitLab. It identifies probable root causes and recommends targeted mitigations, helping reduce mean time to resolution. The agent also manages incident coordination, using Slack channels for stakeholder updates and maintaining detailed investigation timelines.
To get started, you connect AWS DevOps Agent to your existing tools through the AWS Management Console. The agent works with popular services such as Amazon CloudWatch, Datadog, Dynatrace, New Relic, and Splunk for observability data, while integrating with GitHub Actions and GitLab CI/CD to track deployments and their impact on your cloud resources. Through the bring your own (BYO) Model Context Protocol (MCP) server capability, you can also integrate additional tools such as your organization’s custom tools, specialized platforms or open source observability solutions, such as Grafana and Prometheus into your investigations.
The agent acts as a virtual team member and can be configured to automatically respond to incidents from your ticketing systems. It includes built-in support for ServiceNow, and through configurable webhooks, can respond to events from other incident management tools like PagerDuty. As investigations progress, the agent updates tickets and relevant Slack channels with its findings. All of this is powered by an intelligent application topology the agent builds—a comprehensive map of your system components and their interactions, including deployment history that helps identify potential deployment-related causes during investigations.
Let me show you how it works
To show you how it works, I deployed a straigthforward AWS Lambda function that intentionally generates errors when invoked. I deployed it in an AWS CloudFormation stack.
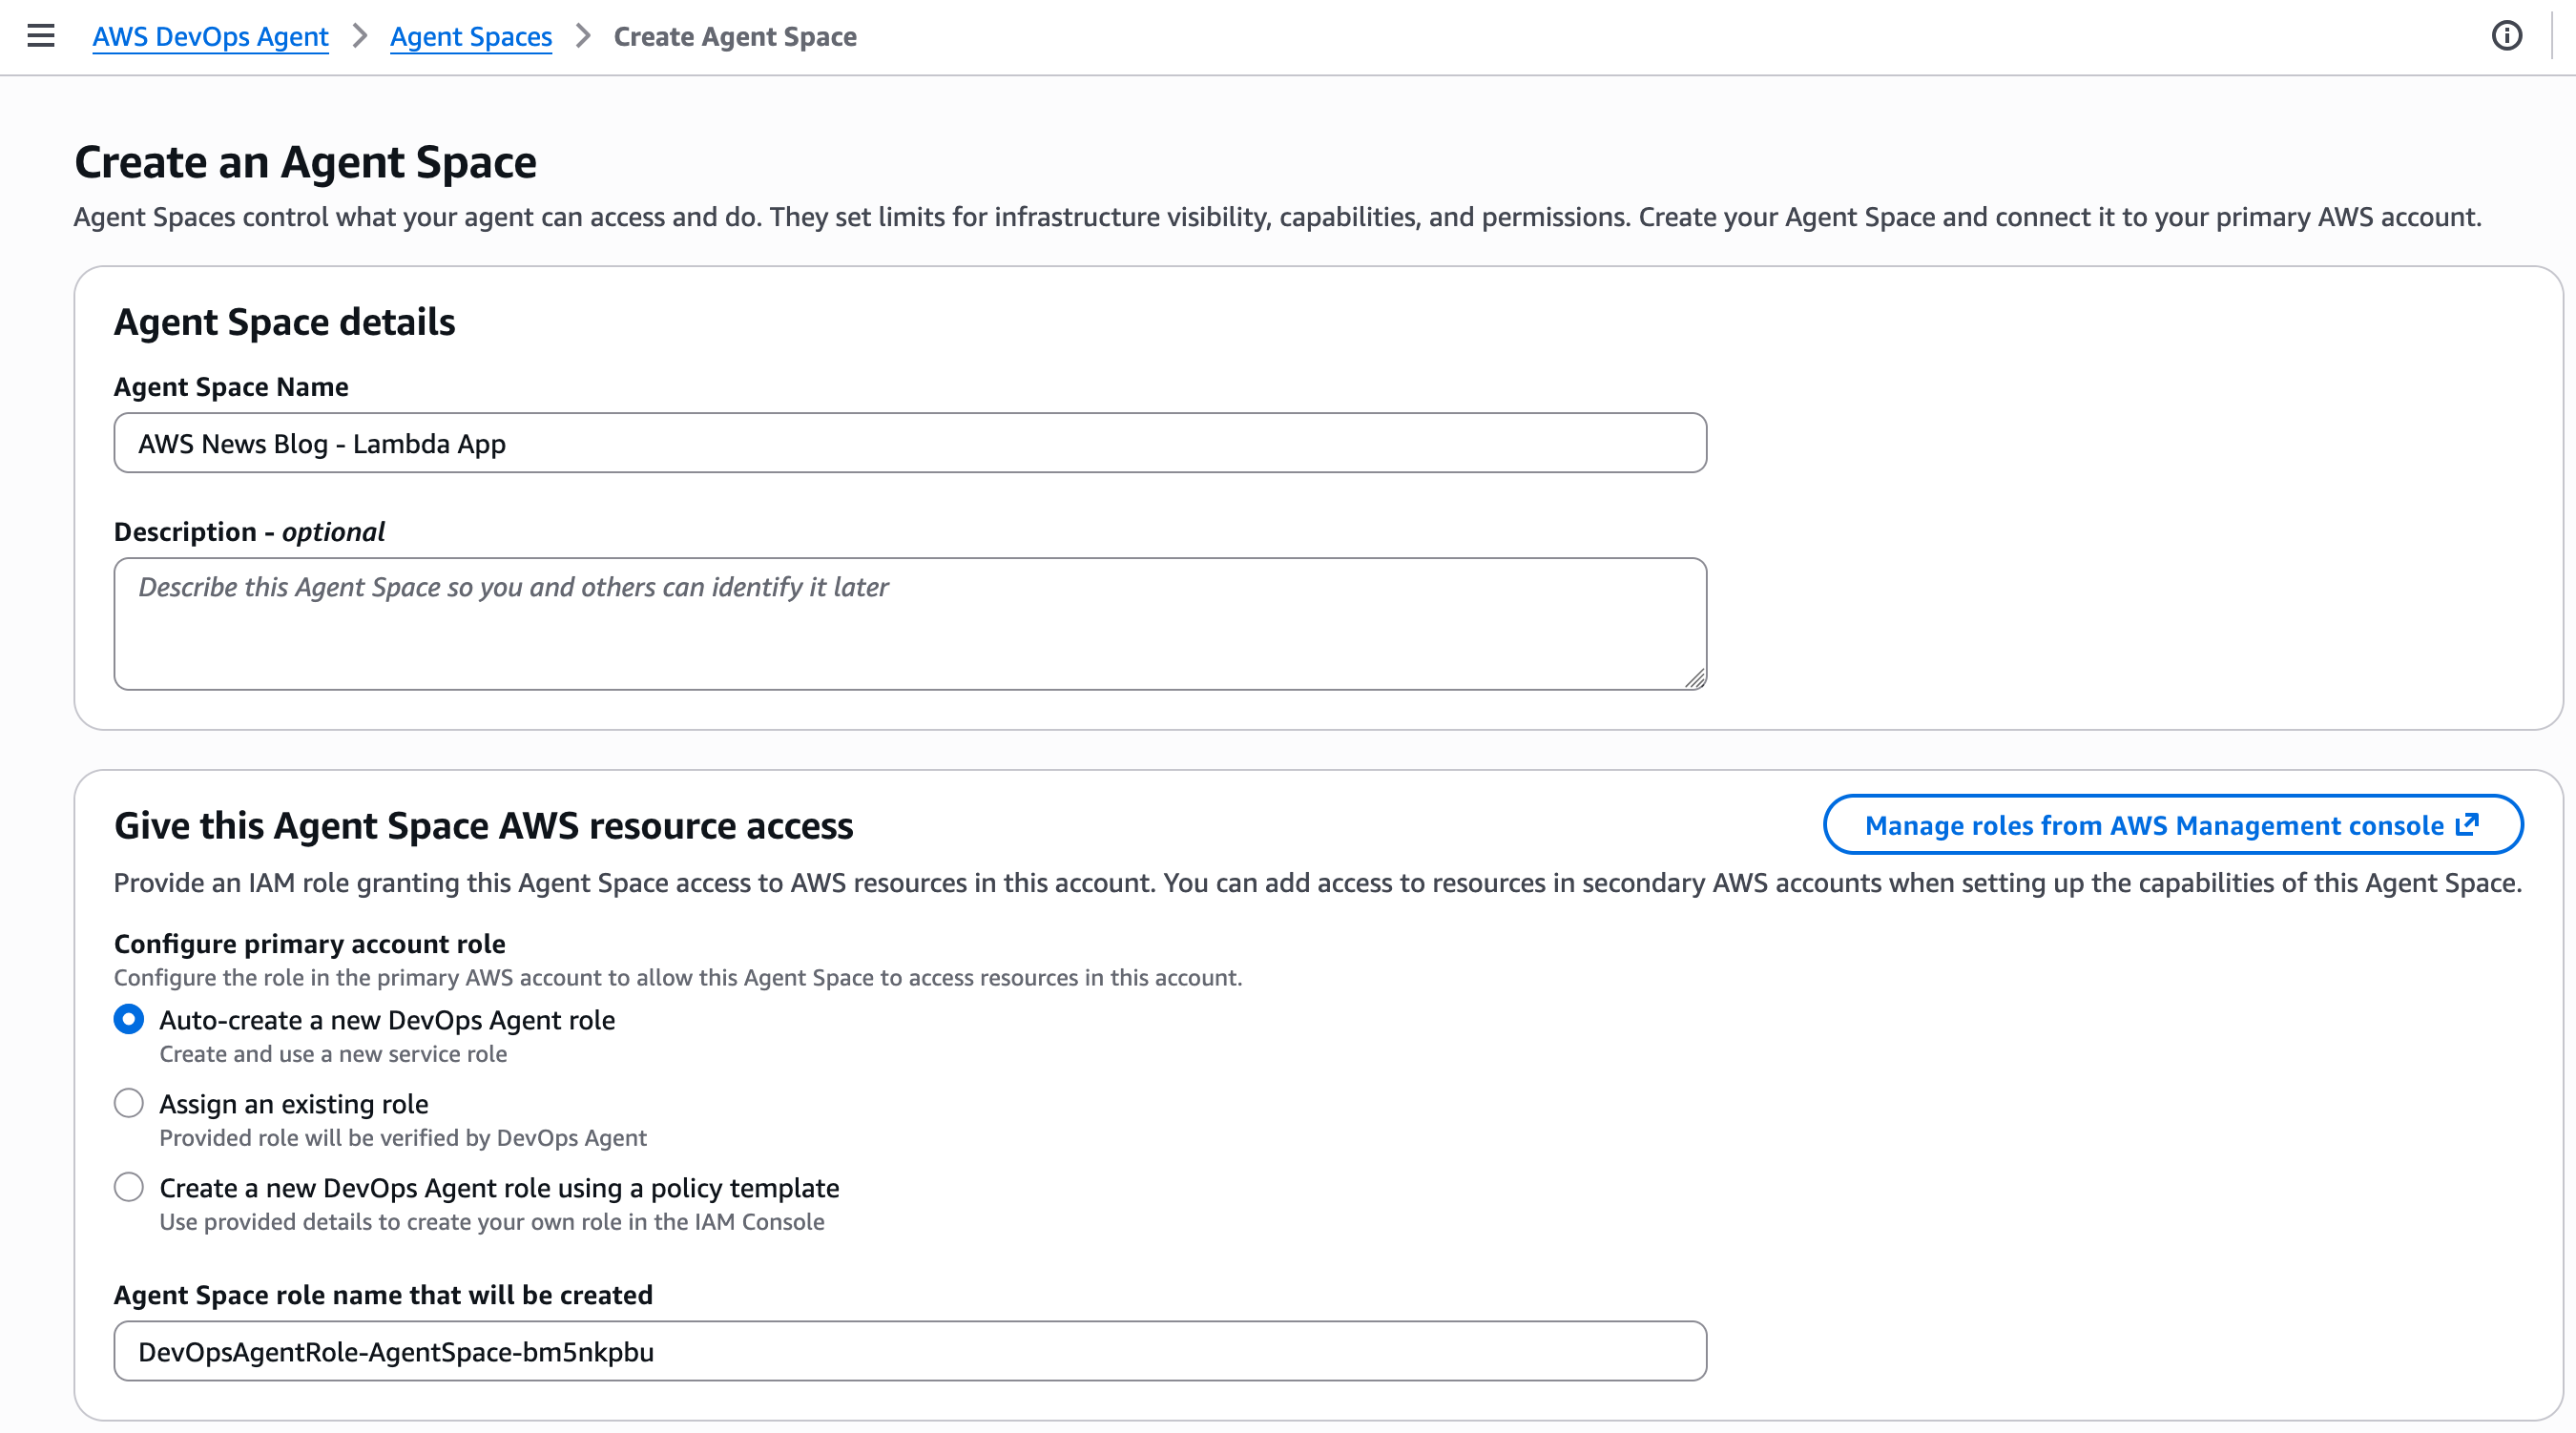
Step 1: Create an Agent Space
An Agent Space defines the scope of what AWS DevOps Agent can access as it performs tasks.
You can organize Agent Spaces based on your operational model. Some teams align an Agent Space with a single application, others create one per on-call team managing multiple services, and some organizations use a centralized approach. For this demonstration, I’ll show you how to create an Agent Space for a single application. This setup helps isolate investigations and resources for that specific application, making it easier to track and analyze incidents within its context.
In the AWS DevOps Agent section of the AWS Management Console, I select Create Agent Space, enter a name for this space and create the AWS Identity and Access Management (IAM) roles it uses to introspect AWS resources in my or others’ AWS accounts.
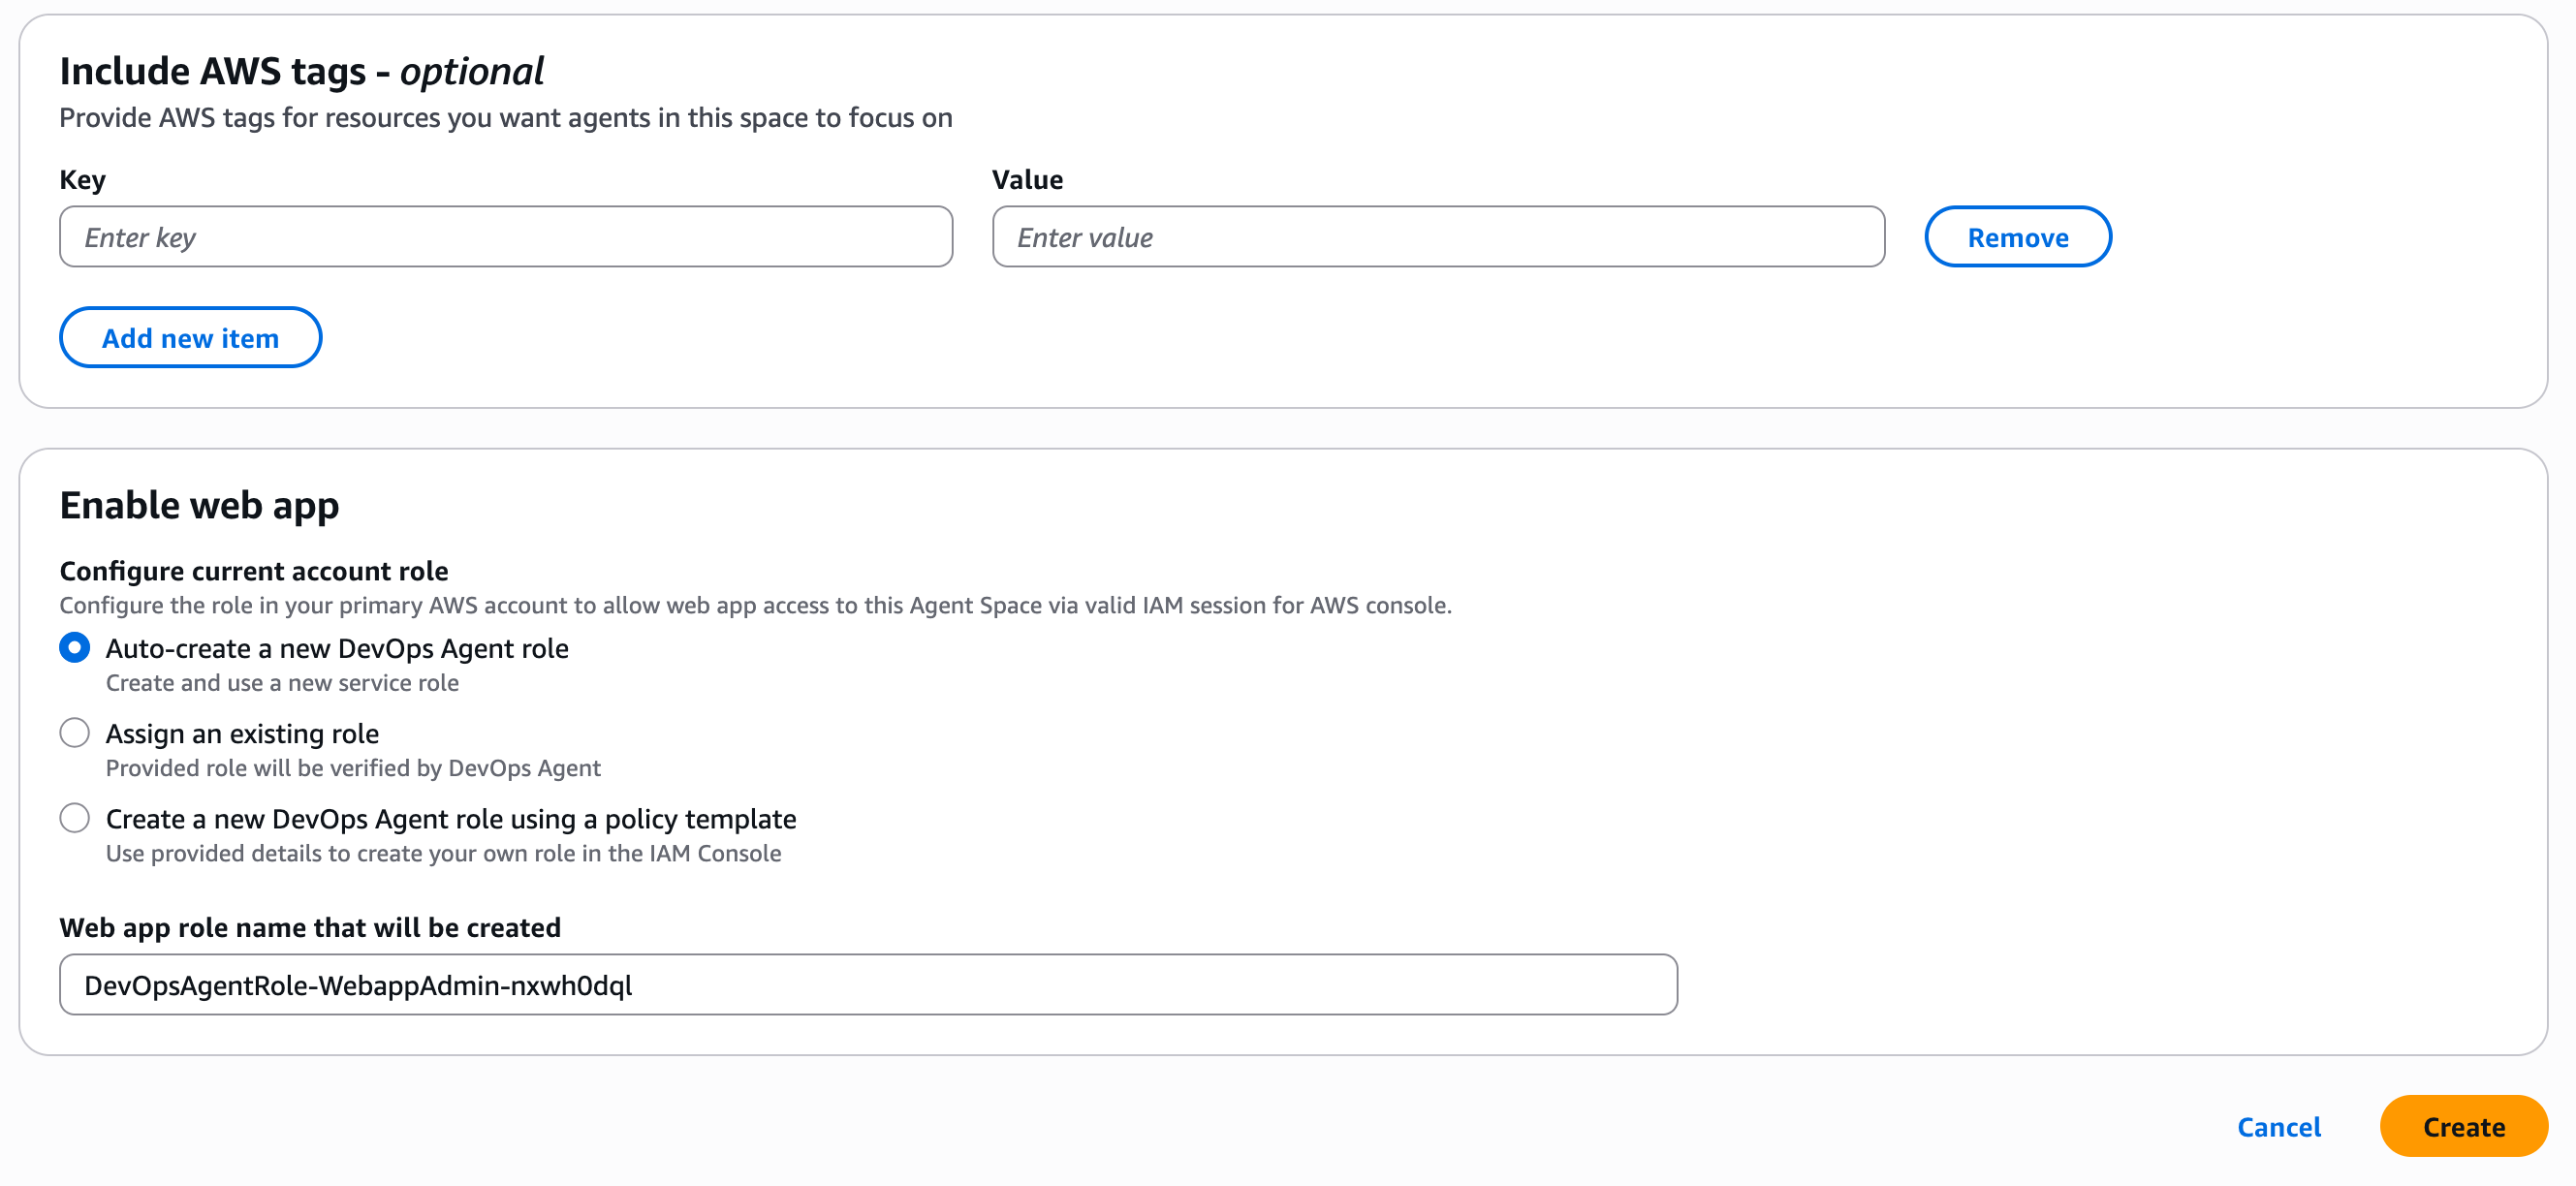
 For this demo, I choose to enable the AWS DevOps Agent web app; more about this later. This can be done at a later stage.
When ready, I choose Create.
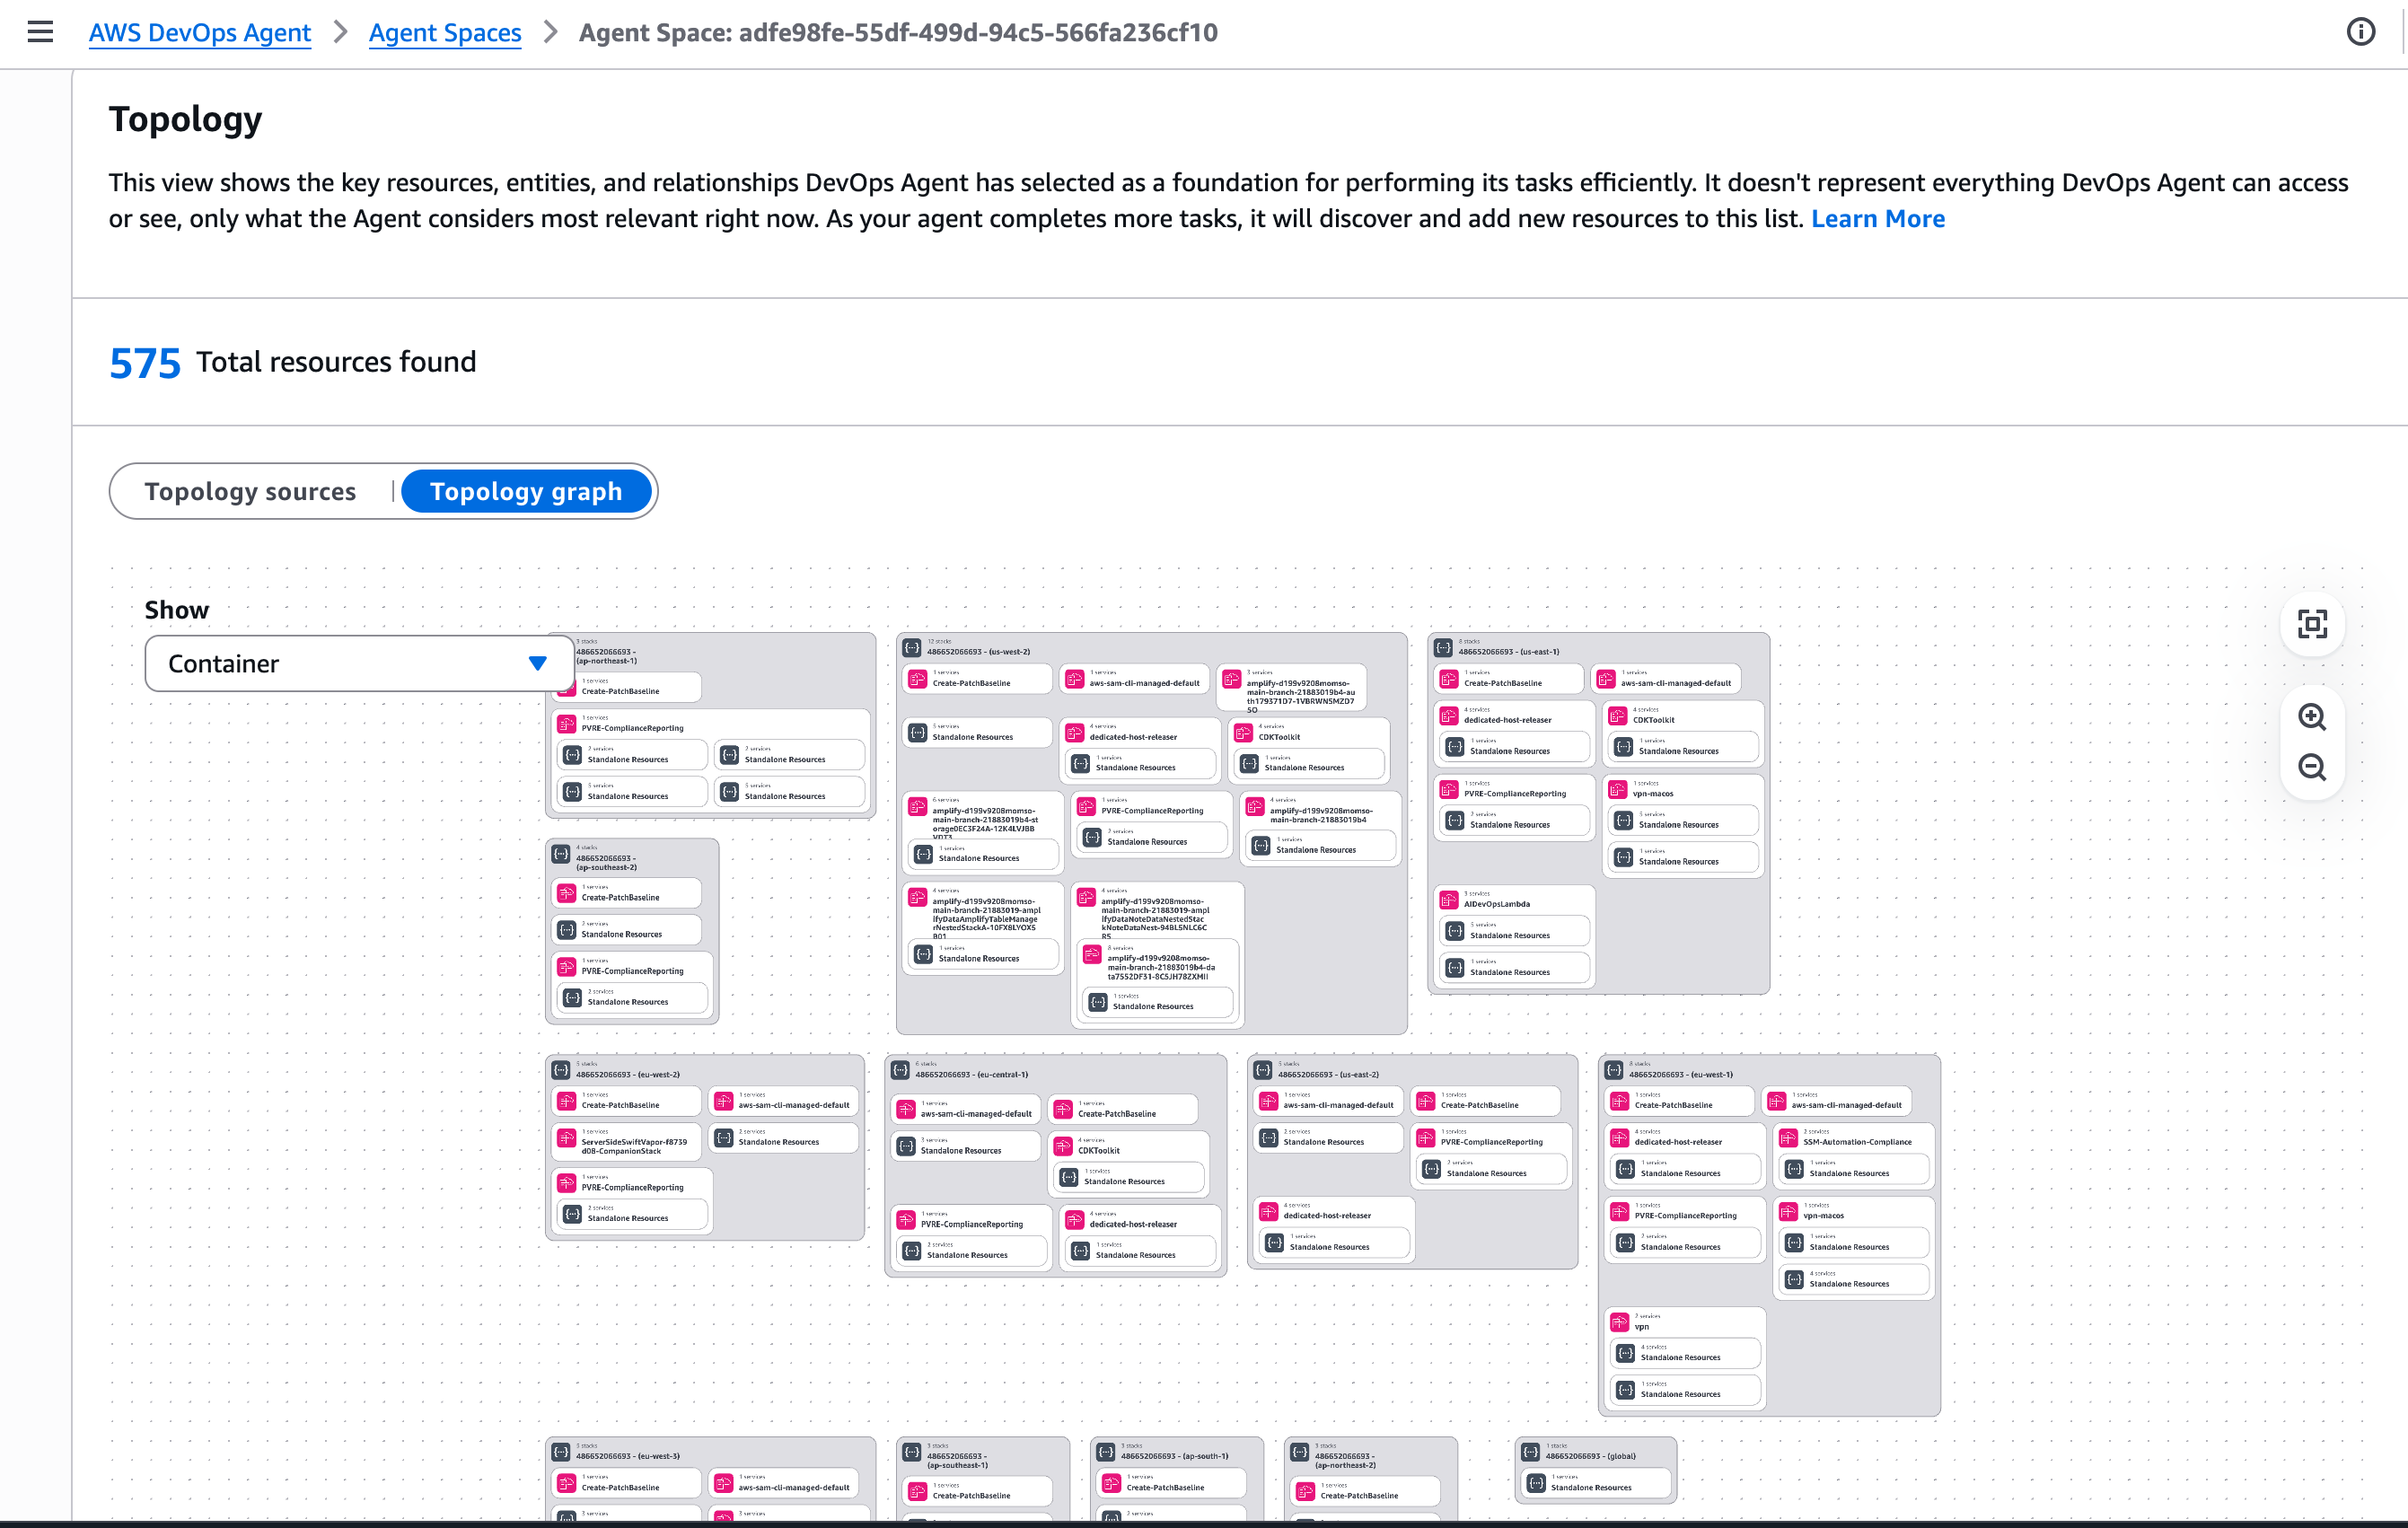
 After it has been created, I choose the Topology tab.
This view shows the key resources, entities, and relationships AWS DevOps Agent has selected as a foundation for performing its tasks efficiently. It doesn’t represent everything AWS DevOps Agent can access or see, only what the Agent considers most relevant right now. By default, the Topology includes the AWS resources that are contained in my account. As your agent completes more tasks, it will discover and add new resources to this list.
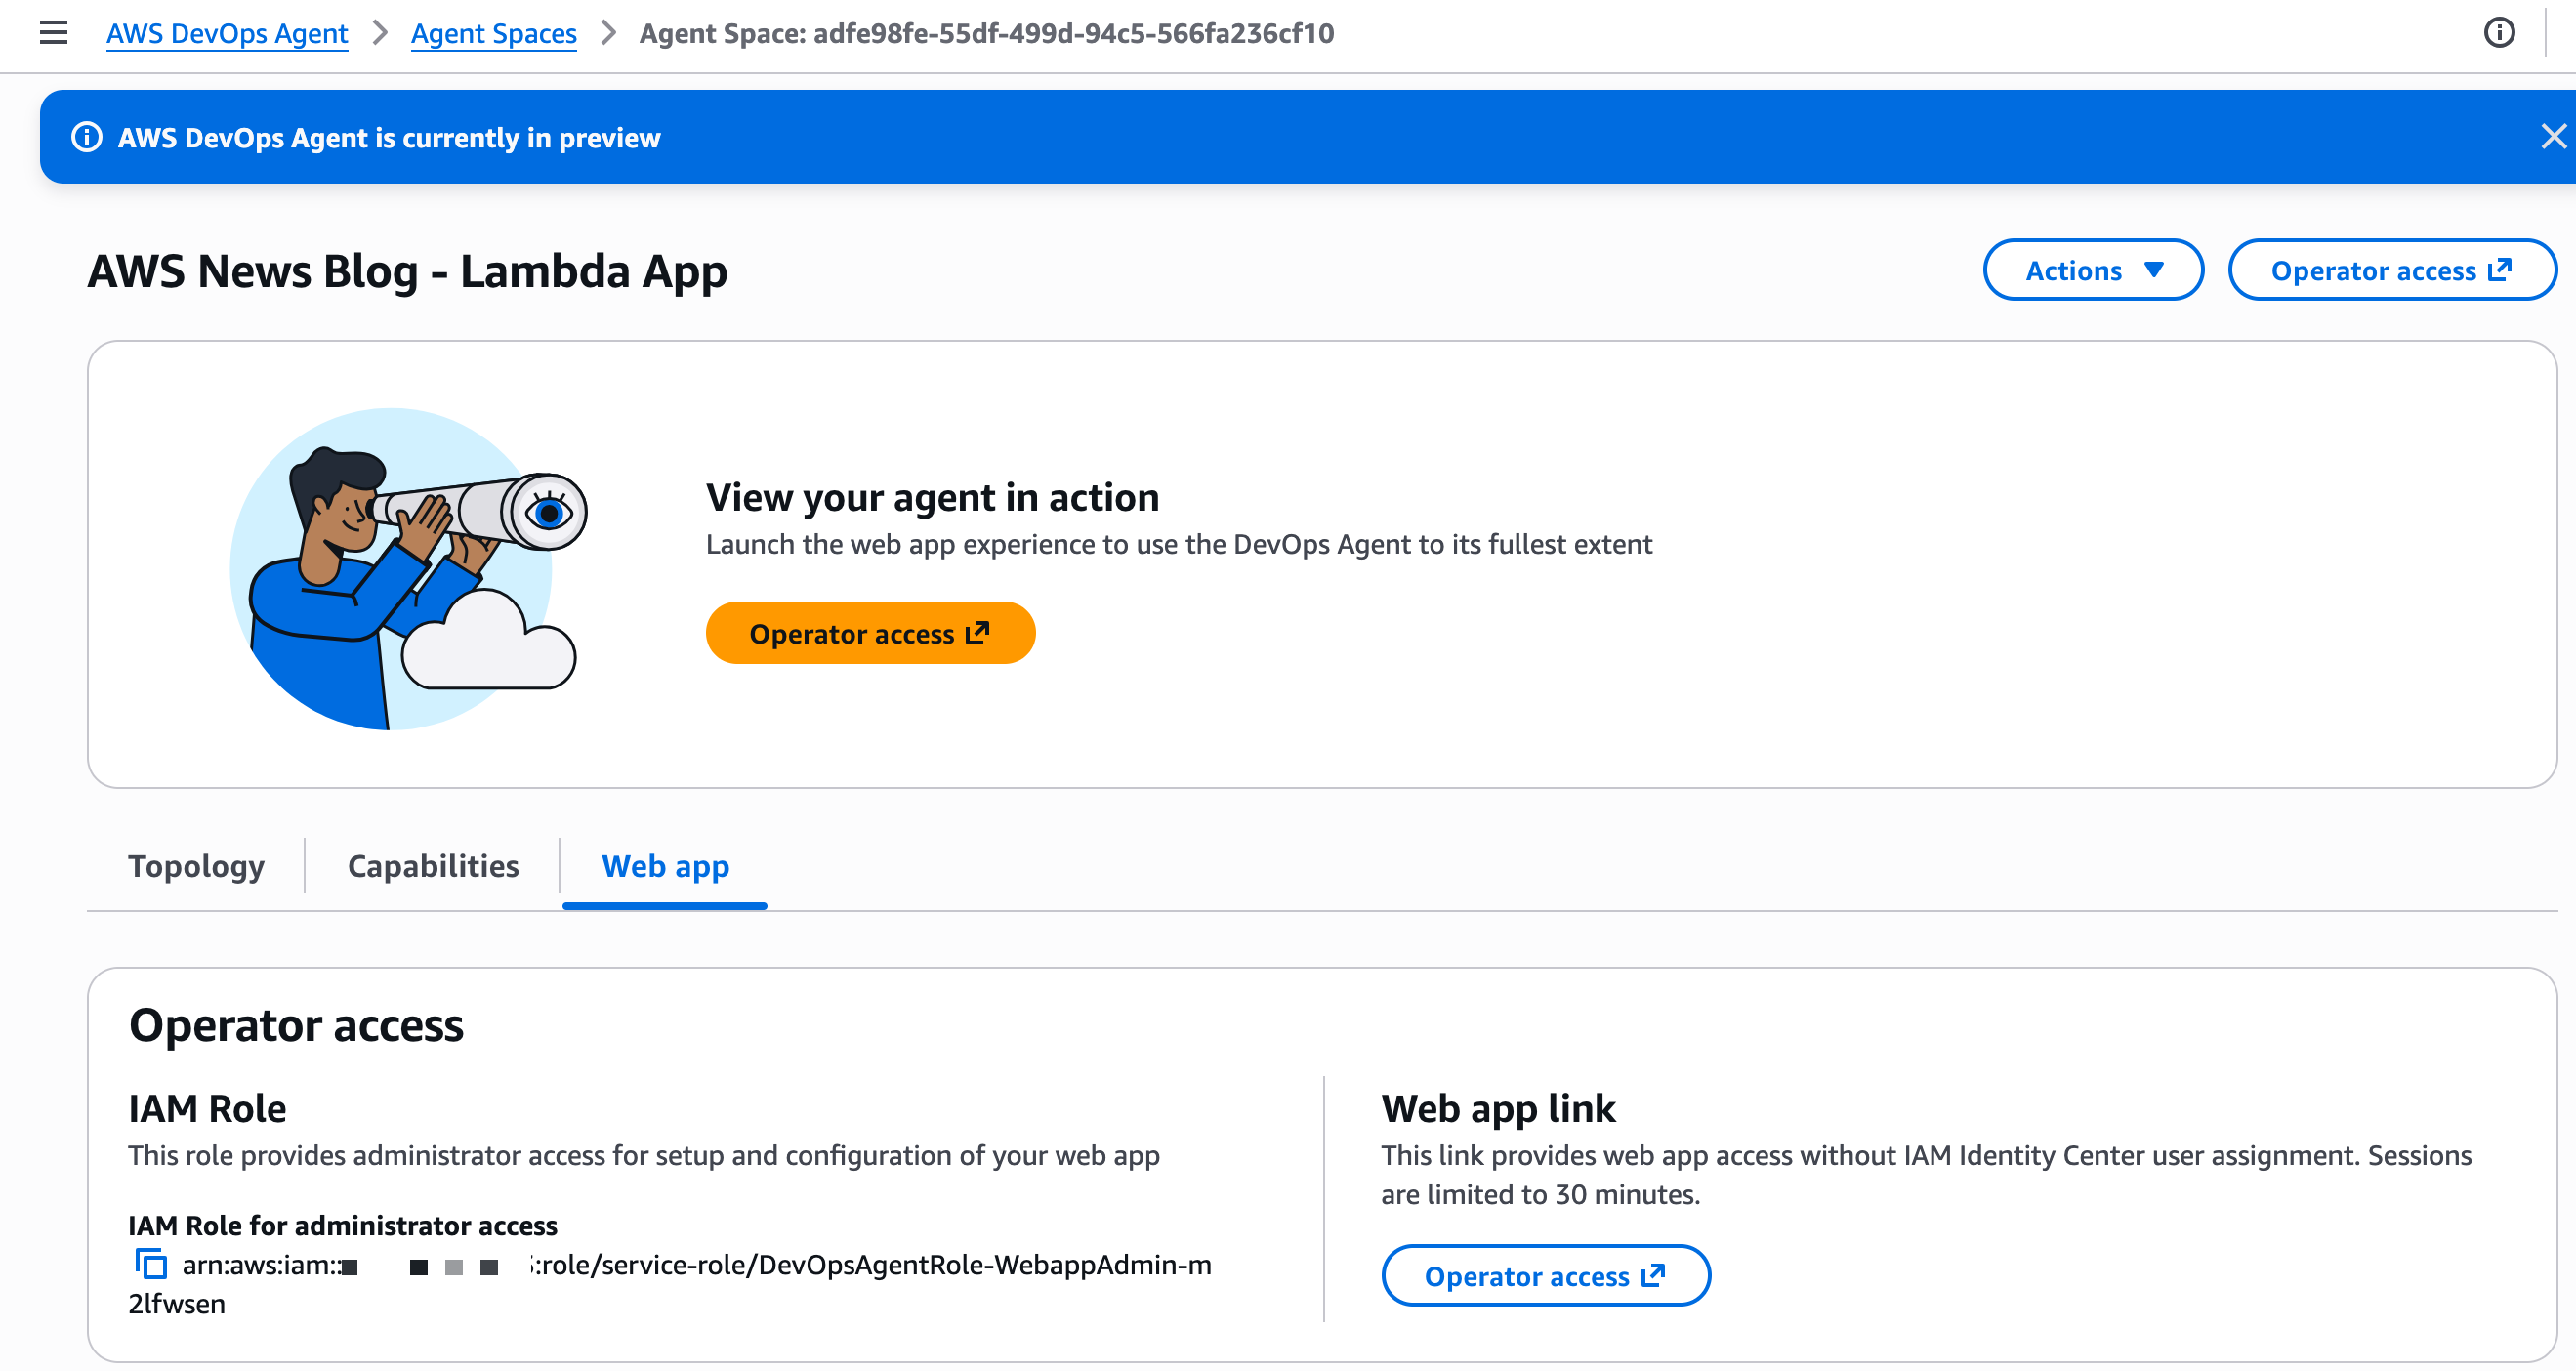
Step 2: Configure the AWS DevOps web app for the operators
The AWS DevOps Agent web app provides a web interface for on-call engineers to manually trigger investigations, view investigation details including relevant topology elements, steer investigations, and ask questions about an investigation.
I can access the web app directly from my Agent Space in the AWS console by choosing the Operator access link. Alternatively, I can use AWS IAM Identity Center to configure user access for my team. IAM Identity Center lets me manage users and groups directly or connect to an identity provider (IdP), providing a centralized way to control who can access the AWS DevOps Agent web app.
At this stage, I have an Agent Space all set up to focus investigations and resources for this specific application, and I’ve enabled the DevOps team to initiate investigations using the web app.
Now that the one-time setup for this application is done, I start invoking the faulty Lambda function. It generates errors at each invocation. The CloudWatch alarm associated with the Lambda errors count turns on to ALARM state. In real life, you might receive an alert from external services, such as ServiceNow. You can configure AWS DevOps Agent to automatically start investigations when receiving such alerts.
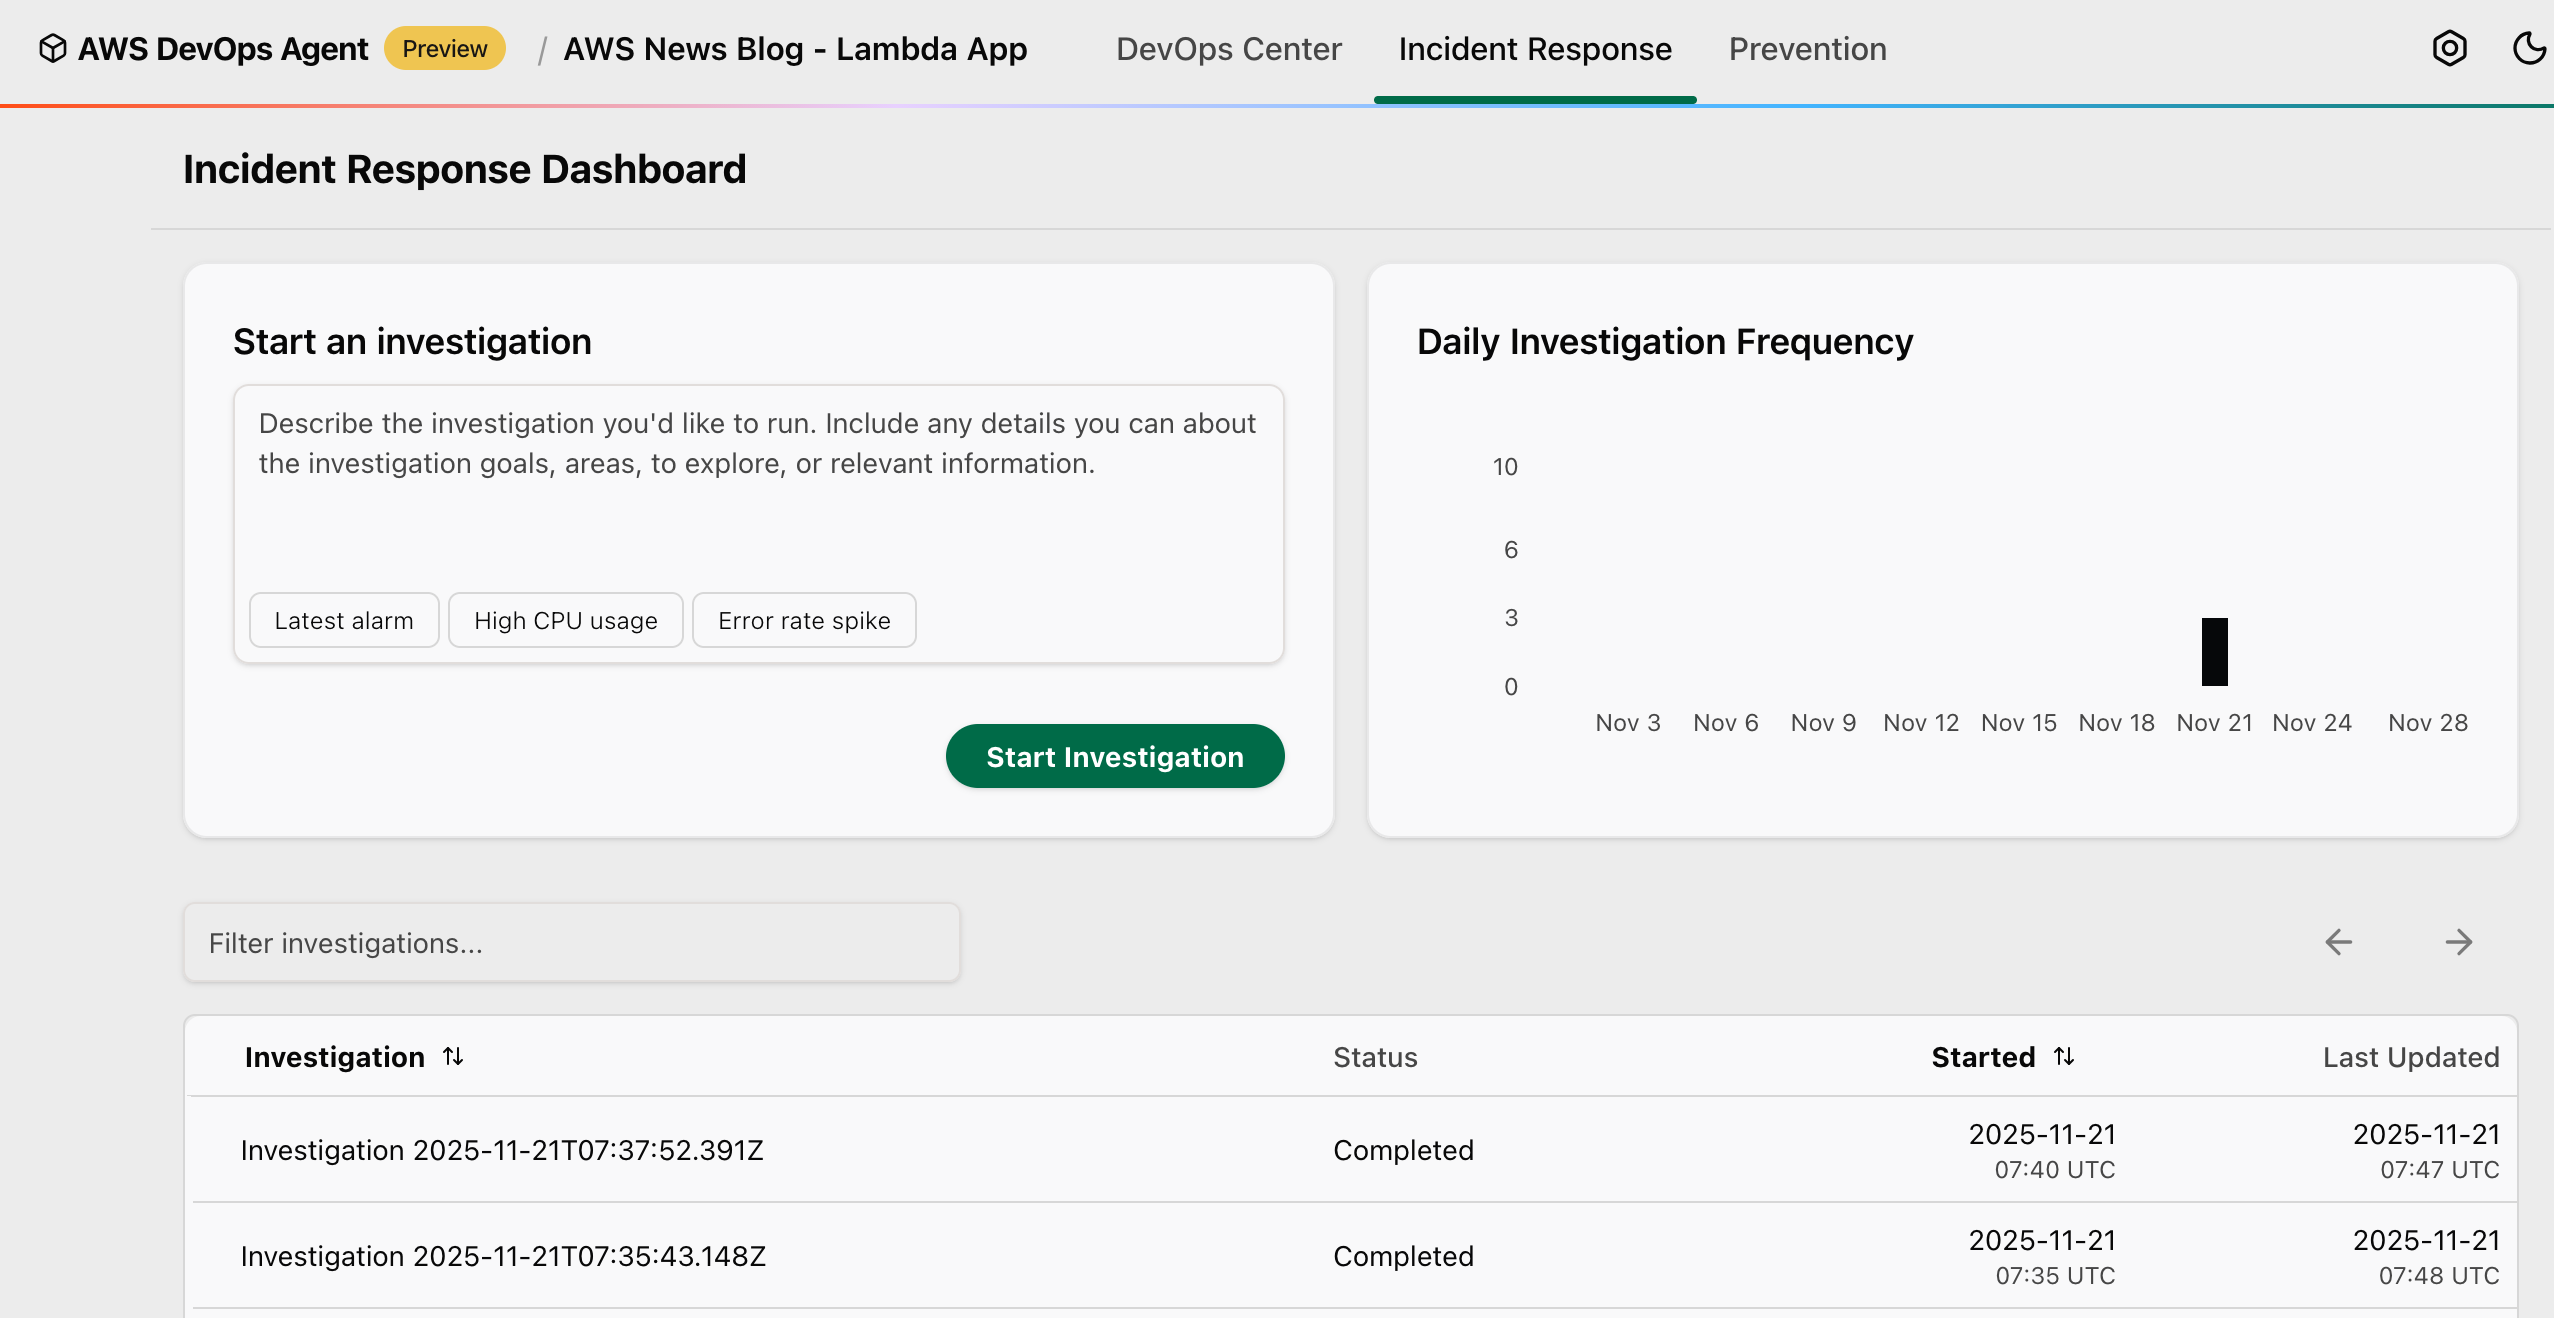
For this demo, I manually start the investigation by selecting Start Investigation.
You can also choose from several preconfigured starting points to quickly begin your investigation: Latest alarm to investigate your most recent triggered alarm and analyze the underlying metrics and logs to determine the root cause, High CPU usage to investigate high CPU utilization metrics across your compute resources and identify which processes or services are consuming excessive resources, or Error rate spike to investigate the recent increase in application error rates by analyzing metrics, application logs, and identifying the source of failures.
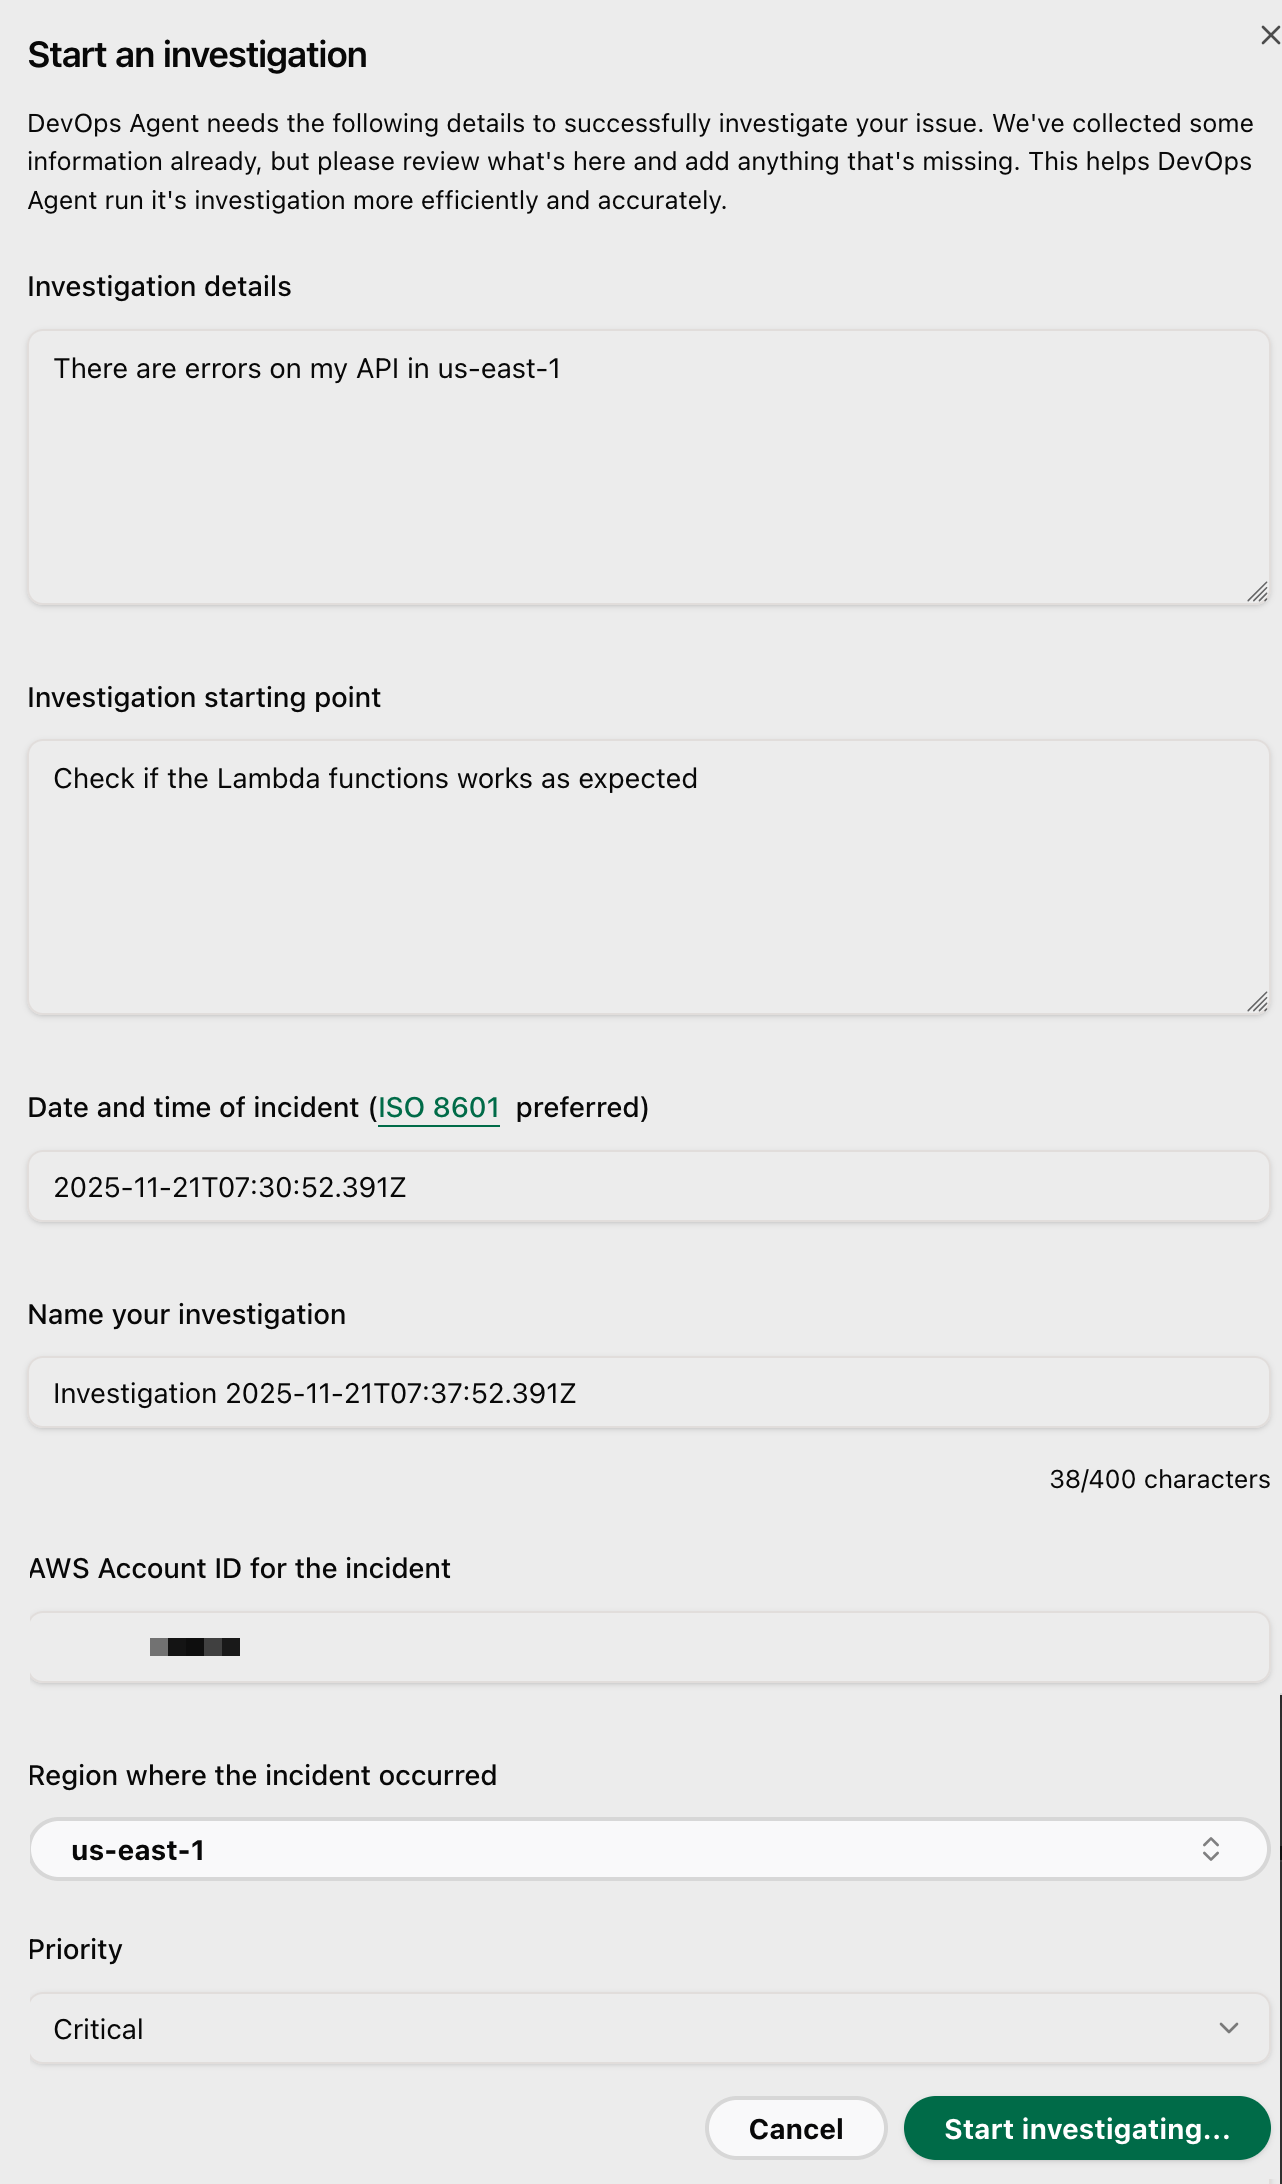
I enter some information, such as Investigation details, Investigation starting point, the Date and time of the incident, the AWS Account ID for the incident.
In the AWS DevOps Agent web app, you can watch the investigation unfold in real time. The agent identifies the application stack. It correlates metrics from CloudWatch, examines logs from CloudWatch Logs or external sources, such as Splunk, reviews recent code changes from GitHub, and analyzes traces from AWS X-Ray.
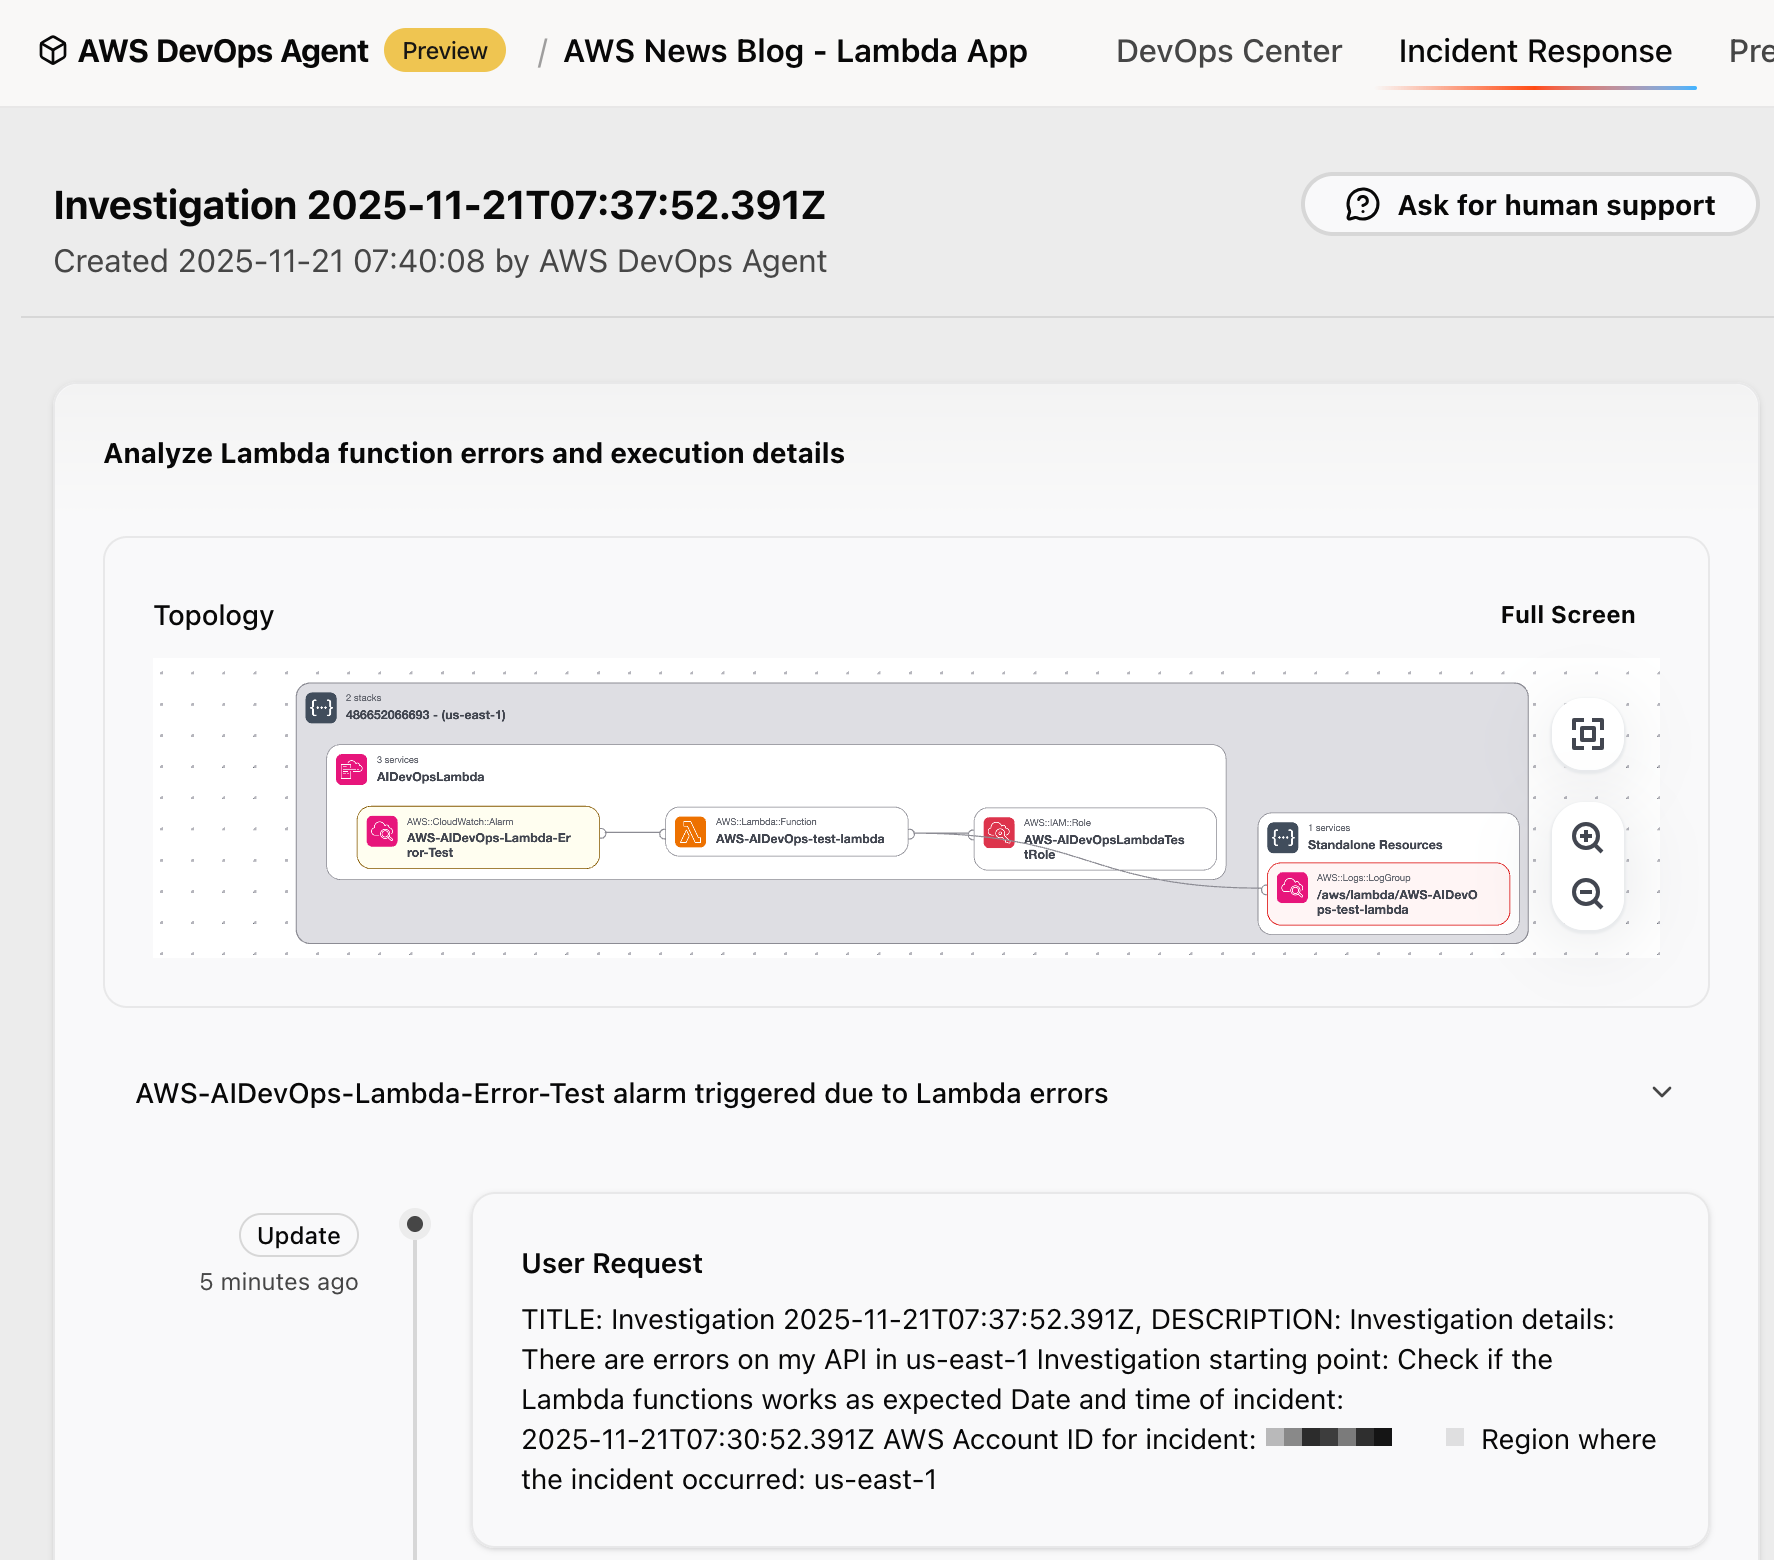
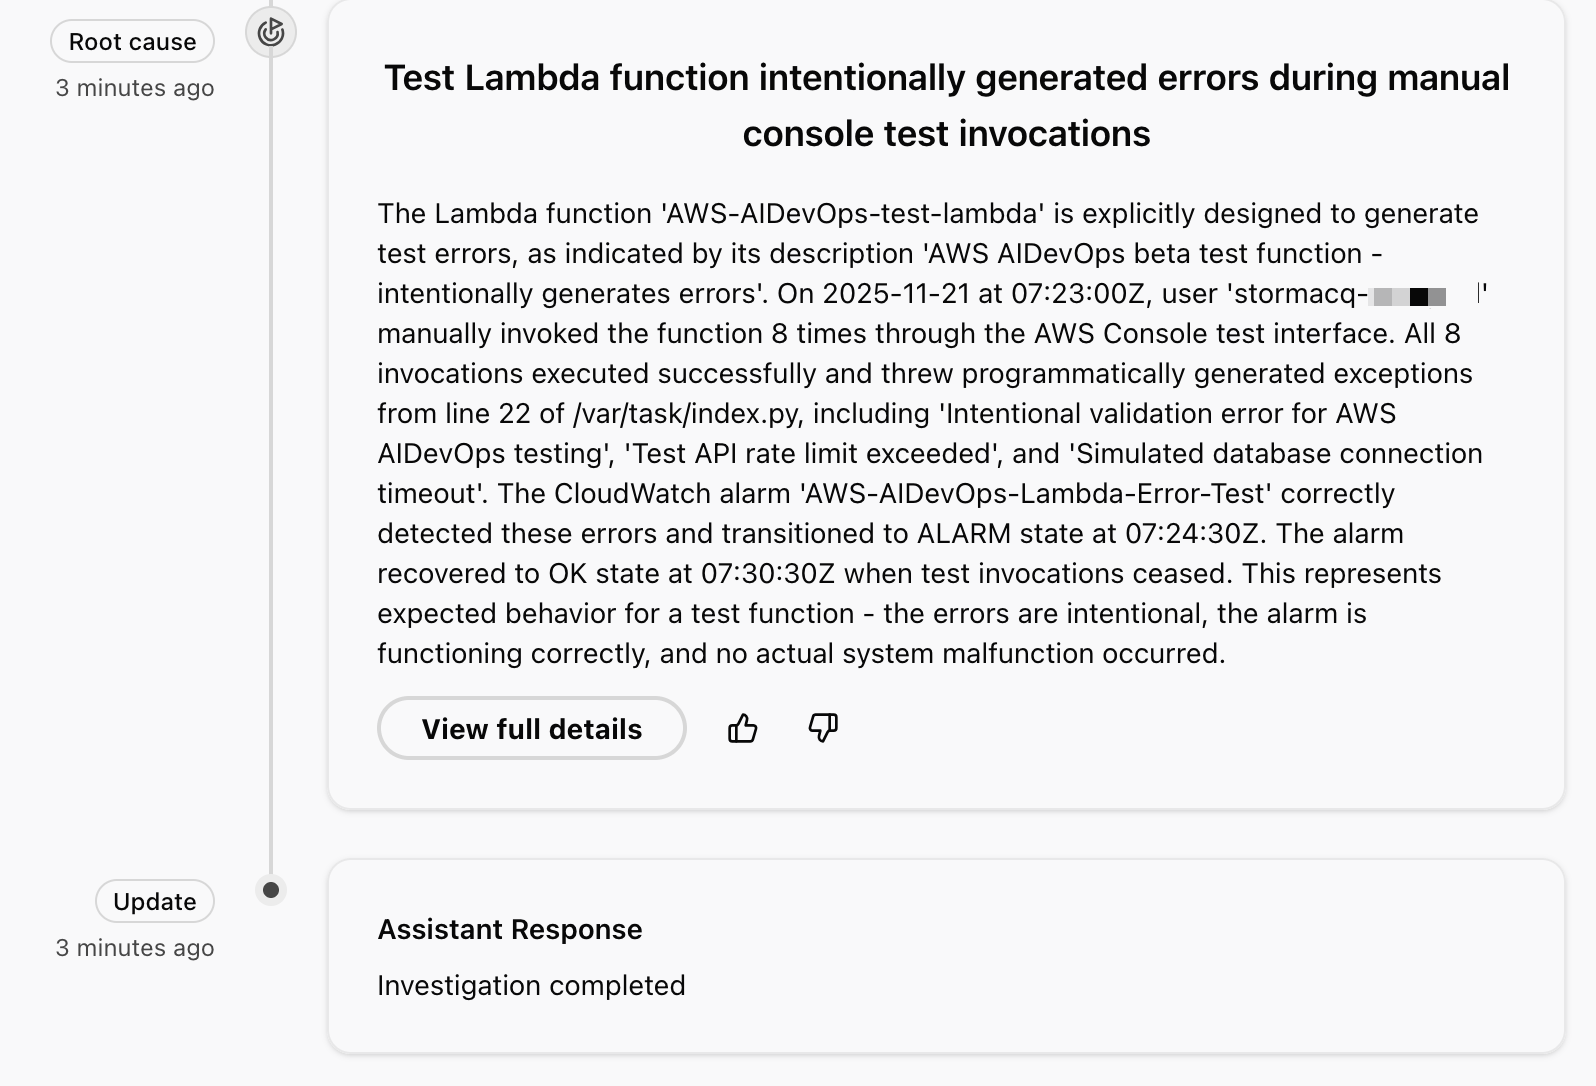
It identifies the error patterns and provides a detailed investigation summary. In the context of this demo, the investigation reveals that these are intentional test exceptions, shows the timeline of function invocations leading to the alarm, and even suggests monitoring improvements for error handling.
The agent uses a dedicated incident channel in Slack, notifies on-call teams if needed, and provides real-time status updates to stakeholders. Through the investigation chat interface, you can interact directly with the agent by asking clarifying questions such as “which logs did you analyze?” or steering the investigation by providing additional context, such as “focus on these specific log groups and rerun your analysis.” If you need expert assistance, you can create an AWS Support case with a single click, automatically populating it with the agent’s findings, and engage with AWS Support experts directly through the investigation chat window.
For this demo, the AWS DevOps Agent correctly identified manual activities in the Lambda console to invoke a function that intentionally triggers errors ?.
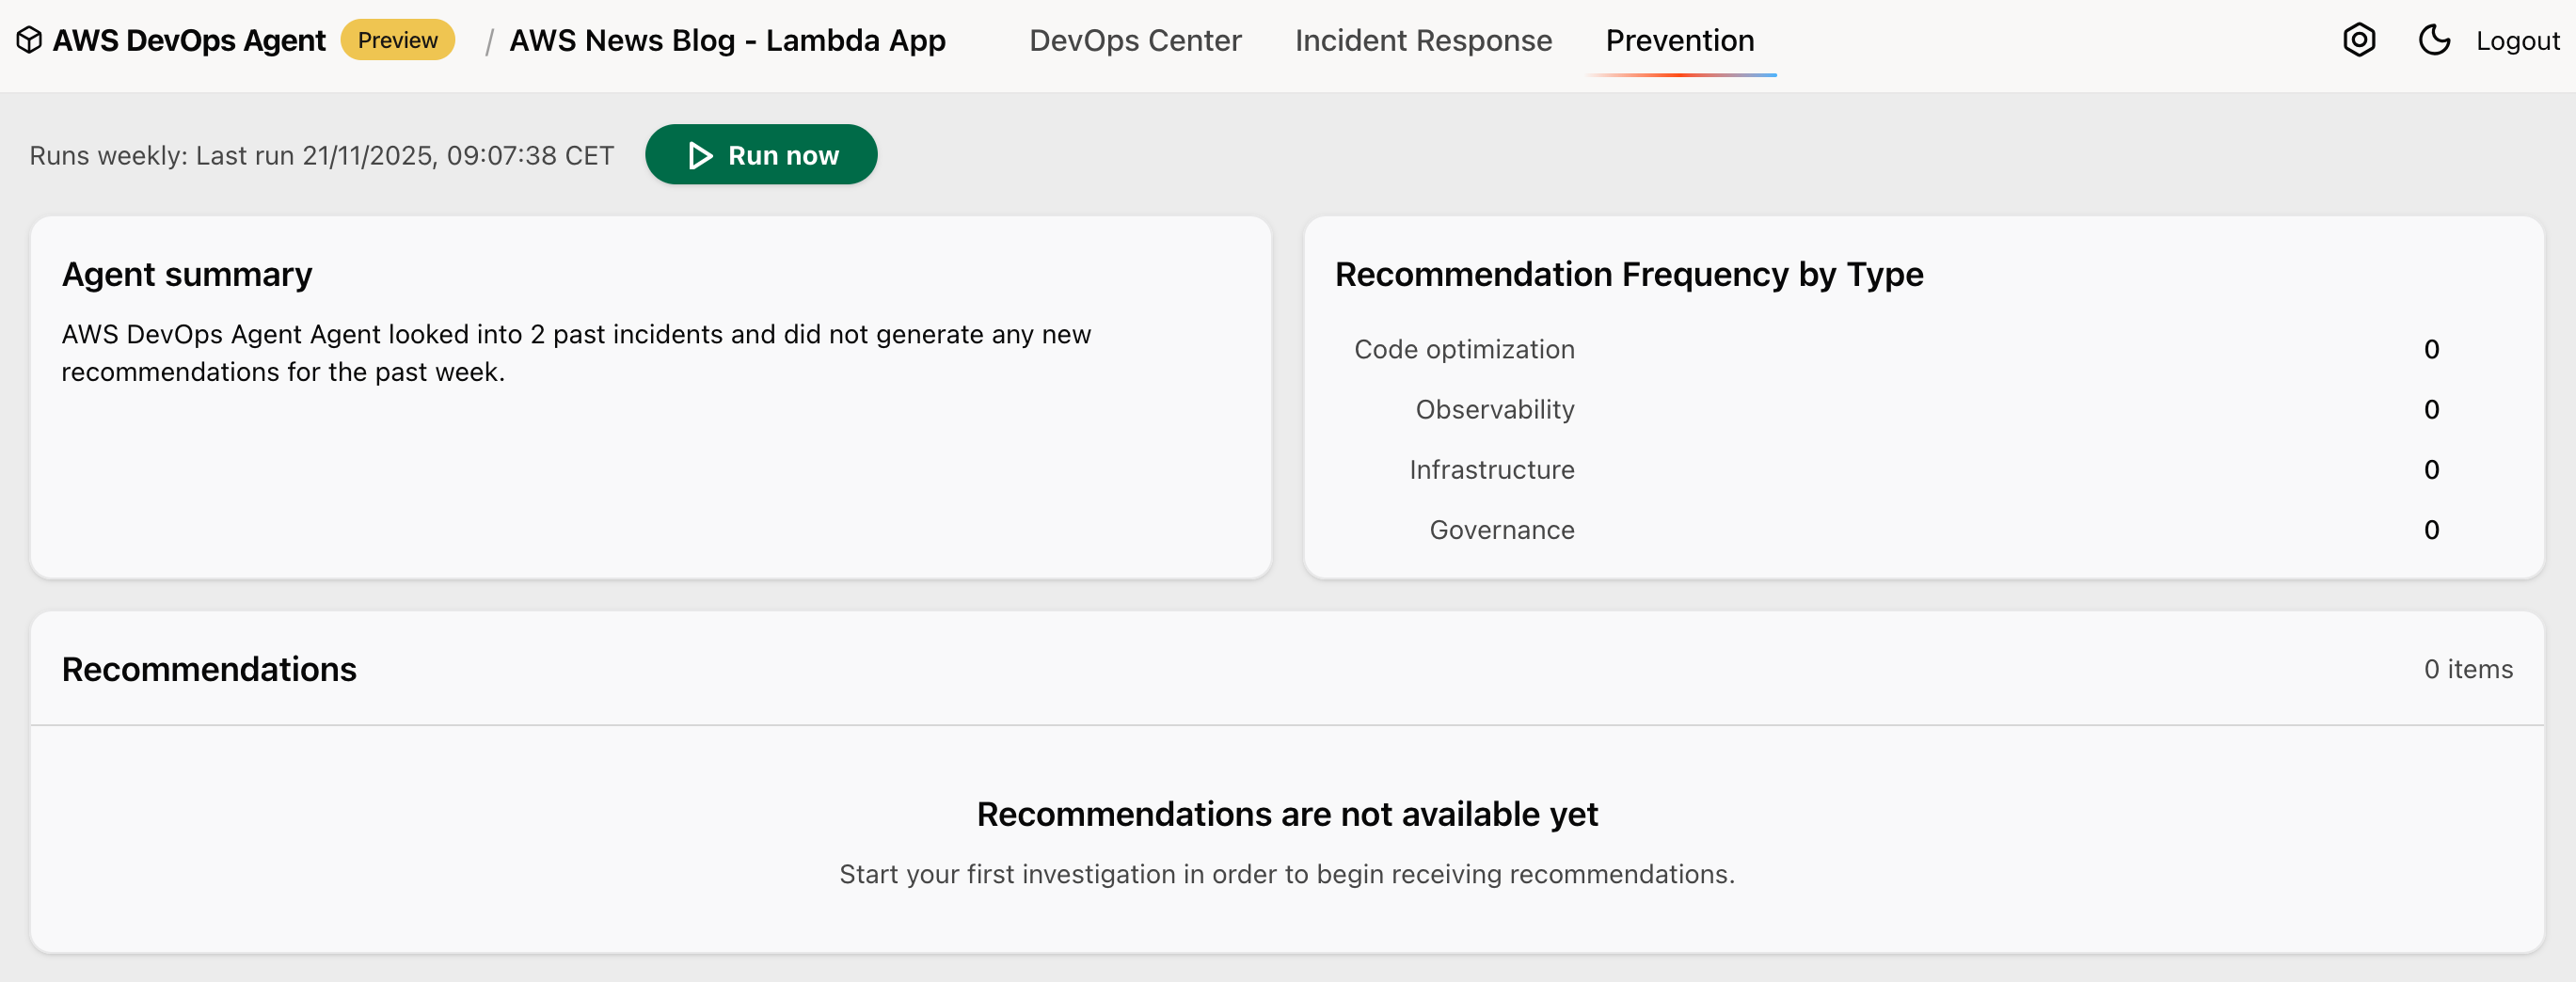
Beyond incident response, AWS DevOps Agent analyzes my recent incidents to identify high-impact improvements that prevent future issues.
During active incidents, the agent offers immediate mitigation plans through its incident mitigations tab to help restore service quickly. Mitigation plans consist of specs that provide detailed implementation guidance for developers and agentic development tools like Kiro.
For longer-term resilience, it identifies potential enhancements by examining gaps in observability, infrastructure configurations, and deployment pipeline. My straightforward demo that triggered intentional errors was not enough to generate relevant recommendations though.
For example, it might detect that a critical service lacks multi-AZ deployment and comprehensive monitoring. The agent then creates detailed recommendations with implementation guidance, considering factors like operational impact and implementation complexity. In an upcoming quick follow-up release, the agent will expand its analysis to include code bugs and testing coverage improvements.
Availability
You can try AWS DevOps Agent today in the US East (N. Virginia) Region. Although the agent itself runs in US East (N. Virginia) (us-east-1), it can monitor applications deployed in any Region, across multiple AWS accounts.
During the preview period, you can use AWS DevOps Agent at no charge, but there will be a limit on the number of agent task hours per month.
As someone who has spent countless nights debugging production issues, I’m particularly excited about how AWS DevOps Agent combines deep operational insights with practical, actionable recommendations. The service helps teams move from reactive firefighting to proactive system improvement.
To learn more and sign up for the preview, visit AWS DevOps Agent. I look forward to hearing how AWS DevOps Agent helps improve your operational efficiency.
— seb