AWS News Blog
New – Amazon CloudWatch Logs Insights – Fast, Interactive Log Analytics

|
Many AWS services create logs. Off the top of my head there are VPC Flow Logs, Route 53 Logs, Lambda Logs, CloudTrail Logs (for AWS API calls), RDS Logs, IoT Logs, ECS Logs, API Gateway Logs, and S3 Server Access Logs, EC2 Instance Logs (via the CloudWatch Agent), to name a few. The services that you run on your EC2 instances (Apache, Tomcat, NGINX, and the like) also produce logs, and your application code probably does the same.
Embedded within these logs are the data points, patterns, trends, and insights that you can use to understand how your applications and AWS resources are behaving, identify room for improvement, and to address operational issues. But, as usual, there’s a catch. The breadth of formats and data elements and the sheer size of the raw logs can make analysis difficult. When individual AWS customers routinely generate 100 terabytes or more of log files each day, old-school tools such as find and grep no longer suffice!
CloudWatch Logs Insights
The new CloudWatch Logs Insights will help! This is a fully managed service that is designed to work at cloud scale, with no setup or maintenance required. It plows through massive logs in seconds, and gives you fast, interactive queries and visualizations. It can can handle any log format, and auto-discovers fields from JSON logs. As you will see, it is very flexible, and will quickly become one of your favorite tools for diving in to your logs.
CloudWatch Logs Insights includes a sophisticated ad-hoc query language, with commands to fetch desired event fields, filter based on conditions, calculate aggregate statistics including percentiles and time series aggregations, sort on any desired file, and limit the number of events returned by a query. You can also use regular expressions to extract data from an event field, creating one or more ephemeral fields that can be further processed by the query. You can visualize query results using line and stacked area charts, and you can add queries to a CloudWatch Dashboard. There’s even a rich set of sample queries to get you started.
Insights in Action
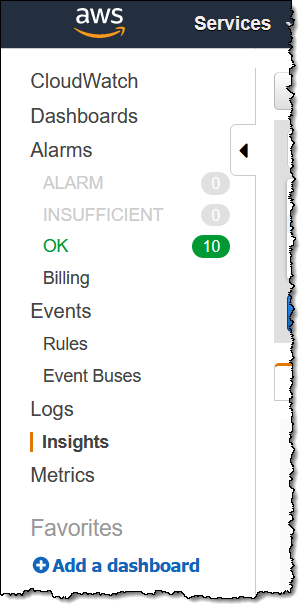
To get started, I open the CloudWatch Console and click Insights:
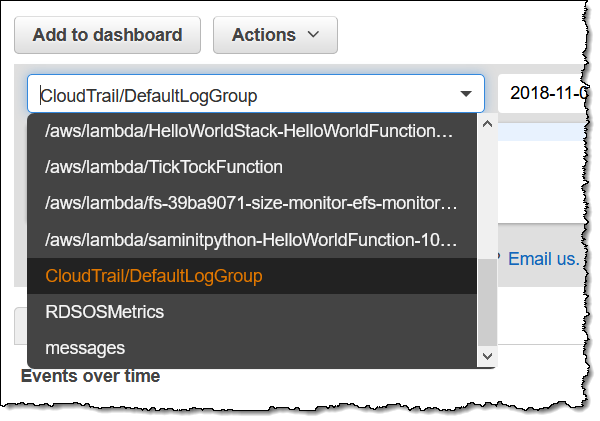
Then I choose the desired Log Group using the menu:
I can enter a query, or I can choose one of the samples:
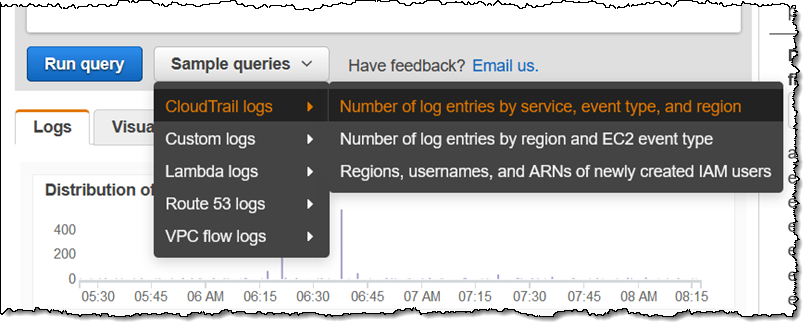
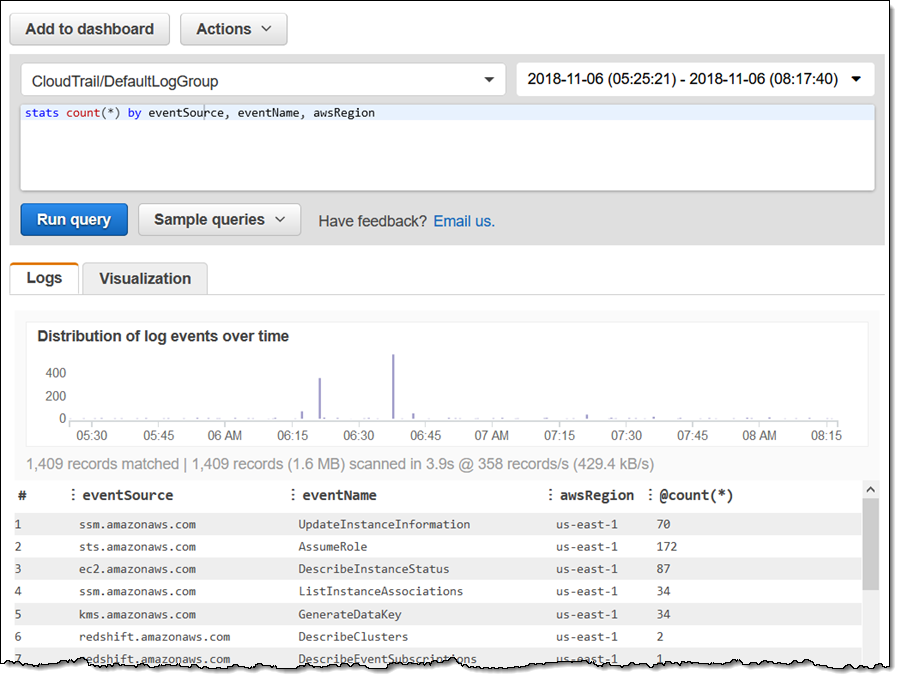
As you can see, sample queries are supplied for several different types of logs. I pick the first one, click Run query, the logs are scanned and the results are visible within seconds:
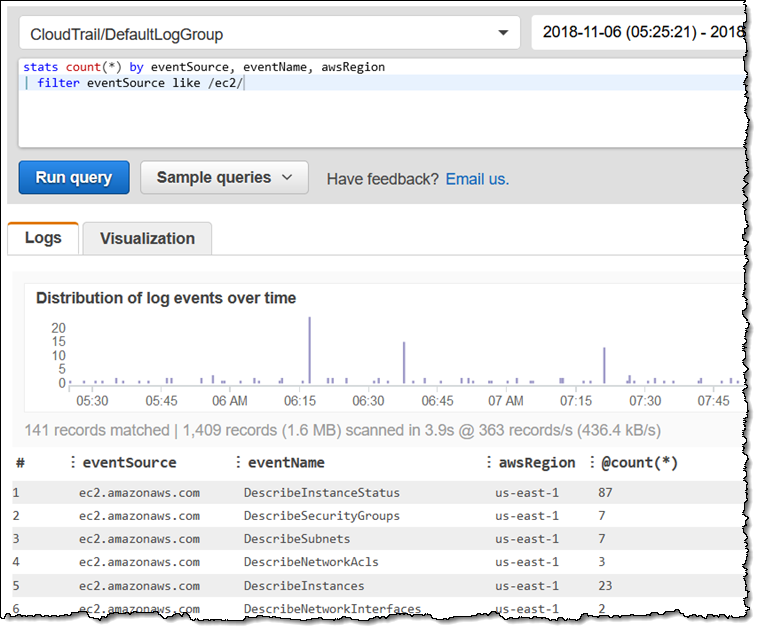
I can add a filter to my query and run it again. Perhaps I want to focus on EC2 API calls, so I use a pipe ( | ) and the filter command:
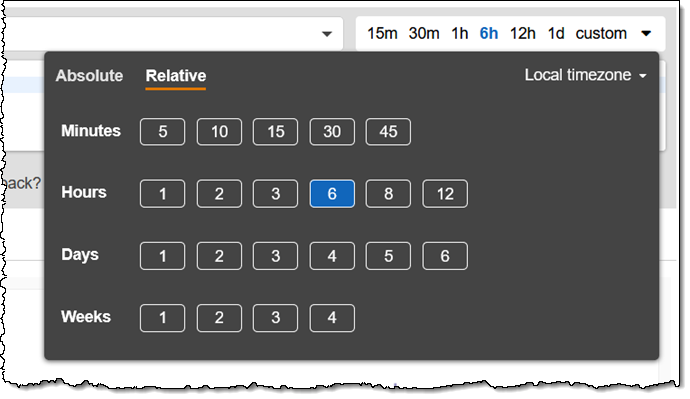
I can filter by an absolute or relative time range:
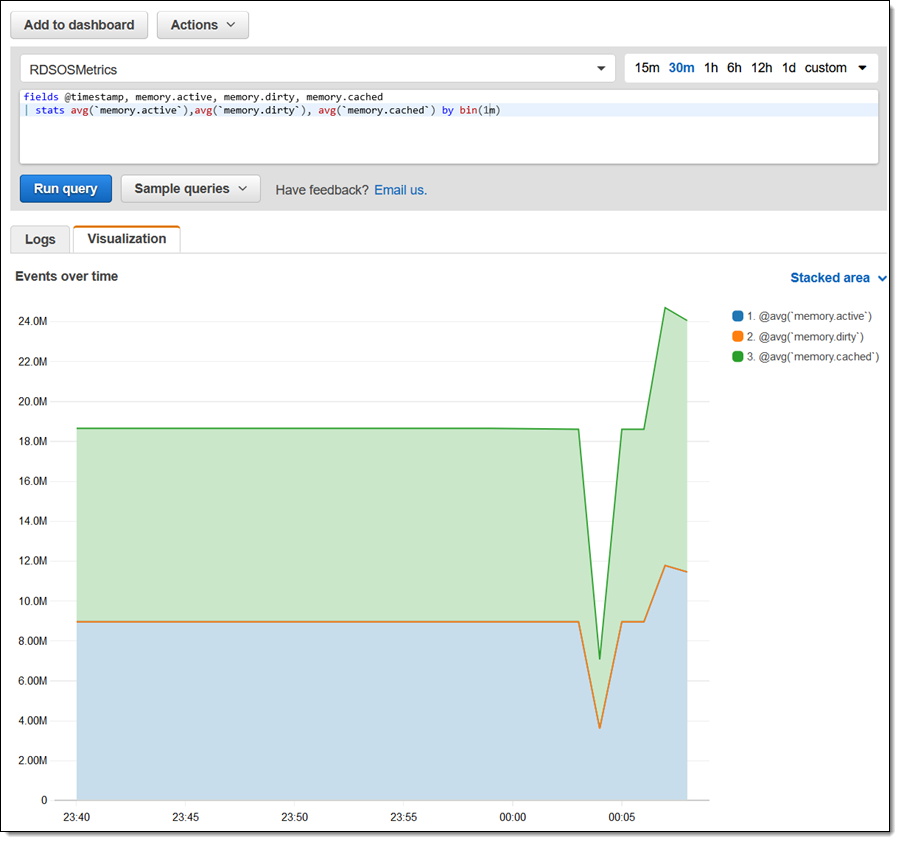
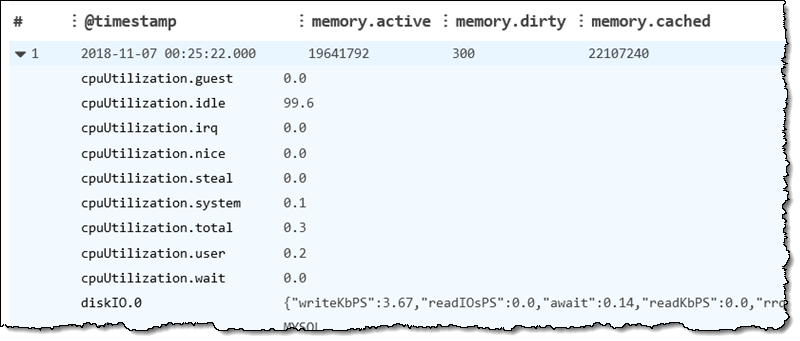
I can also generate visualizations. Here’s a simple one: Amazon RDS memory usage metrics for the last 30 minutes, grouped into 1-minute bins:
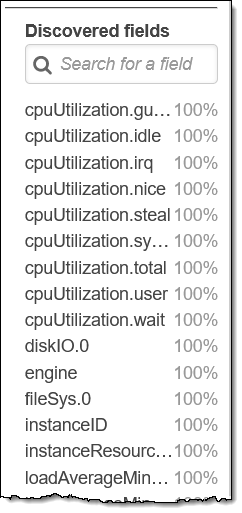
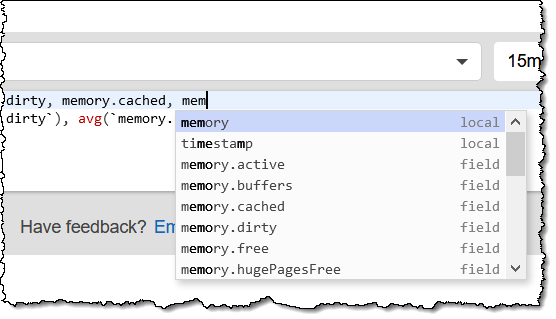
CloudWatch Logs Insights discovers all of the fields in the events and tells me how common they are in the selected log:
I can use this to build my queries interactively:
For queries that do not do any aggregation, I can expand an event and see all of the fields:
The query language supports six types of commands:
fields – Retrieves one or more log fields. It can also make use of functions such as abs, sqrt, strlen, trim, and more.
filter – Retrieves log fields based on one or more conditions built from Boolean operators, comparison operators, and regular expressions.
stats – Calculates aggregate statistics such as sum, avg, count, min, max, and percentile for a log field, across a given time interval (specified using the optional by modifier).
sort – Sorts logs events in ascending or descending order.
limit – Limits the number of log events returned by a query.
parse – Extracts data from a log field, creating one or more ephemeral fields that can be further processed by the query.
The language also supports a rich set of arithmetic & comparison operators, numeric functions, string functions, date/time functions, and aggregation functions.
As usual, I have shown you a fairly simply subset of the functionality and power that is available to you. Here are a couple of things that you can try on your own:
Add to Dashboard – After you have created an insightful query, click Add to Dashboard, then select an existing dashboard or create a new one:

Copy Query Results – After your have used CloudWatch Logs Insights to discover an issue, click the Action menu and choose Copy query results:
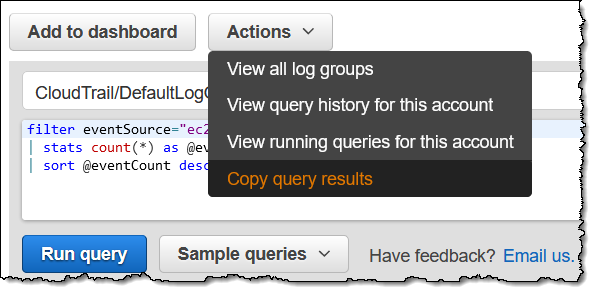
Then you can paste the results into your ticketing system for resolution.
API and CLI Access – In addition to console access, this feature is accessible via the AWS Command Line Interface (AWS CLI) and the AWS SDKs.
CloudWatch Integration – You can write a bit of glue code to run queries, use the results to publish Custom Metrics. Then you can visualize them, set alarms, and so forth, all with the goal of simplifying and accelerating your troubleshooting.
Available Now
CloudWatch Logs Insights is available now in the US East (N. Virginia), US East (Ohio), US West (N. California), US West (Oregon), Canada (Central), Europe (Ireland), Europe (Frankfurt), Europe (London), Europe (Paris), Asia Pacific (Tokyo), Asia Pacific (Mumbai), Asia Pacific (Seoul), Asia Pacific (Sydney), and South America (São Paulo) Regions and you can start using it today.
Pricing is based on the amount of ingested log data scanned for each query; you pay $0.005 per GB in US East (N. Virginia), with similar prices in the other regions.