AWS Big Data Blog
Analyze Anthropic usage, spend, and access with AWS Glue, Amazon S3 Tables, and AWS Quick
Finance teams want to allocate AI spend to the business units that use it. Engineering leaders want to know what that spend delivers. Security teams want to know who owns each API key and whether any belong to former employees. Anthropic gives administrators detailed visibility into usage and cost through Claude Code usage analytics and the Anthropic Admin API. Many enterprises want to take the next step and analyze that data alongside the business data they already manage in AWS. Until now that has meant building and maintaining a custom integration with the Admin API.
AWS Glue now offers a native connector for Anthropic. AWS Glue is a serverless data integration service that helps you discover, prepare, move, and integrate data from multiple sources for analytics, artificial intelligence and machine learning (AI/ML), and application development. The connector for Anthropic is one of 100 new native connectors that AWS Glue added for popular software as a service (SaaS) applications. It works like other AWS Glue connectors and requires no custom code. You store an Anthropic API key in AWS Secrets Manager and create an AWS Glue connection that references it. The connector handles the API calls and schema mapping for you so your team can focus on analyzing the data instead of maintaining the integration.
The connector makes AI usage another domain in your data lakehouse. With Amazon S3 Tables, fully managed Apache Iceberg tables in Amazon Simple Storage Service (Amazon S3), you can store your transformed Anthropic and business data in an open and interoperable format that AWS analytics services can read natively and other Iceberg engines can query.
In this post, we follow the fictional retailer AnyCompany Retail as it brings Anthropic data into Amazon S3 Tables and joins it with its own business data using AWS Glue materialized views stored as Apache Iceberg tables. The team uses Amazon Athena to query the data with SQL and answer leadership’s three questions about spend, value, and API key ownership. It then publishes the results to an AWS Quick dashboard that leadership reviews every week.
Solution overview
The following diagram shows the solution architecture.
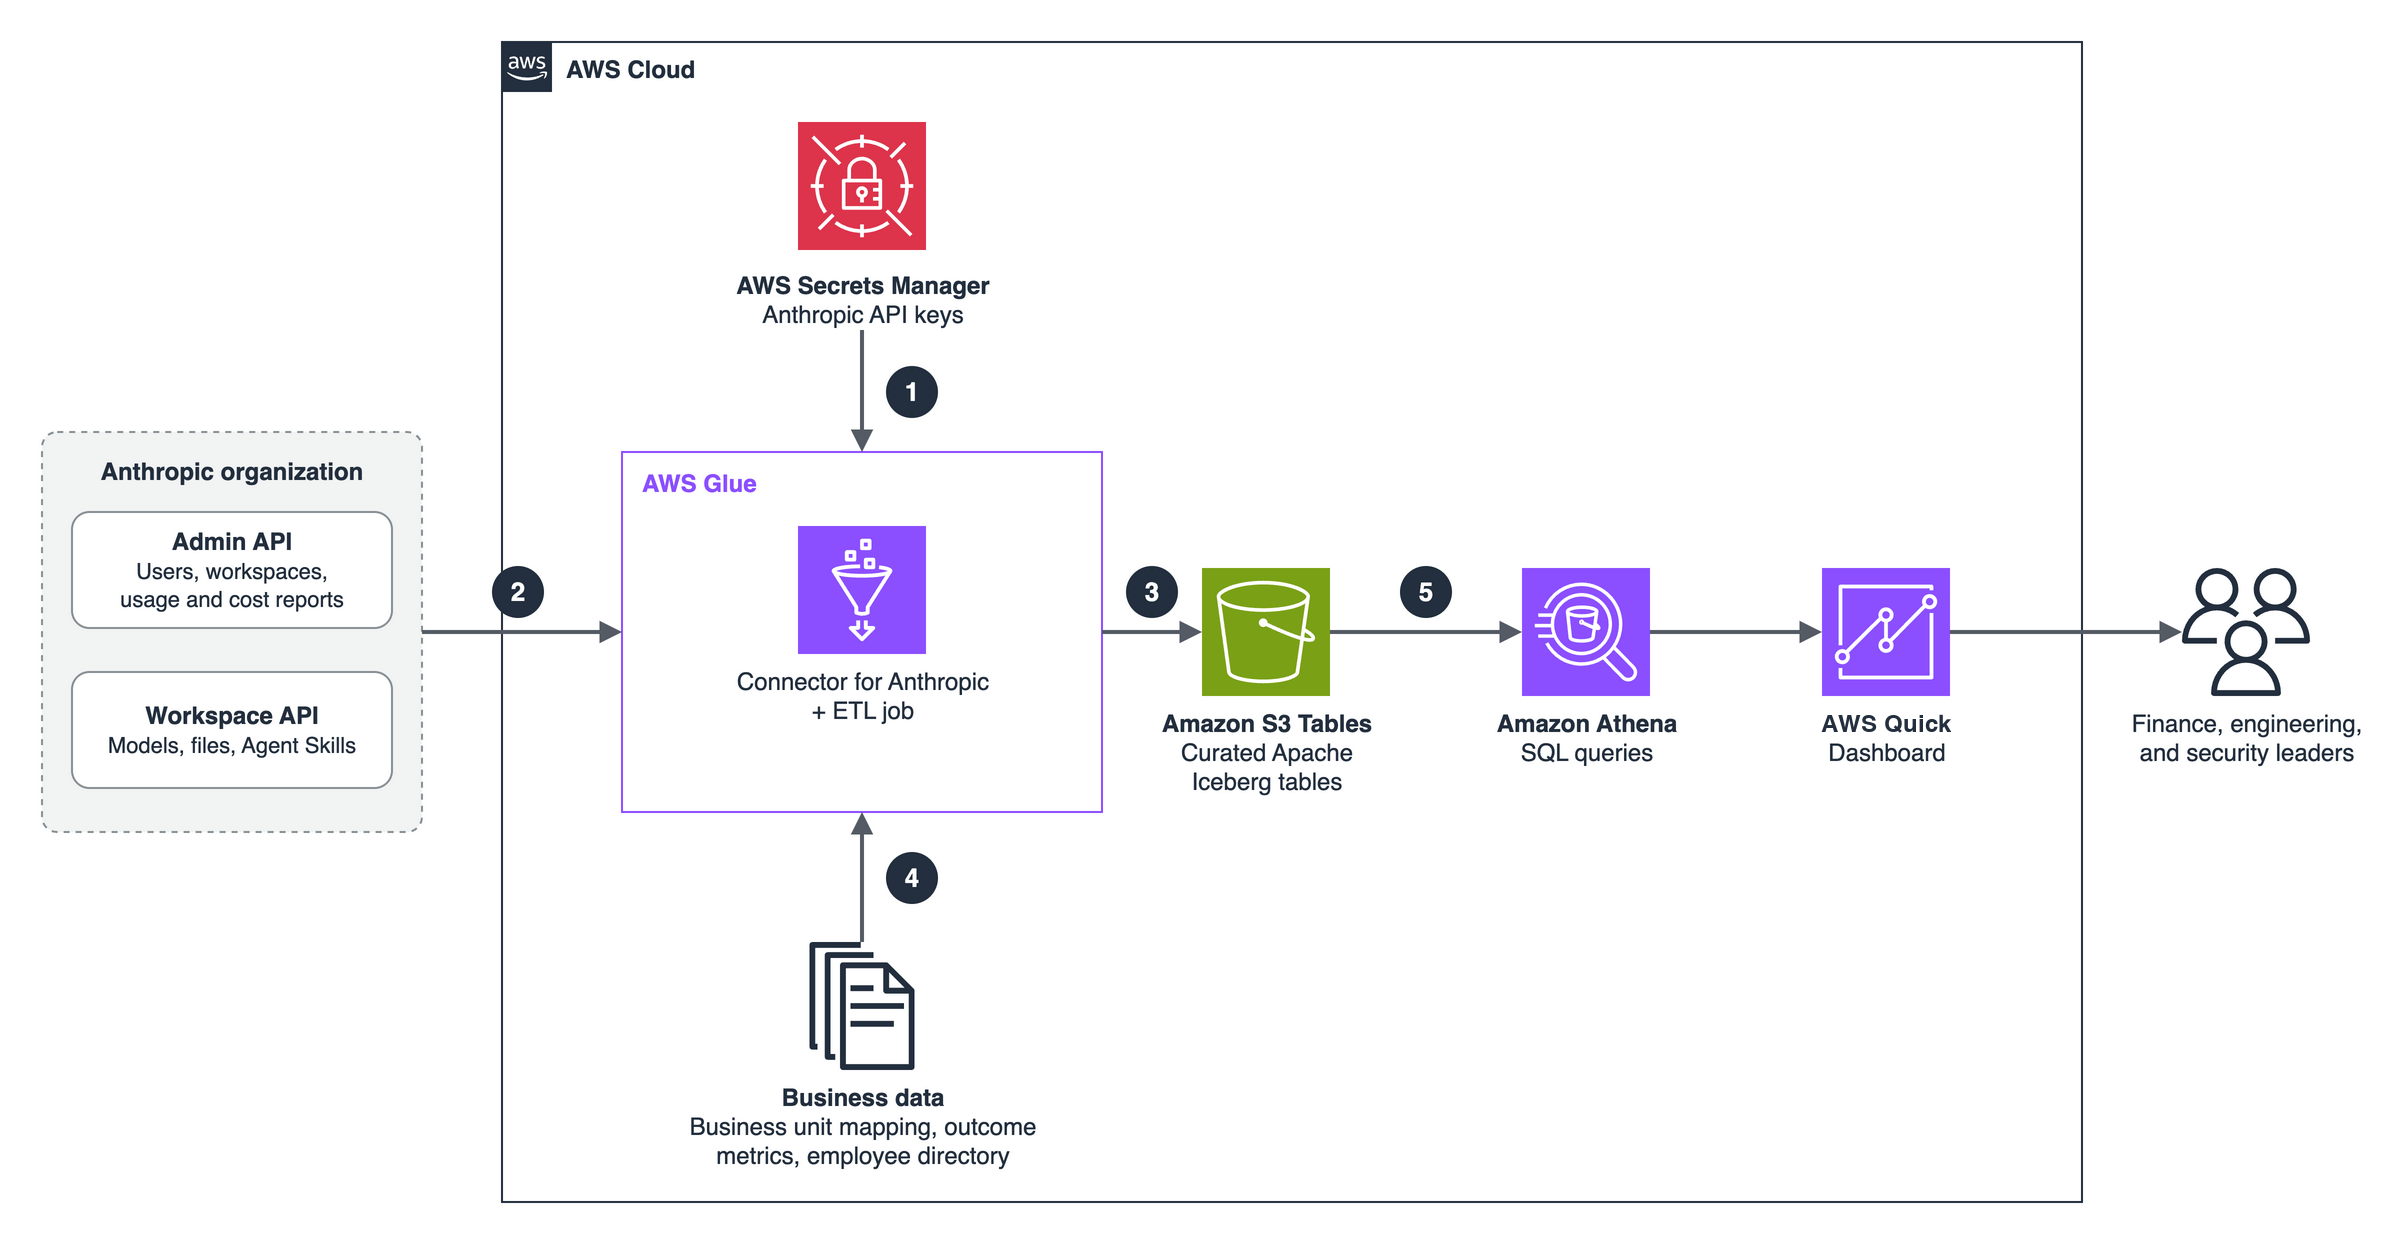
Figure 1: Solution architecture for analyzing Anthropic usage data with AWS Glue, Amazon S3 Tables, Amazon Athena, and AWS Quick
The workflow consists of the following steps:
- You store your Anthropic API keys in AWS Secrets Manager, where the AWS Glue connection references them.
- An AWS Glue extract, transform, and load (ETL) job uses the Glue connector for Anthropic to read entities such as usage and cost reports, users, and workspaces.
- The job transforms the data into fact and dimension tables like daily usage, daily cost, and writes them to Amazon S3 Tables as Apache Iceberg tables.
- The job joins the Anthropic data with business data that you own like workspace-to-business-unit mapping, outcome metrics, and an employee directory. In our example, this data is stored in Amazon S3.
- Amazon Athena queries the tables to answer the spend, value, and access questions, and AWS Quick presents the results through natural language prompting or dashboards.
Supported entities
Anthropic uses two kinds of API keys, and each provides access to different sets of data. An Admin API key reads organization-level data. A workspace API key reads data inside a single workspace. You create one AWS Glue connection for each key.
| Entity | API key | Description |
users |
Admin | Organization members with their email, name, and role |
invites |
Admin | Pending and accepted organization invites |
workspaces |
Admin | Workspaces in the organization, including the default and archived workspaces |
workspace_members |
Admin | Members of each workspace with their workspace role |
api_keys |
Admin | API keys with status, scope, workspace, and creator |
usage_report |
Admin | Token usage per time bucket, optionally grouped by workspace, API key, model, and more |
cost_report |
Admin | Cost per daily bucket, optionally grouped by workspace and cost description |
models |
Workspace | Claude models available to the workspace |
message_batches |
Workspace | Message Batches API jobs with status and request counts |
files |
Workspace | Files uploaded to the workspace |
Example scenario
The retailer uses Claude across five business units, each with its own Anthropic workspace: Customer Service, Engineering, Document Processing, Marketing, and Data Science. Every week, leadership reviews AI spend across the business units and asks three questions:
- Which business units are driving AI spend?
- Is the spend paying off, for example in cost per resolved customer case?
- Are any active API keys owned by employees who have left the company?
Throughout this post, the Anthropic data comes from a demo organization. The reference datasets (business-unit mapping, support outcomes, and employee directory) are illustrative samples.
Prerequisites
To follow along, you need the following:
- An Anthropic organization (Admin API features aren’t available for individual accounts).
- An Anthropic Admin API key, created by an organization admin.
- A workspace API key for each workspace you want to analyze.
- An AWS account with AWS Identity and Access Management (IAM) permissions to use AWS Glue, Amazon Athena, Amazon S3, Amazon S3 Tables, AWS Secrets Manager, and AWS Quick.
- An IAM role for AWS Glue with access to the secrets, your S3 bucket, and your S3 table bucket (see Part 2).
- An S3 bucket for job scripts and reference data.
Part 1: Set up the AWS Glue connector for Anthropic
In this part, you store your Anthropic API keys in AWS Secrets Manager and create the AWS Glue connections that read your organization’s data.
Store your Anthropic API keys
Store each API key in AWS Secrets Manager as a secret with the key apiKey:
Create one secret for the Admin API key and one for each workspace API key you plan to use.
- Open AWS Secrets Manager.
- Choose Store a new secret and enter your API key.
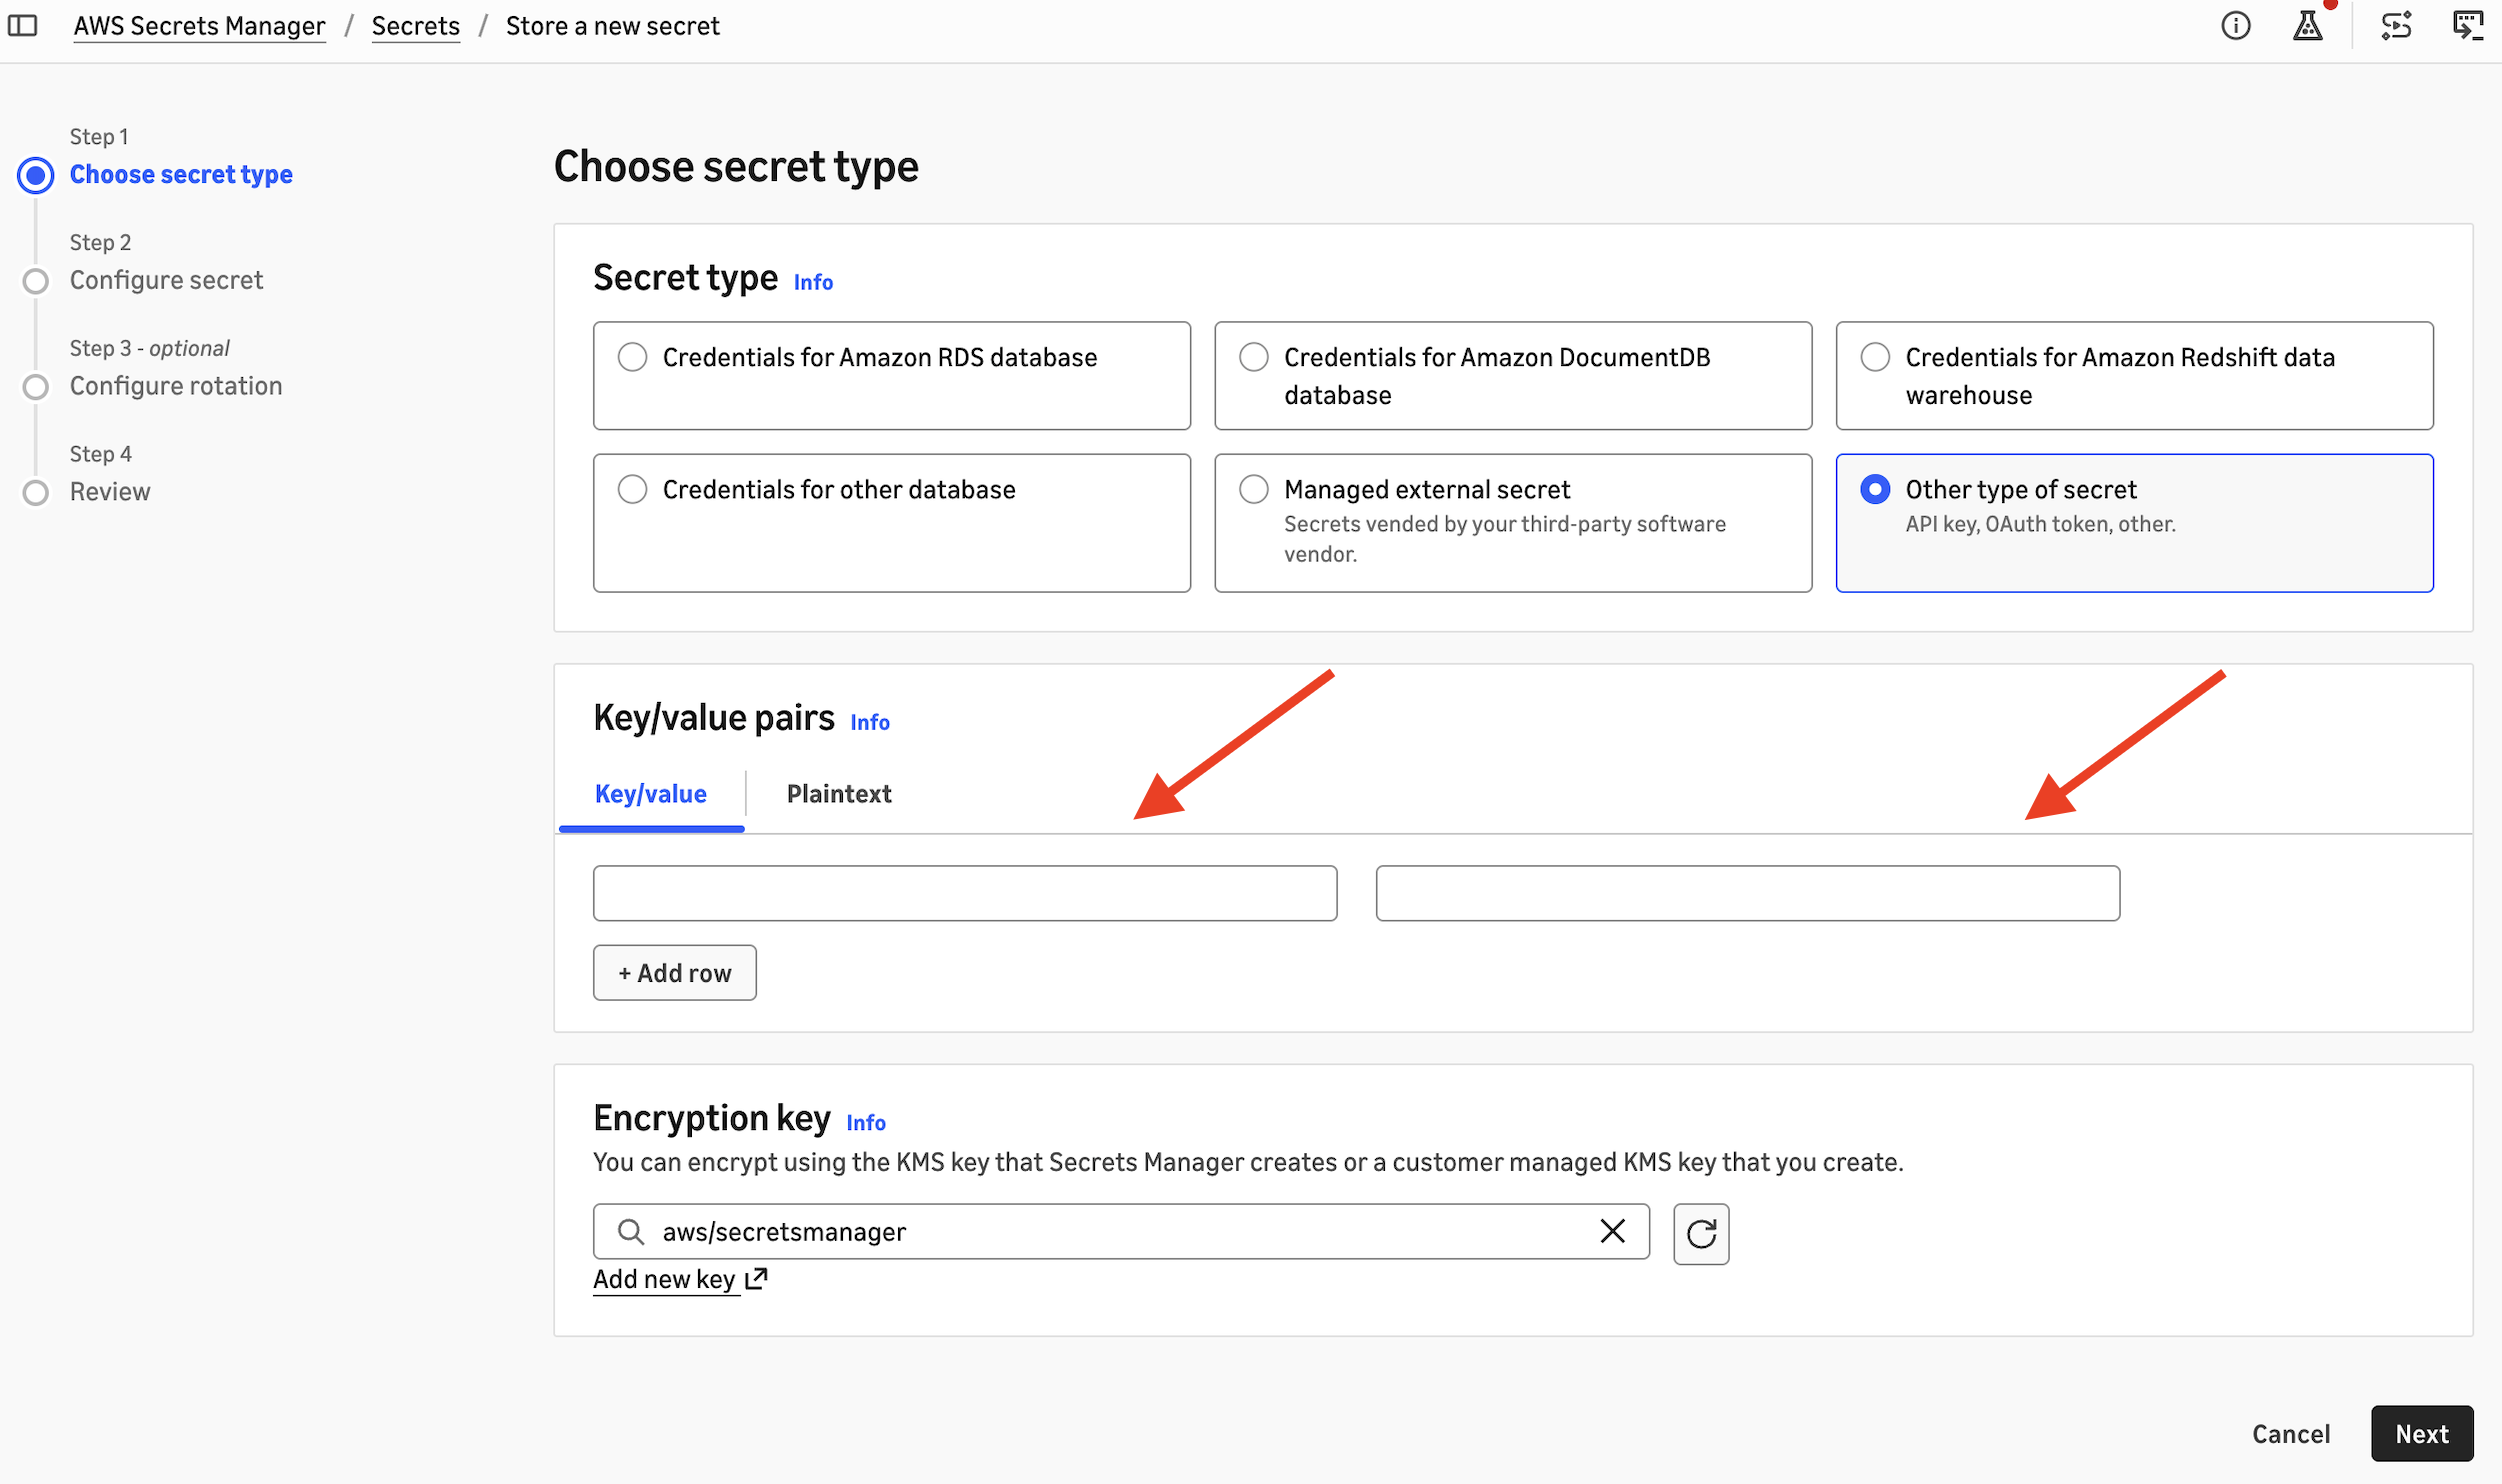
Figure 2: Storing an Anthropic API key in AWS Secrets Manager
- Choose Next and name your new secret.
- Optionally, configure automatic rotation.
- Afterwards, choose Next and then Store.
Create the connections
- On the AWS Glue console, choose Data connections, then Create connection.
- For Data source, choose Anthropic.
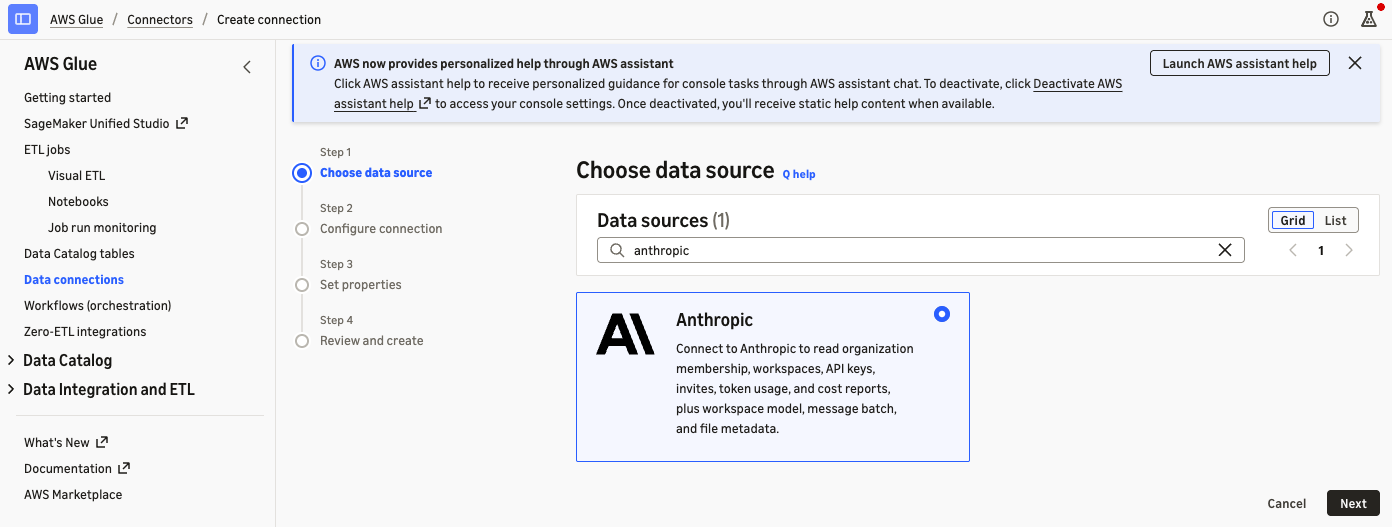
Figure 3: Choosing Anthropic as the data source in AWS Glue
- For Authentication, choose the secret that contains your Admin API key.
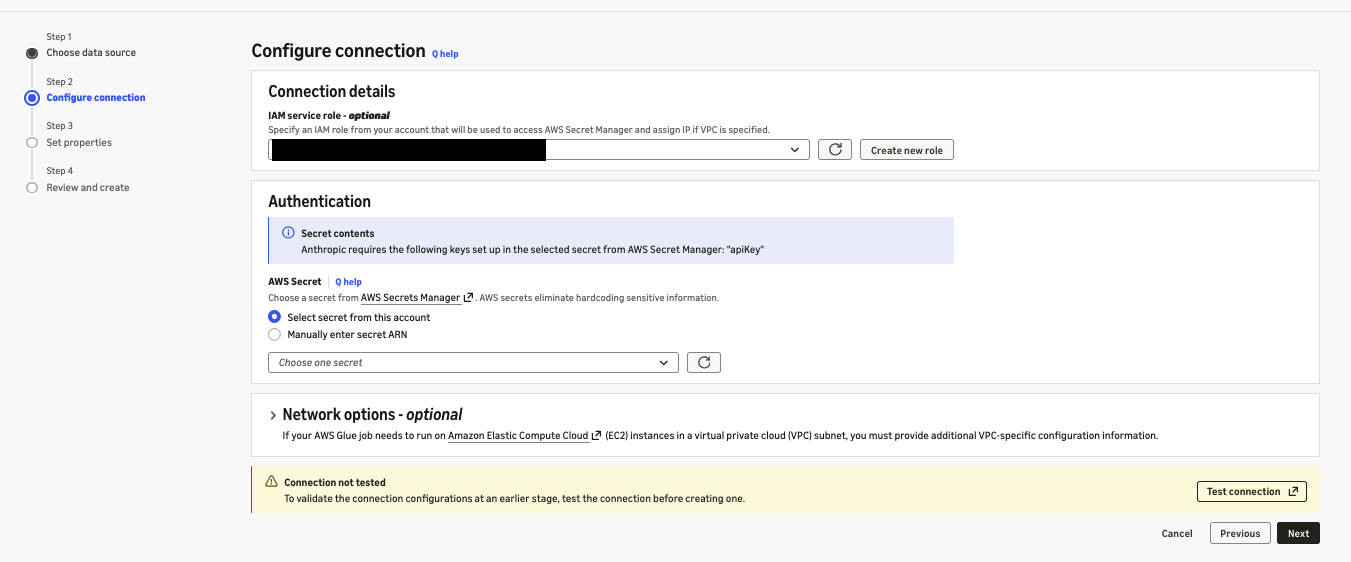
Figure 4: Selecting the secret that holds the Admin API key
- Name the connection, for example
anthropic-admin, and create it. - Repeat the steps with a workspace API key to create a second connection, for example
anthropic-workspace.
After you create a connection, choose Test connection to validate the API key. Both Admin and workspace API keys can be validated.
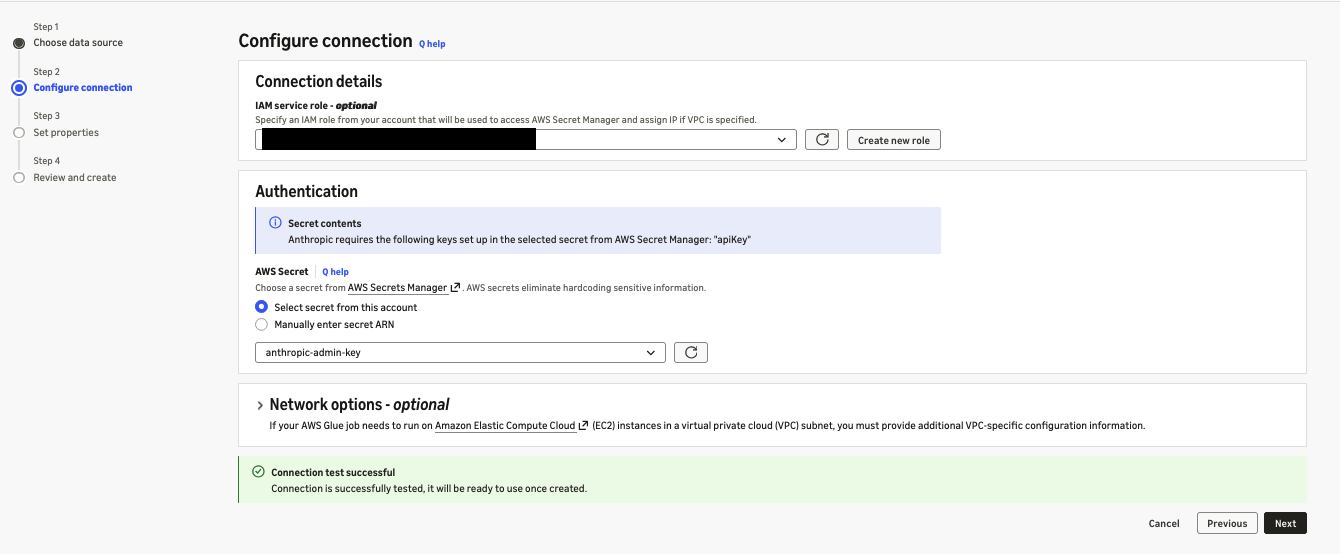
Figure 5: Validating an Anthropic connection with Test connection
Explore and preview data
In the AWS Glue console, you can browse the entities that each connection exposes and preview records and the schema for all the data available through the AWS Glue connector for Anthropic. The following screenshot showcases synthetic data.
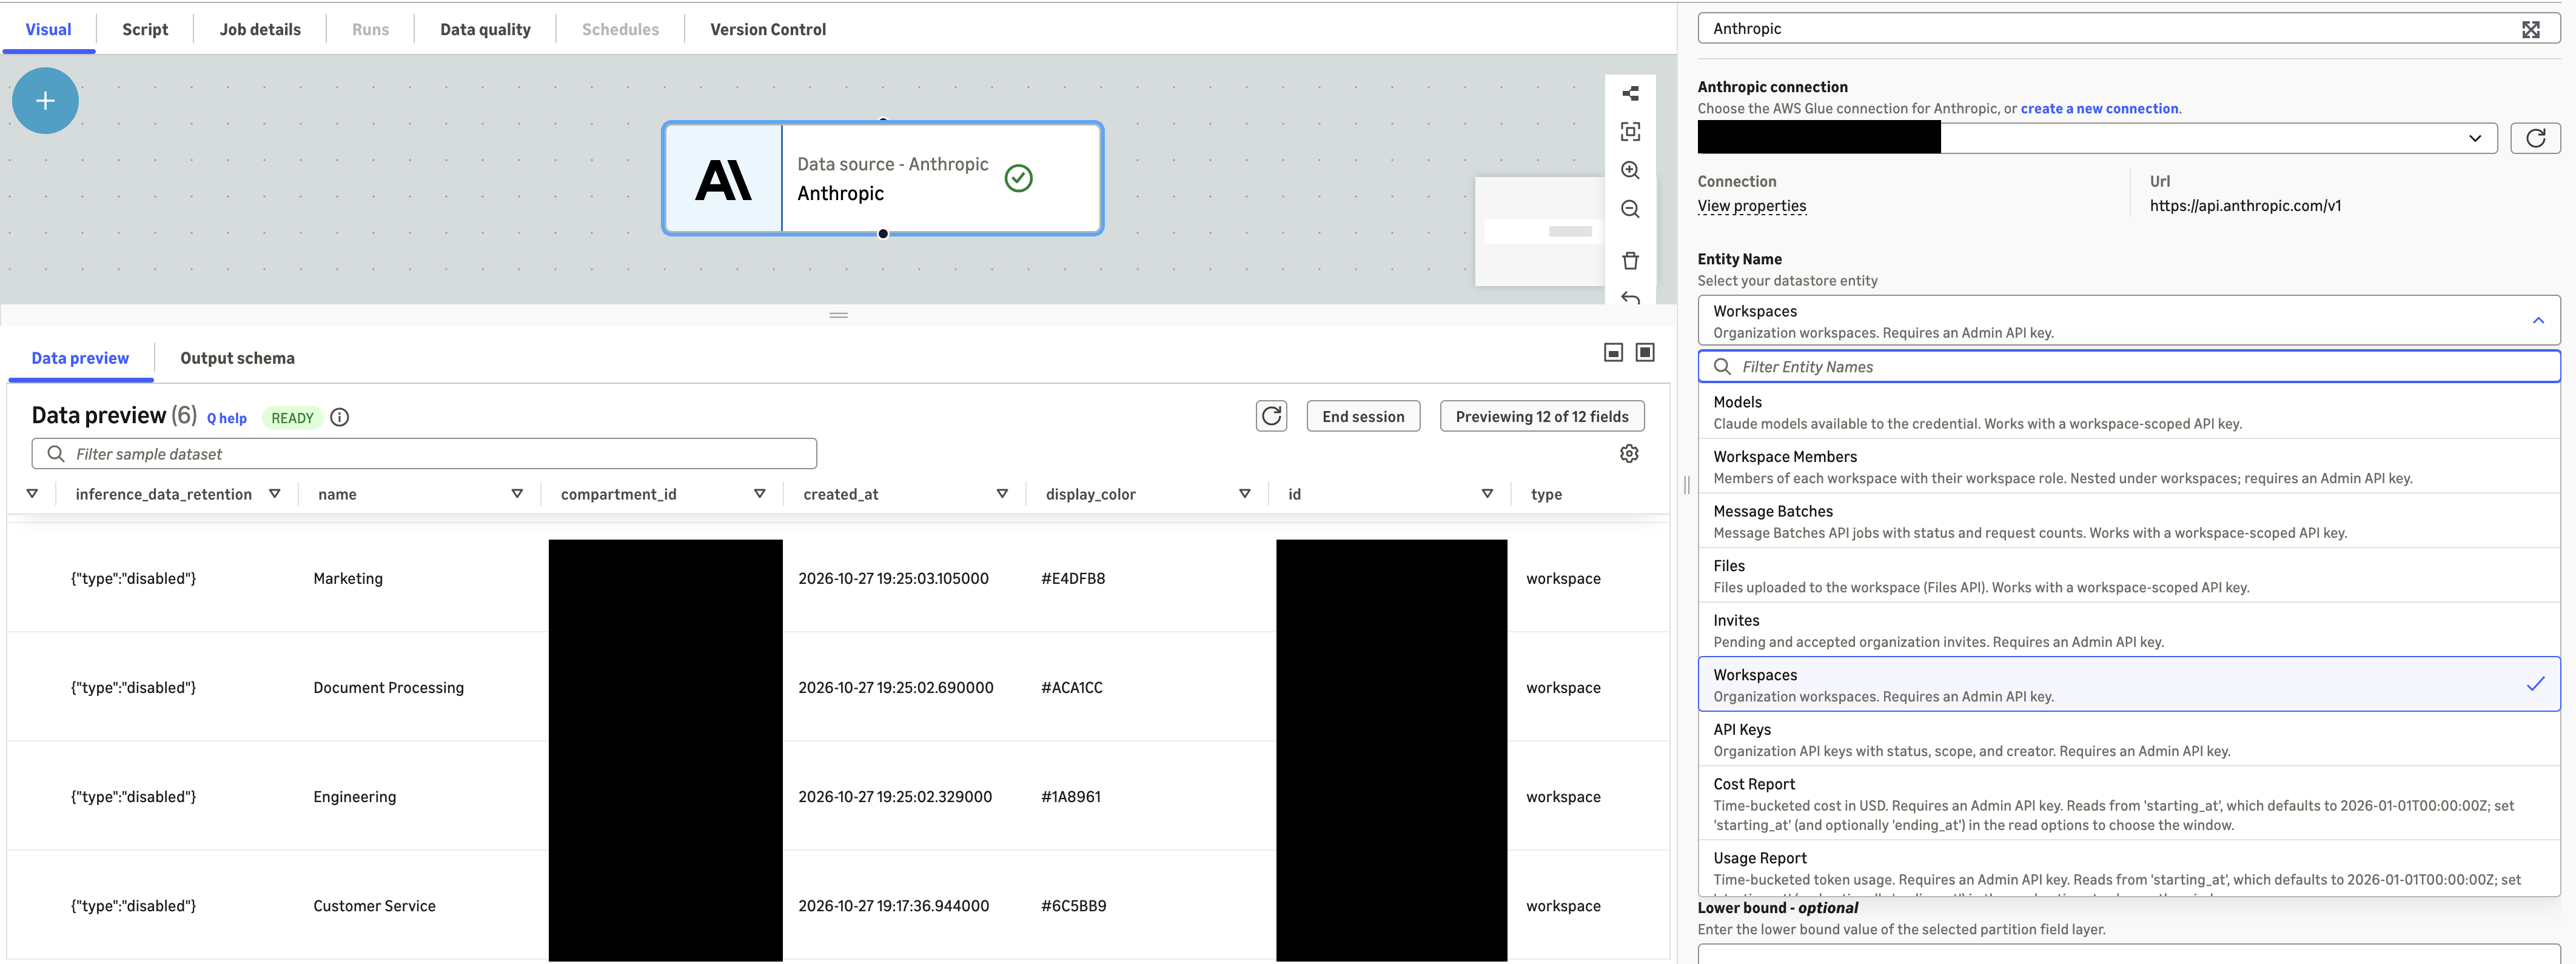
Figure 6: Previewing Anthropic entities and schema in the AWS Glue console
Part 2: Build an AI usage lakehouse with Amazon S3 Tables and AWS Glue materialized views
In this part, you turn the Anthropic data from Part 1 into answers to leadership’s three questions. An AWS Glue ETL job reads Anthropic data through the connector, combines it with your business data, and writes Apache Iceberg tables to Amazon S3 Tables. A second AWS Glue job maintains AWS Glue materialized views in the AWS Glue Data Catalog, one for each question, and you query the views with Amazon Athena.
The table bucket organizes the data in four namespaces:
| Namespace | Contents | Written by |
raw |
Anthropic entities, as the connector returns them | ETL job |
reference |
Business data that you own, loaded from CSV files in Amazon S3 | ETL job |
curated |
Daily fact tables and dimension tables, built from the raw data | ETL job |
mart |
Materialized views, one for each business question | Materialized view job |
To build the pipeline, you complete the following steps.
Create the table bucket and namespaces
Create a table bucket, and then create one namespace for each layer:
On the Amazon S3 console, choose Table buckets and enable Integration with AWS analytics services. The integration adds your table buckets to the AWS Glue Data Catalog under the s3tablescatalog catalog, so AWS Glue and Athena can address this bucket as s3tablescatalog/amzn-s3-demo-table-bucket. This walkthrough uses IAM access control for the integration.
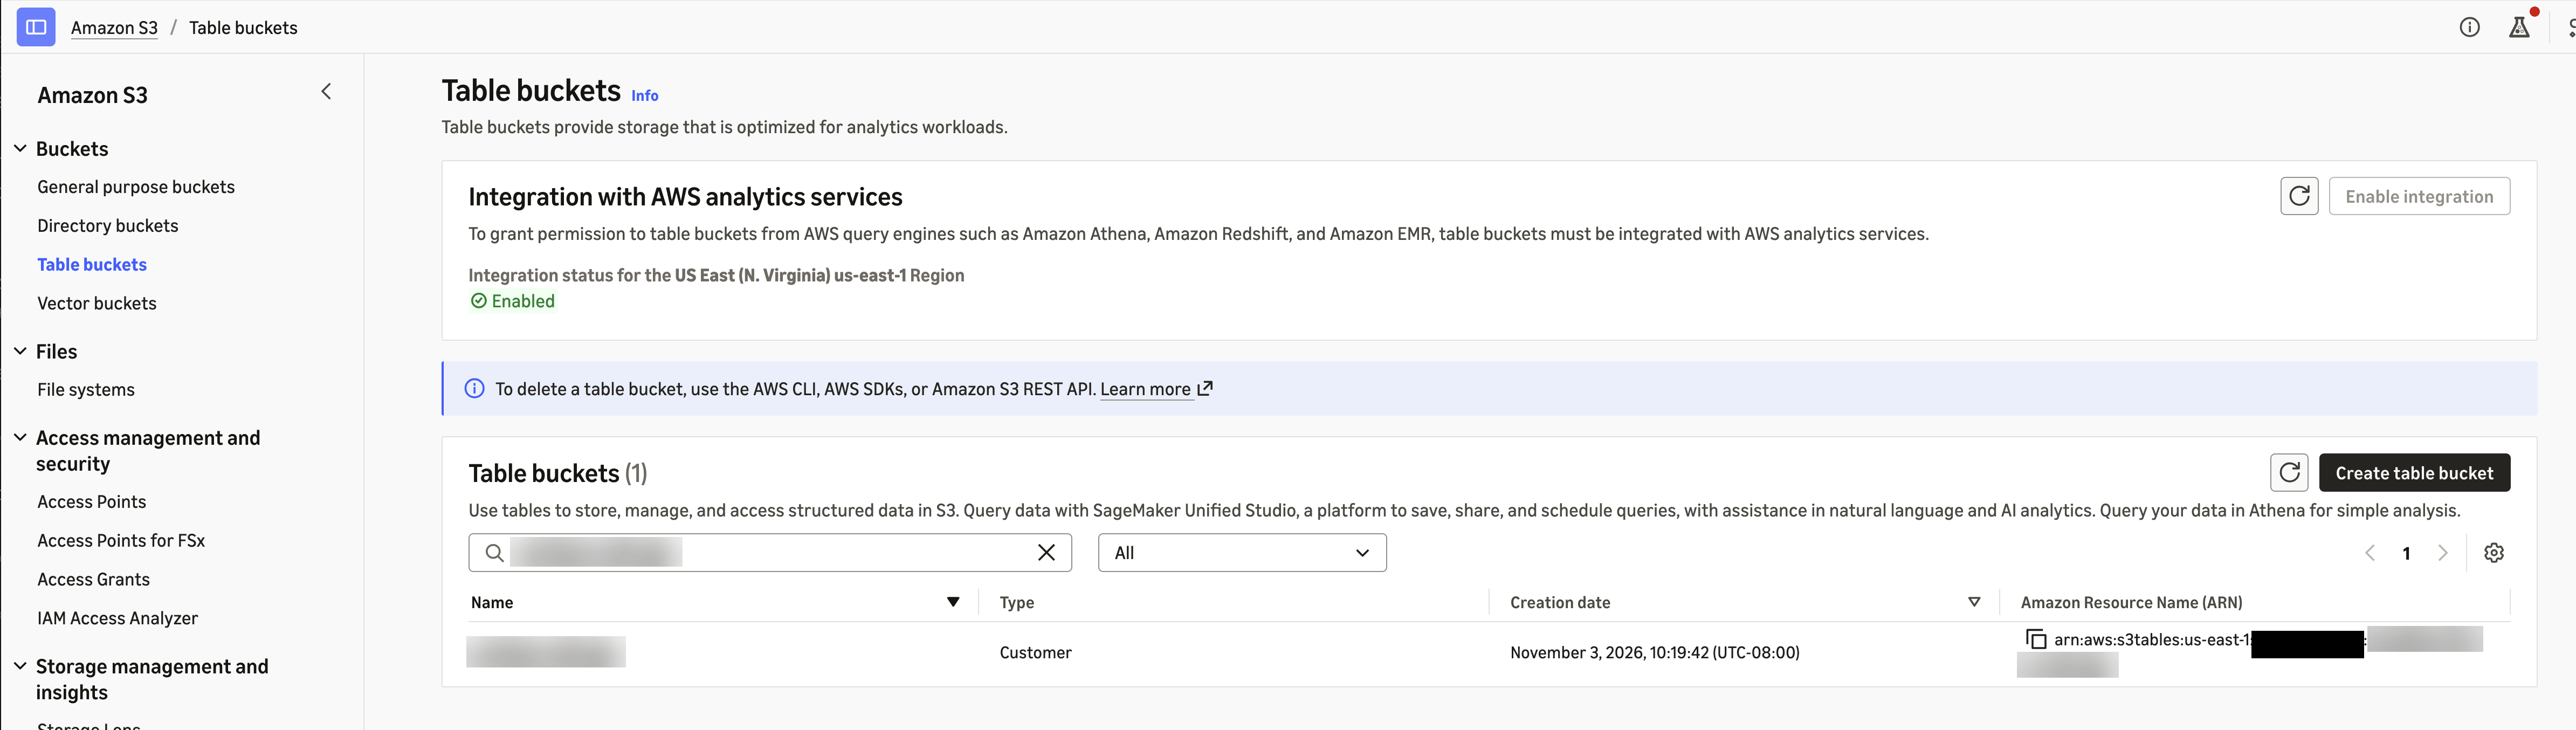
Figure 7: Turning on AWS analytics integration for the table bucket
Upload your business data to Amazon S3
Anthropic data shows what each workspace and API key spends. It doesn’t show which business unit owns a workspace, what the spend produced, or whether the creator of a key still works at the company. That context lives in your own systems, so you create these datasets from your organization’s data. The datasets you need depend on the questions you want to answer. This post uses the following three sample datasets:
| Dataset | Columns | Example row |
workspace_business_unit |
workspace_name, business_unit |
Customer Service, Customer Service |
support_outcomes_daily |
outcome_date, business_unit, conversations, completed_resolutions, qa_score_pct |
2026-10-30, Customer Service, 1216, 990, 96 |
hr_directory |
email, employment_status (active or departed) |
jane.doe@example.com, departed |
Save each dataset as a CSV file with a header row. In your S3 bucket, upload each file to its own folder under a common prefix, and name each folder after its dataset:
The ETL job reads each folder and loads it into a table with the same name in the reference namespace.
Note: If your datasets or columns differ, update REFERENCE_DATASETS in the ETL script and the materialized view definitions to match.
Grant the AWS Glue role access
Both jobs use the IAM role for AWS Glue from the prerequisites. Make sure that the role can do the following:
- Read the Secrets Manager secrets that store your Anthropic API keys.
- Read the job scripts and reference data in your S3 bucket.
- Read and write the table bucket and its tables in the AWS Glue Data Catalog, as described in Amazon S3 Tables integration with AWS analytics services.
- Pass itself to AWS Glue. Grant iam:PassRole on the role’s own ARN for glue.amazonaws.com, because AWS Glue stores the role with each materialized view and uses it to refresh the view.
Review the ETL script
The ETL job runs the script anthropic_usage_etl.py. Download anthropic_usage_etl.py and save it on your computer. You upload it when you create the AWS Glue job in a later step.
On each run, the script does the following:
- Reads the cost report, usage report, users, workspaces, and API keys through the Admin connection, and message batches and files through any workspace connections that you list. It writes this data unchanged to the raw namespace.
- Reads your business data from the Amazon S3 location in the
--reference_data_pathjob parameter and writes it to the reference namespace. - Flattens the usage and cost reports into daily fact tables, converts cost from cents to US dollars, and builds tables of API keys, users, and workspaces in the curated namespace.
- Creates any table that doesn’t exist yet and adds columns when the source data gains new fields, so you don’t need to create tables in advance.
The following snippets show three important parts of the script: how it reads data through the connector, how it builds the curated tables, and how it loads new data incrementally.
Read Anthropic data through the connector
The connector reads data directly into Apache Spark DataFrames through CatalogConnectionHelper, a helper library included with AWS Glue. You pass the connection type, the AWS Glue connection name, and the read options. For every read option and the fields that support filter pushdown, see Anthropic connection options. The following example reads the cost report from October 1, grouped by workspace and cost description:
read_report builds the filter predicate from the start date and group_by dimensions, and keeps the report columns that the job uses. The result is a Spark DataFrame, so you can use it with standard Spark transformations without converting it. The job reads cost_report and usage_report with read_report and users, workspaces, and api_keys with read_entity.
Workspace entities, such as message_batches and files, need a workspace API key, so the job reads them through each workspace connection that you list in the --workspace_connections job parameter. The job writes everything that it reads, unchanged, to the raw namespace.
Build the curated tables
The connector returns the cost report as one record per day. That record holds all of the day’s cost lines in a single field, results, as a JSON array. To analyze individual cost lines, the job parses results with a schema for the cost line fields (COST_LINE_SCHEMA) and expands the array, so that each cost line becomes its own row. Anthropic reports cost amounts in cents, so the job converts them to US dollars. Anthropic also reports activity in the Default workspace with an empty workspace_id, so the job fills in the Default workspace ID:
The job also parses nested fields such as the API key creator, scope, and principal. It writes the following tables to the curated namespace:
| Table | Contents |
fact_usage_daily |
Token usage per day, workspace, API key, and model |
fact_cost_daily |
Cost in US dollars per day, workspace, and cost line |
dim_api_key |
API keys with status, workspace, creator, and key type (linked to a user, service account, or legacy) |
dim_user, dim_workspace |
Organization members and workspaces |
Load new data incrementally
The first run loads all data from the date in the --start_date job parameter. Later runs re-read only the last three days, because daily buckets close after midnight UTC and recent days can still change. The job merges those days into the fact tables, so a rerun updates rows instead of duplicating them:
The dimension and reference tables are small, so the job replaces them on every run.
Review the materialized view script
The materialized view job runs the script anthropic_usage_mvs.py. Download anthropic_usage_mvs.py and save it on your computer.
The curated tables hold clean usage, cost, and access data, but each leadership question needs joins across several of them and your business data. Instead of repeating those joins in every query and dashboard, the script saves each answer as a materialized view in the mart namespace. A materialized view stores the result of a query as an Iceberg table. When its base tables change, a refresh updates the view, incrementally where possible, instead of recomputing the whole query. Athena and AWS Quick then read the precomputed results, so everyone works from the same numbers.
On each run, the script creates any view that doesn’t exist yet and refreshes the rest. It maintains one view for each leadership question:
| View | Built from | Answers |
weekly_spend_by_business_unit |
fact_cost_daily, dim_workspace, workspace_business_unit |
Which business units are driving AI spend? |
unit_cost |
fact_cost_daily, dim_workspace, workspace_business_unit, support_outcomes_daily |
Is the spend paying off? |
| access_review | dim_api_key, dim_user, dim_workspace, fact_usage_daily, hr_directory |
Are any active API keys owned by employees who have left? |
Add your own views
The script is extensible. Each view is one entry in the VIEWS dictionary: the key is the view name, and the value is the view’s SQL query. To answer a new question, add an entry. For example, the following entry adds a view of daily token usage by workspace and model:
The next run of the job creates the view, and later runs refresh it. To change the definition of an existing view, set the optional --recreate job parameter to the view name, for example tokens_by_model, for one run. The job drops the view and creates it again with the new definition.
Follow two rules when you write a view definition:
- Make definitions deterministic. Functions such as
current_date()aren’t allowed, so calculate those values at query time. - Use inline subqueries instead of a WITH clause. In our testing, views that used a
WITHclause could be created but failed to refresh.
Create the AWS Glue jobs
Create one AWS Glue job for each script. Both jobs connect to the table bucket with the same job parameter, so prepare its value first.
Prepare the table bucket configuration
The scripts read and write the table bucket through an Apache Spark catalog named s3tables. You configure the catalog with one job parameter, --conf. Copy the following value as a single line, and replace <account-id>, <region>, and amzn-s3-demo-table-bucket with your own values:
The value contains several Spark settings. AWS Glue accepts only one --conf parameter, so the settings are separated by --conf inside the value. With this configuration, the scripts refer to tables as s3tables.<namespace>.<table>, for example s3tables.curated.fact_cost_daily. For details about these settings, see Running ETL jobs on Amazon S3 tables with AWS Glue.
Create the ETL job
- On the AWS Glue console, choose ETL jobs, and then choose Script editor.
- For Engine, choose Spark. Choose Upload script, select
anthropic_usage_etl.py, and choose Create script. - On the Job details tab, for Name, enter
anthropic-usage-etl. For IAM Role, choose the role from the prerequisites. For Glue version, choose Glue 6.0. - Expand Advanced properties. Under Connections, choose the Admin connection and each workspace connection that you created in Part 1.
- Under Job parameters, choose Add new parameter and add each of the following keys and values:
| Key | Value | Purpose |
--datalake-formats |
iceberg |
Adds Apache Iceberg support to the job |
--conf |
The value that you prepared | Connects the job to the table bucket |
--admin_connection |
anthropic-admin |
Name of the Admin connection |
--workspace_connections |
{"anthropic-workspace": "Customer Service"} |
Optional. Maps each workspace connection to its workspace name. Without it, the job skips message_batches and files. |
--reference_data_path |
s3://<your-bucket>/<prefix>/ |
Location of your business data |
--start_date |
2026-10-01 |
First day to load on the first run |
- Choose Save.
Create the materialized view job
- On the AWS Glue console, choose ETL jobs, and then choose Script editor.
- For Engine, choose Spark. Choose Upload script, select
anthropic_usage_mvs.py, and choose Create script. - On the Job details tab, for Name, enter
anthropic-usage-mvs. For IAM Role, choose the same role. For Glue version, choose Glue 6.0 (AWS Glue materialized views require AWS Glue 5.1 or later). - Expand Advanced properties. Under Job parameters, add
--datalake-formatswith the valueiceberg, and--confwith the same value as the ETL job. This job reads only from the table bucket, so it doesn’t need connections or other parameters. - Choose Save.
For more information about job parameters, see Using job parameters in AWS Glue jobs.
Run and schedule the pipeline
On the ETL jobs page, run anthropic-usage-etl. After it succeeds, run anthropic-usage-mvs, which creates the views on its first run and refreshes them on later runs.
To keep the views current, create an AWS Glue workflow that runs the ETL job daily at 06:30 UTC, after Anthropic’s daily buckets close, and then runs the materialized view job. Alternatively, add SCHEDULE REFRESH EVERY 24 HOURS to each CREATE MATERIALIZED VIEW statement so that AWS Glue refreshes the views on a schedule, and schedule only the ETL job.
Answer the business questions with Amazon Athena
After you execute the following Glue scripts, in the Athena query editor, choose the catalog s3tablescatalog/amzn-s3-demo-table-bucket and the database mart. The results in this section come from the demo organization. The business datasets are samples.
Which business units are driving AI spend?
Is the spend paying off?
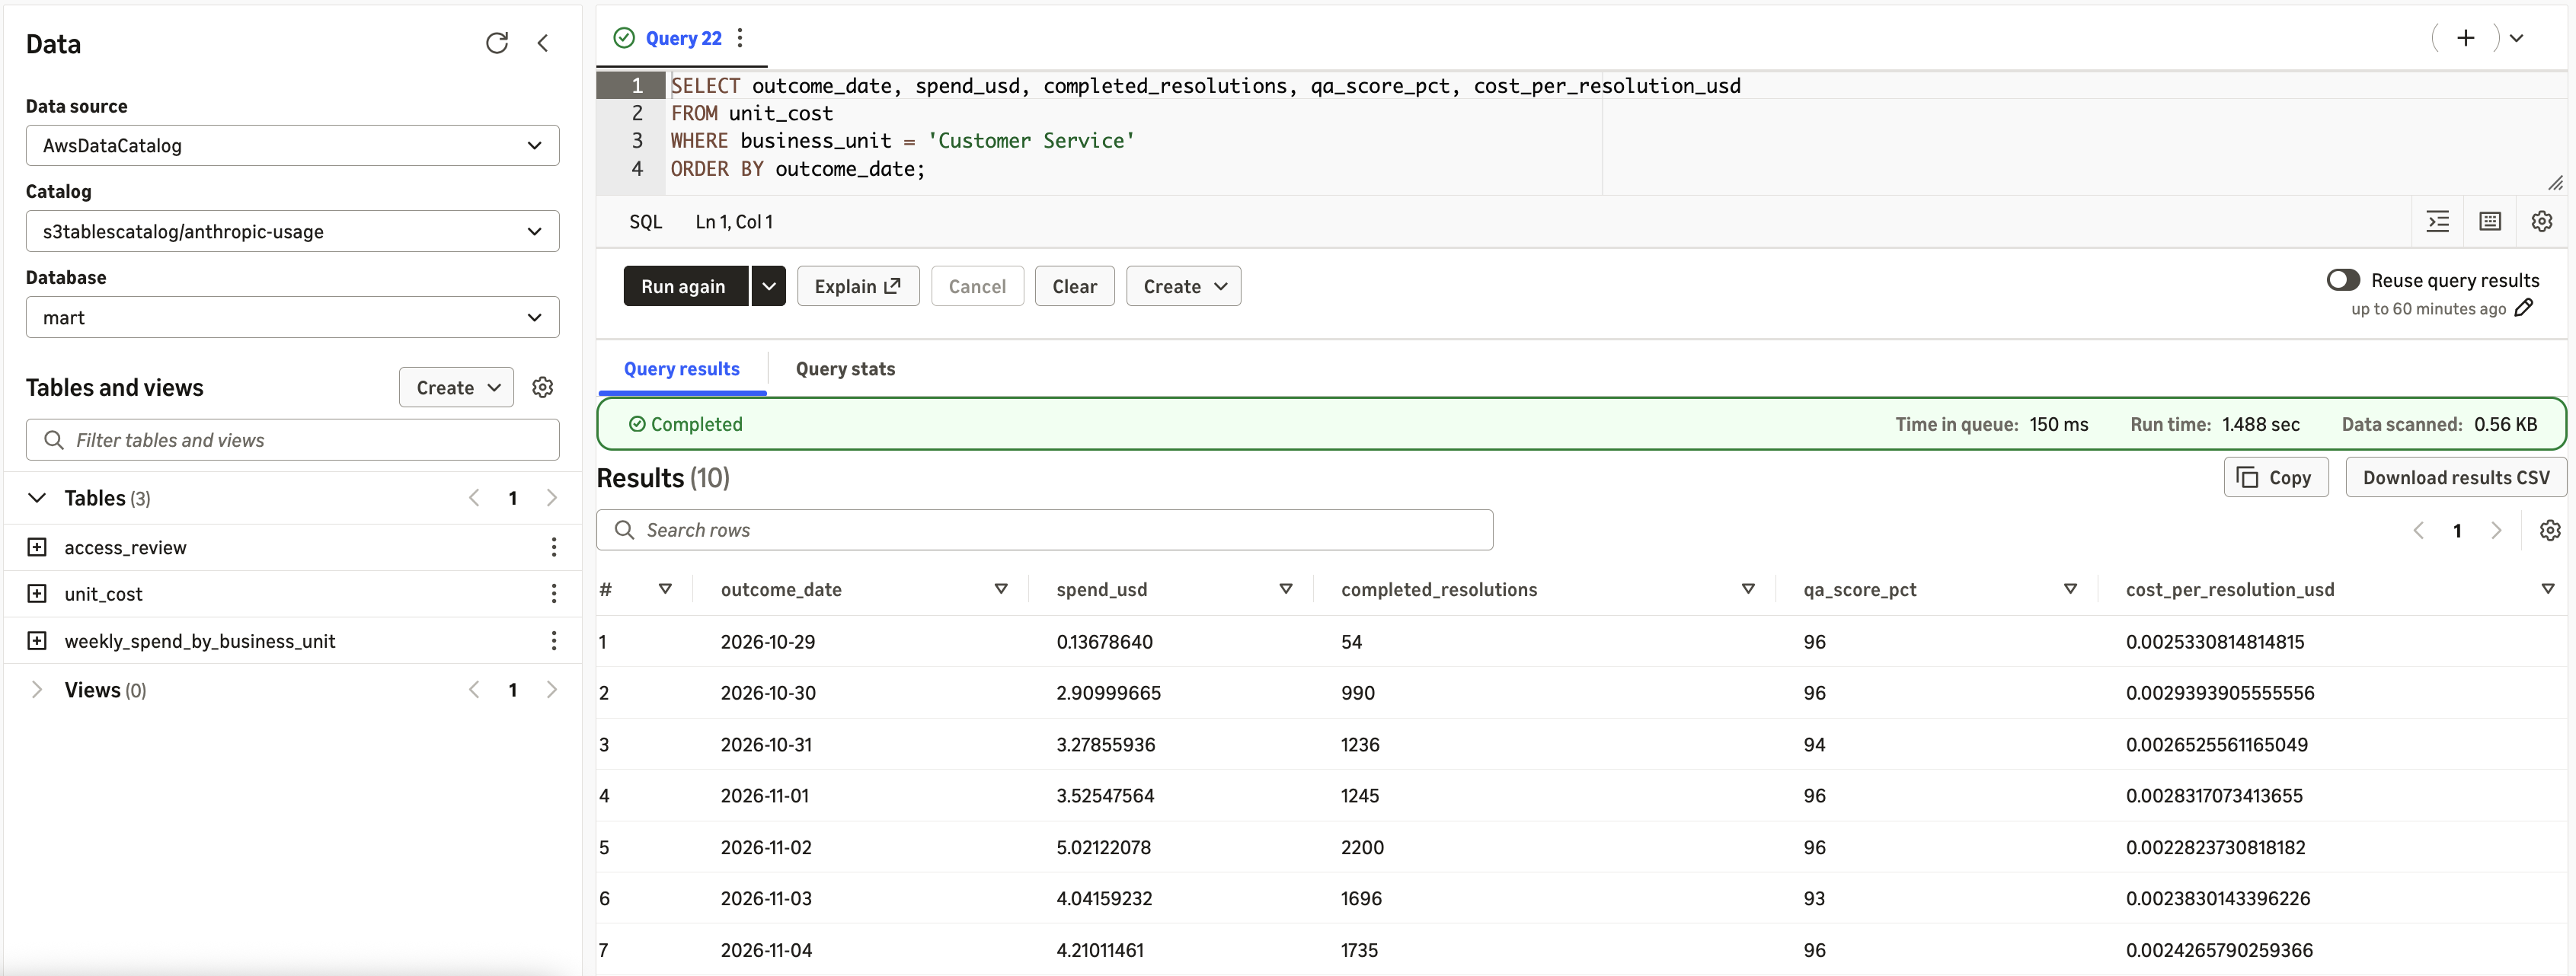
Figure 8: Cost per resolution over time for Customer Service
Are any active API keys owned by employees who have left?
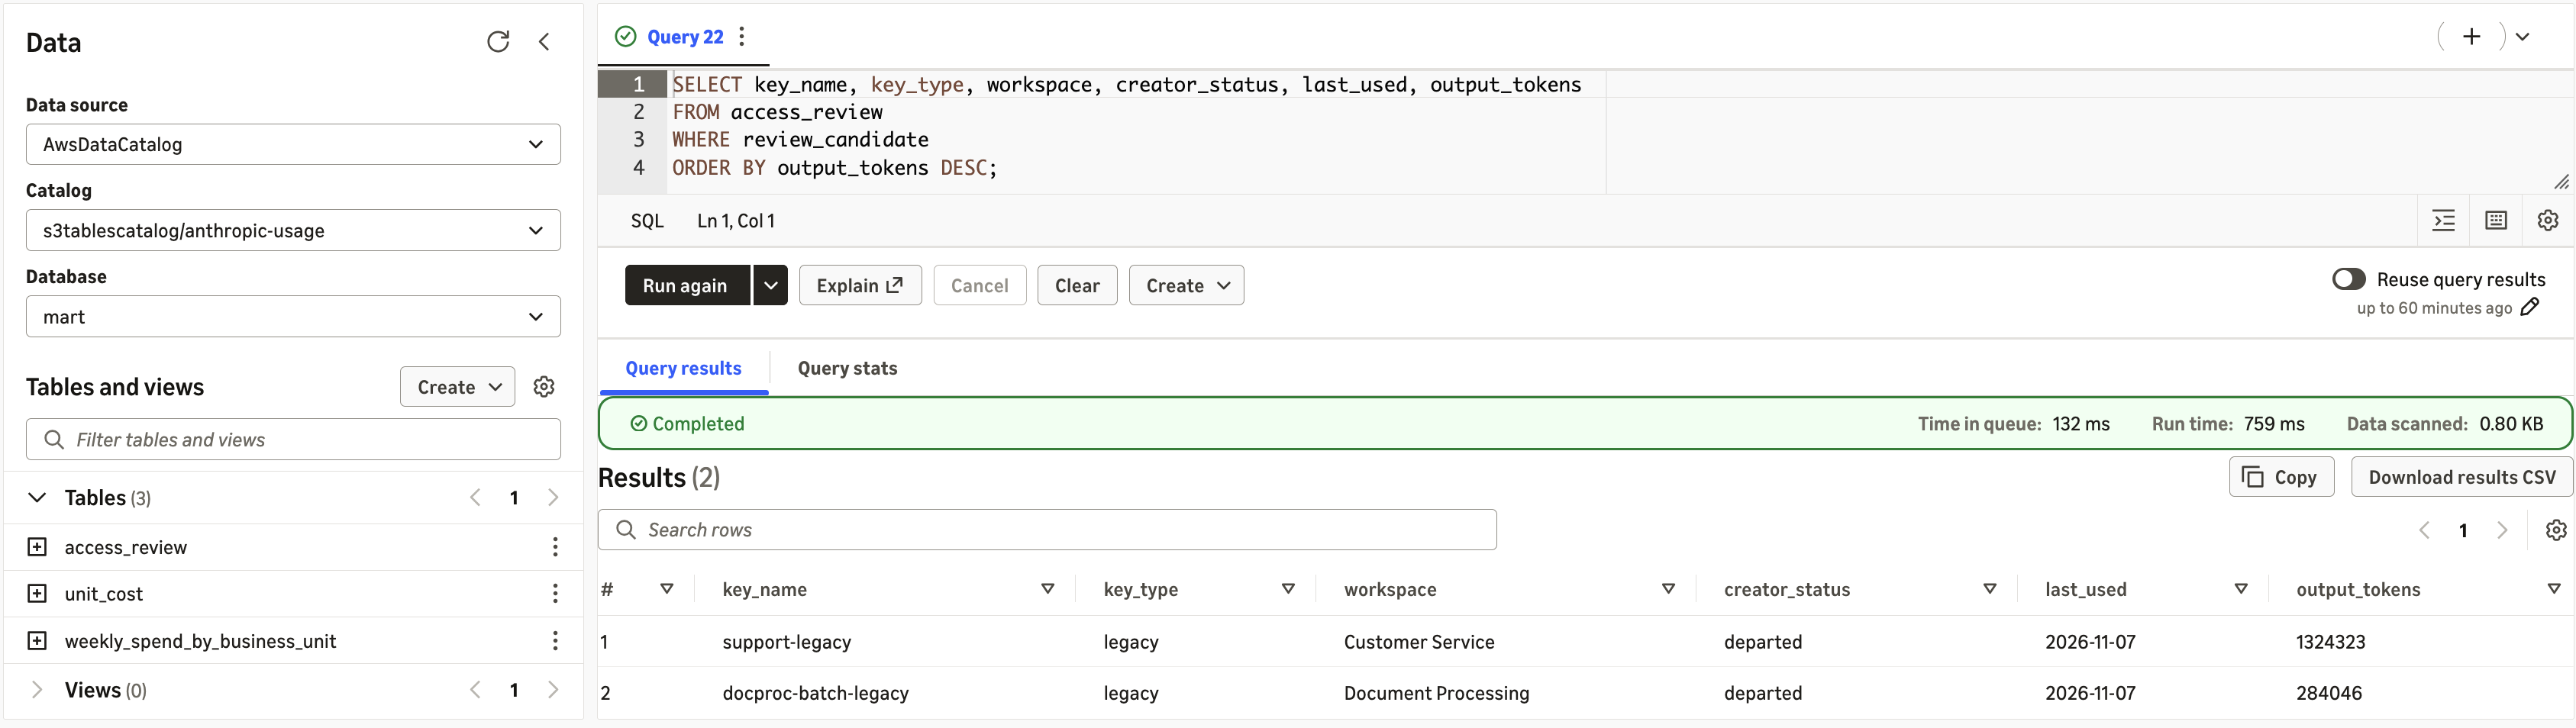
Figure 9: Active API keys owned by employees who have left
The query returns two keys, support-legacy in Customer Service and docproc-batch-legacy in Document Processing. Both are legacy keys, created by an employee who has since left, and both were used the previous day. A departed creator doesn’t mean that a key is misused. It identifies keys whose service ownership should be confirmed, for example by moving the workload to a service-account key, before the old key is disabled.
Part 3: Visualize AI spend and governance in AWS Quick
AWS Quick is a generative AI assistant for work. It helps employees find insights, conduct deep research, automate tasks, and take action across their business applications, bringing chat agents, research, workflow automation, and business intelligence (BI) together in one place. Its BI capability, AWS Quick Sight, turns data into interactive dashboards. With generative BI, you can build a multi-sheet dashboard from a natural language prompt or ask questions of your data in plain language.
Allow AWS Quick to access the table bucket
AWS Quick reads materialized views directly from the table bucket. Before you create a dataset, an AWS Quick administrator allows Quick to access the bucket:
- In AWS Quick, open Manage account.
- Under Permissions, choose AWS resources.
- Select Amazon S3 Tables, choose Select S3 table buckets, select the
amzn-s3-demo-table-buckettable bucket, and choose Finish.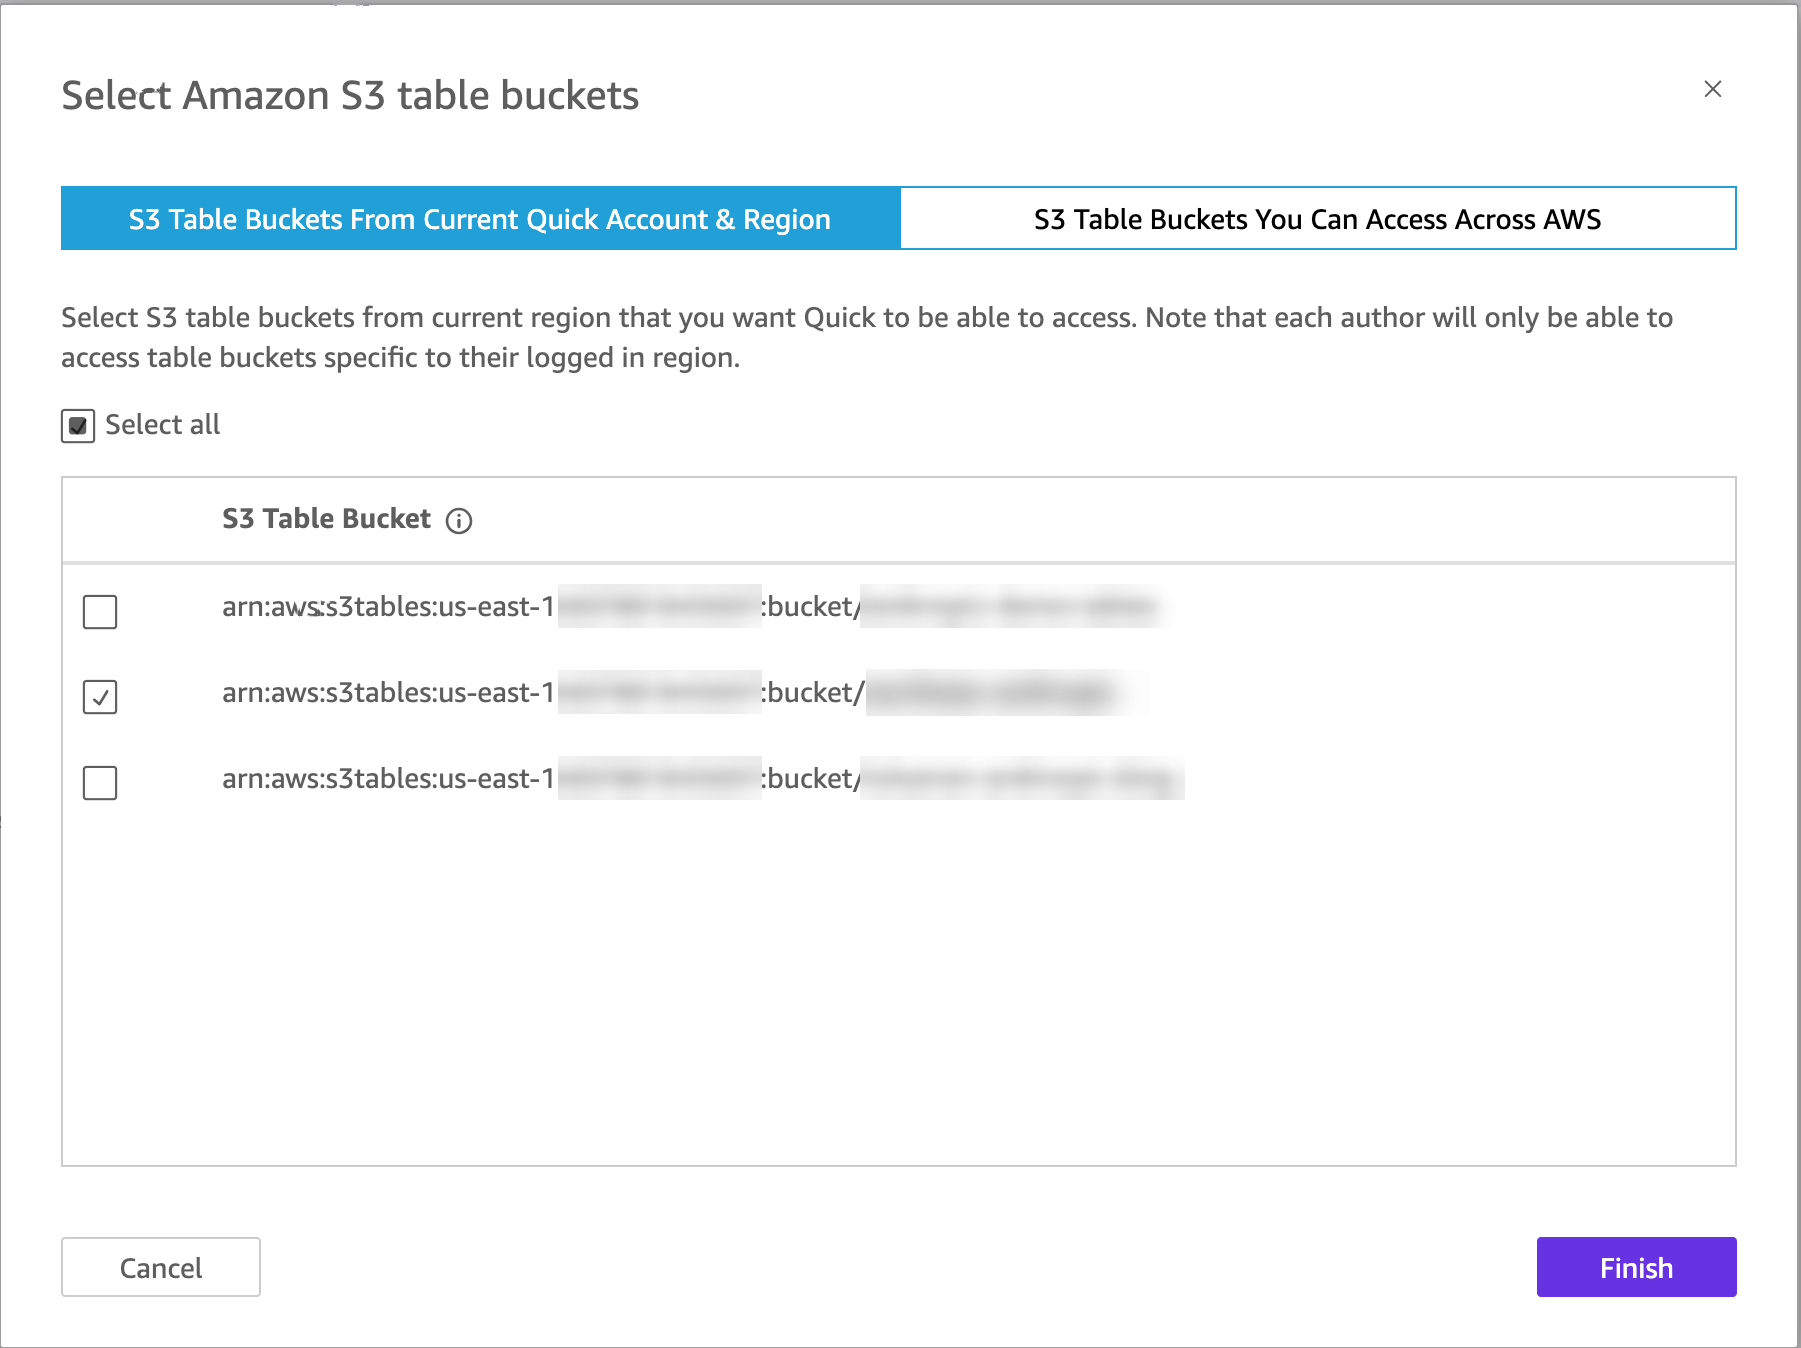
Figure 10: Granting AWS Quick access to the table bucket
Without this step, creating the data source fails with a message that AWS Quick doesn’t have permission to access the database.
Create datasets from the materialized views
Create one dataset for each view that the dashboard uses:
- Choose Data, then Create dataset, and then Create data source.
- Choose Amazon S3 Tables. Enter a data source name, such as
anthropic-usage, and the table bucket ARN, for examplearn:aws:s3tables:<region>:<account-id>:bucket/amzn-s3-demo-table-bucket. Choose Create data source. - For Namespace, choose mart. Select
weekly_spend_by_business_unitand choose Select. - Choose Directly query your data, and then Edit/Preview data. Check the preview and choose Save & publish.
- Repeat these steps for
unit_cost, and select theanthropic-usagedata source that you created instead of creating a new one.
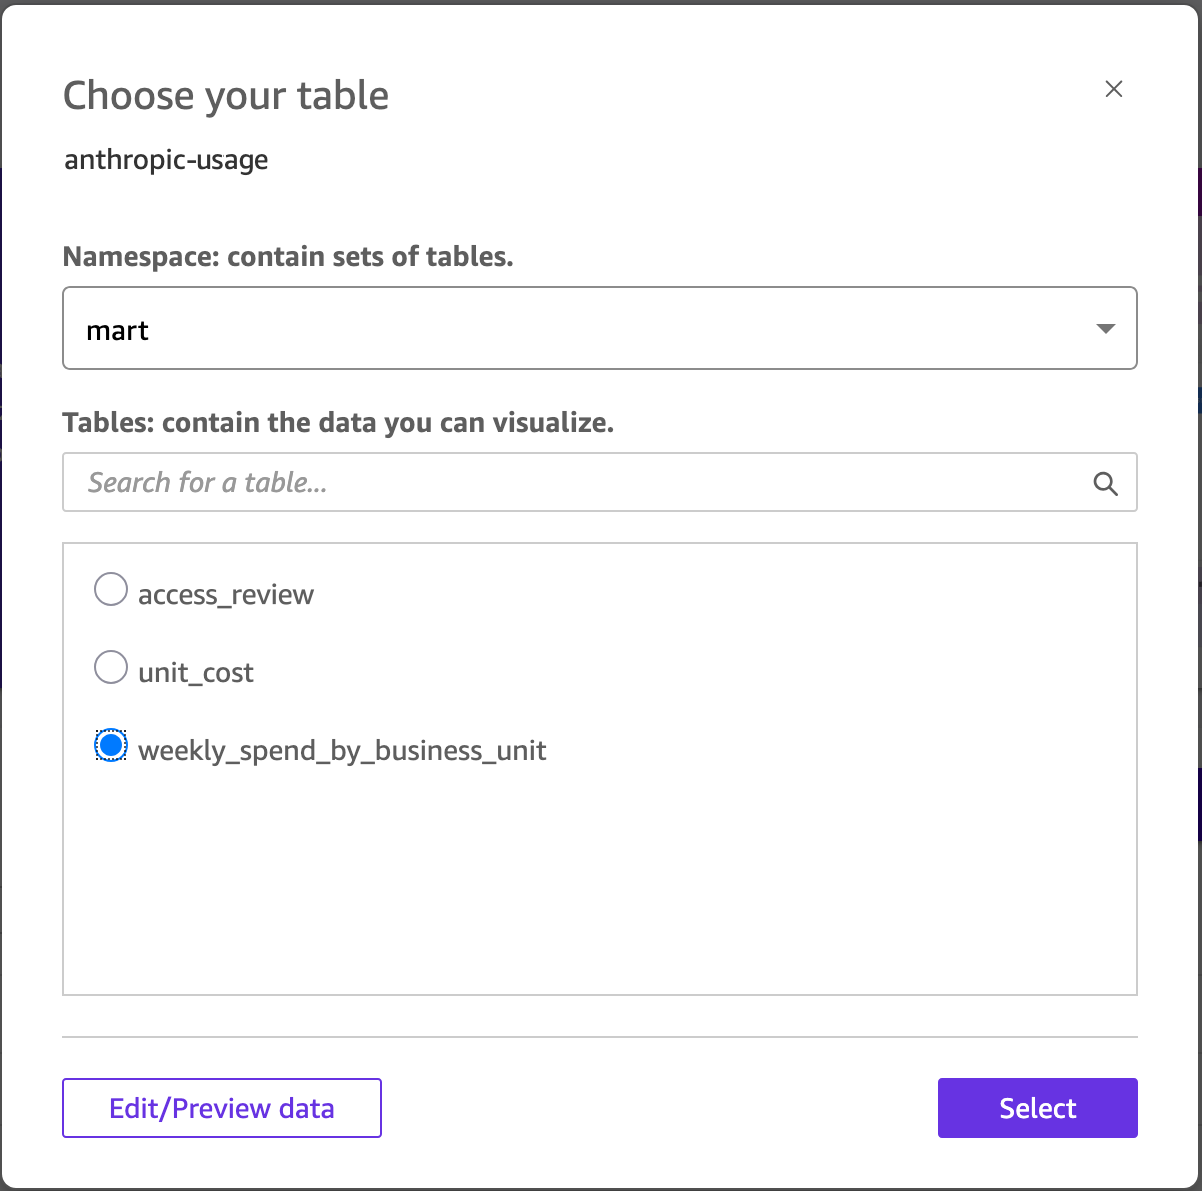
Figure 11: Creating datasets from the materialized views in AWS Quick
Because the datasets query the views directly, the dashboard shows the latest results after each refresh of the materialized views. You don’t need a separate refresh schedule in AWS Quick.
Generate the analysis from a prompt
Instead of building each visual by hand, describe the review that leadership wants and let AWS Quick generate the analysis. On the Analyses page, choose Generate analysis. Choose Add data, select both datasets, and enter a prompt such as the following:
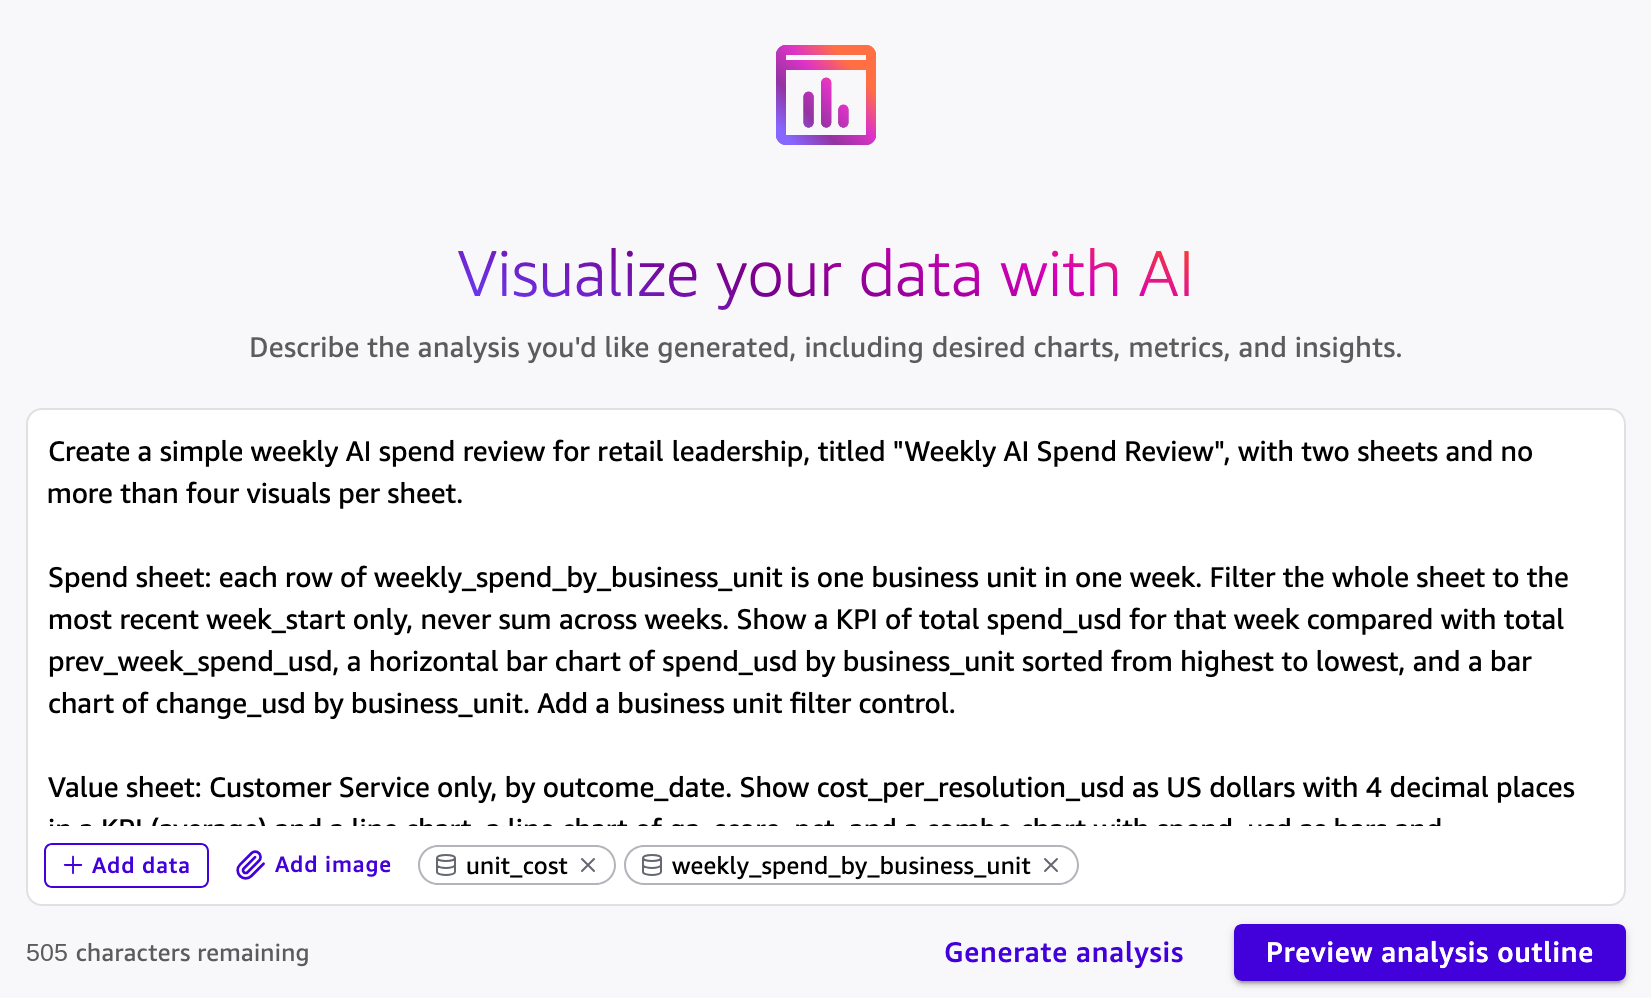
Figure 12: Generating the analysis from a natural language prompt
Choose Preview analysis outline. AWS Quick reviews the columns and statistics of each dataset and proposes a plan with filter controls, sheets, and the visuals on each sheet. Review the plan, choose Edit if you want to change it, and then choose Generate.
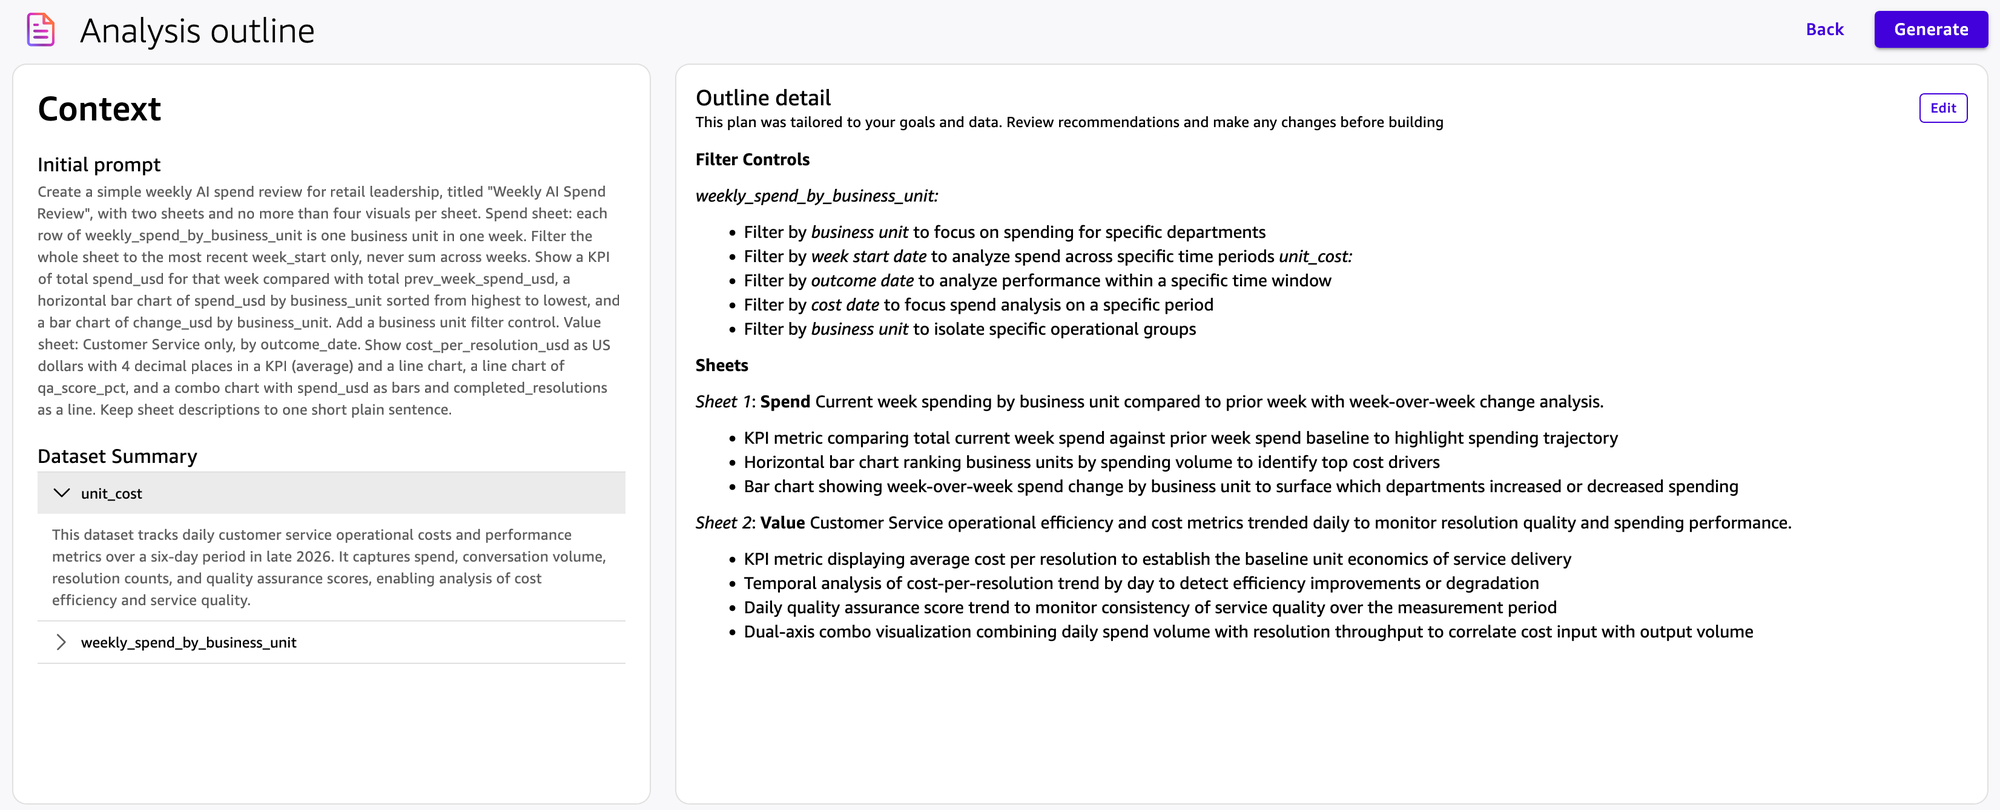
Figure 13: Previewing the proposed analysis outline
Describe the shape of your data in the prompt. The weekly_spend_by_business_unit view has one row per business unit per week. When our first prompt only asked to compare spend with the previous week, the generated analysis added all weeks together. Asking for the most recent week only fixed it.
Review the dashboard
The Spend sheet shows which business units are driving AI spend.
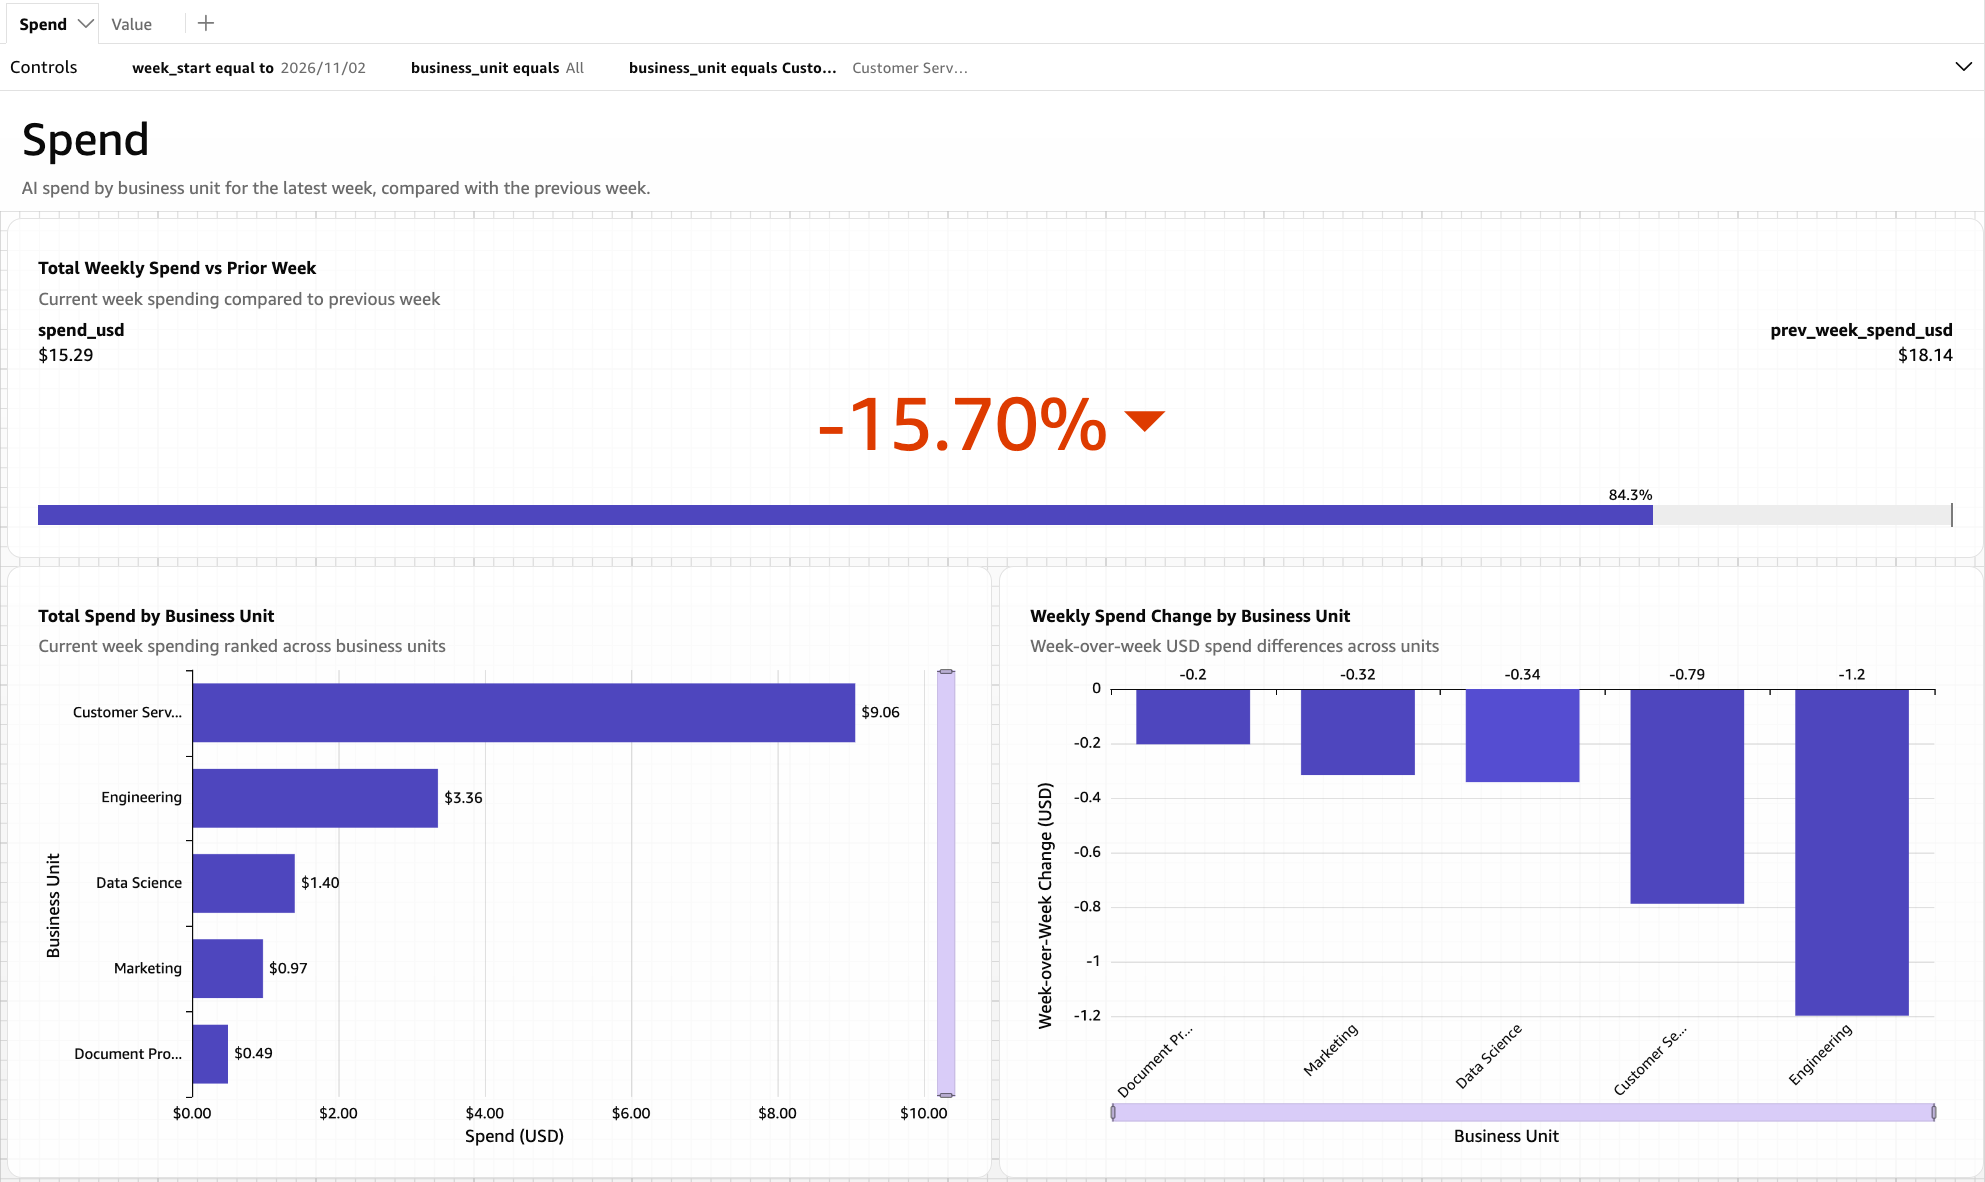
Figure 14: The Spend sheet showing AI spend by business unit
The Value sheet shows whether the spend is paying off.
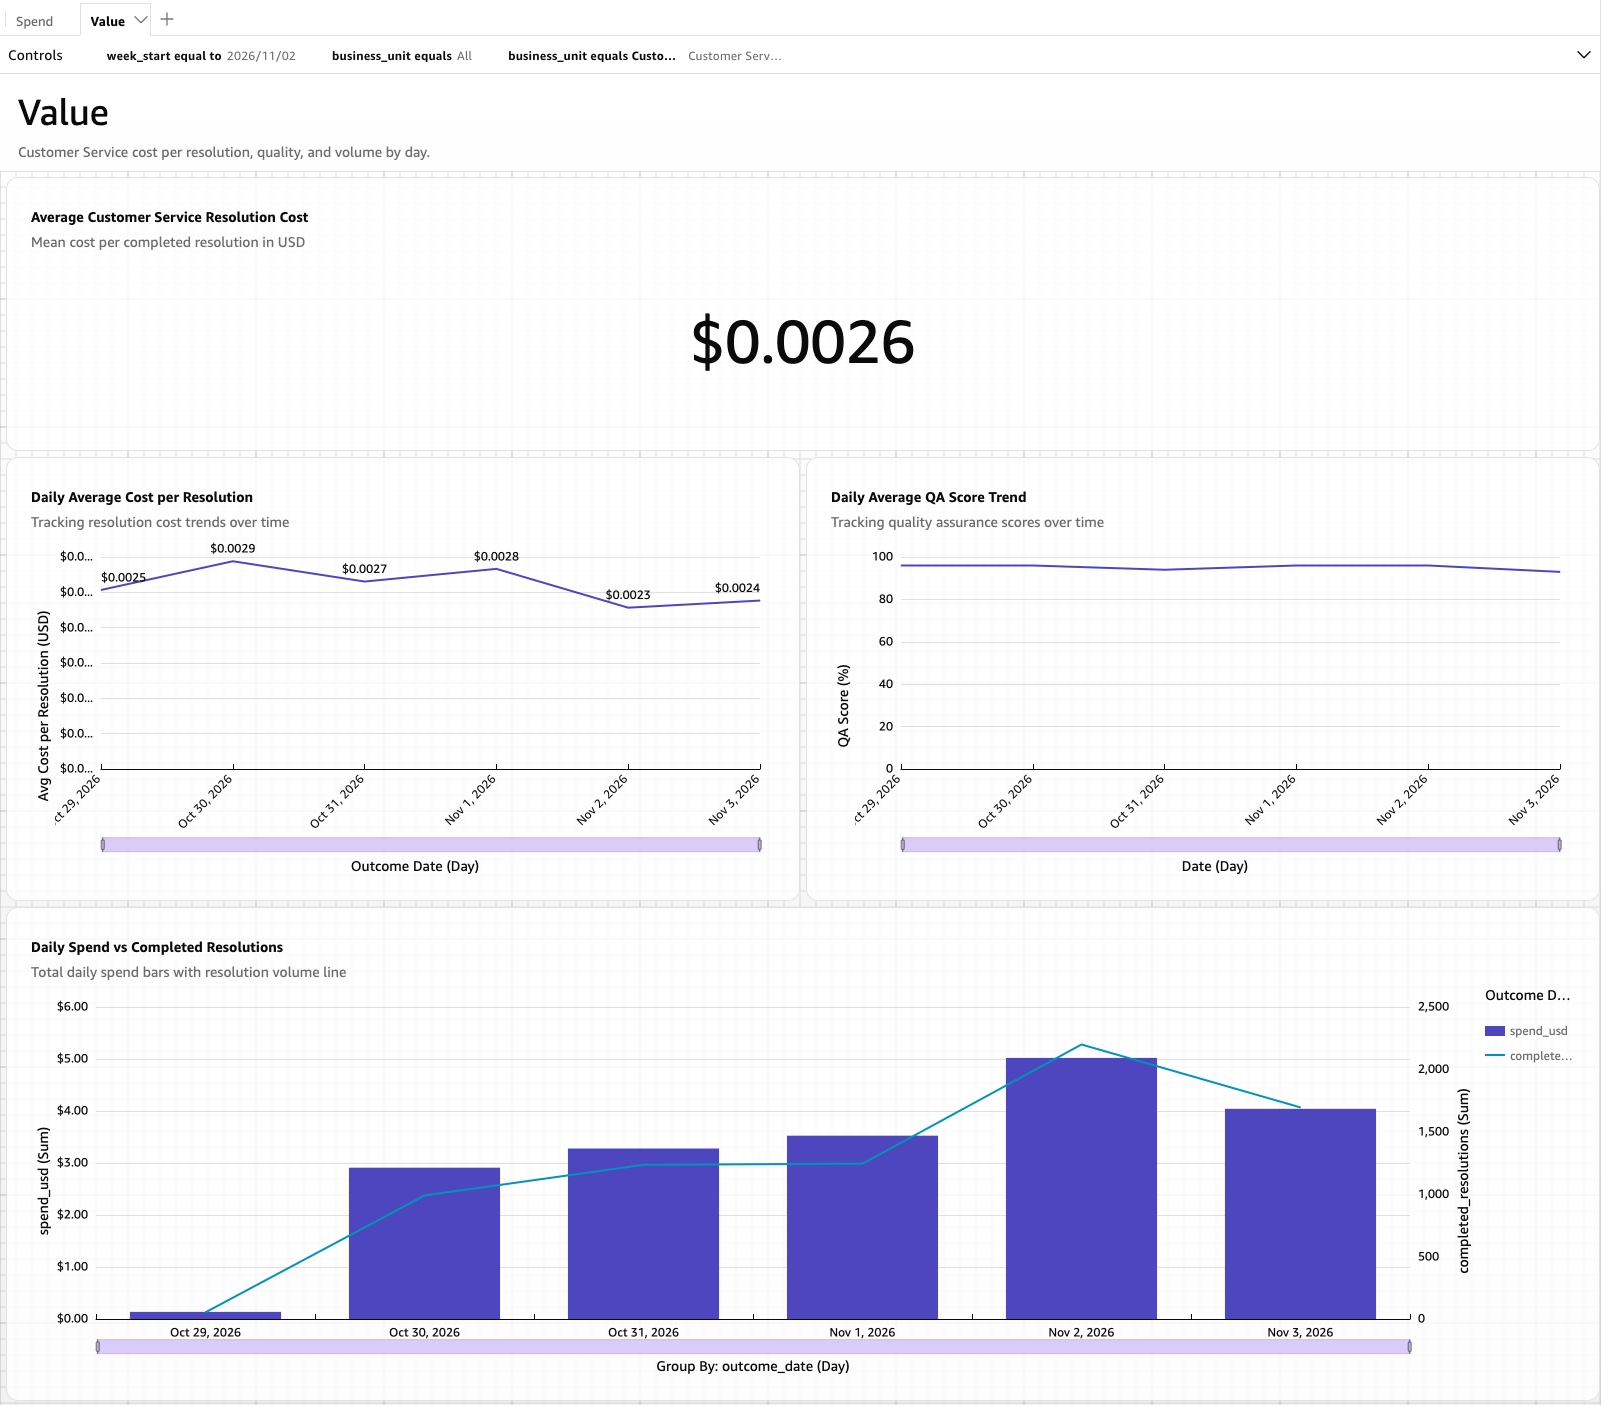
Figure 15: The Value sheet showing whether the spend is paying off
Publish and share the dashboard
Choose Publish to create a dashboard from the analysis, and share it with leadership. Viewers can filter and explore the dashboard without access to the analysis or the datasets behind it. To have the review arrive before the weekly meeting, schedule an email report from the dashboard.
Go further
This dashboard answers leadership’s questions with two datasets and a short prompt, but the same connector data supports much more. For advanced use cases, use the Agent Toolkit for AWS with your preferred AI coding agent to build a richer version of this solution through natural language. The following dashboard compares the price per million tokens across models, shows how much prompt caching saves, and lists the API keys to revoke. We generated the entire data pipeline and this dashboard with Kiro and the Agent Toolkit for AWS.
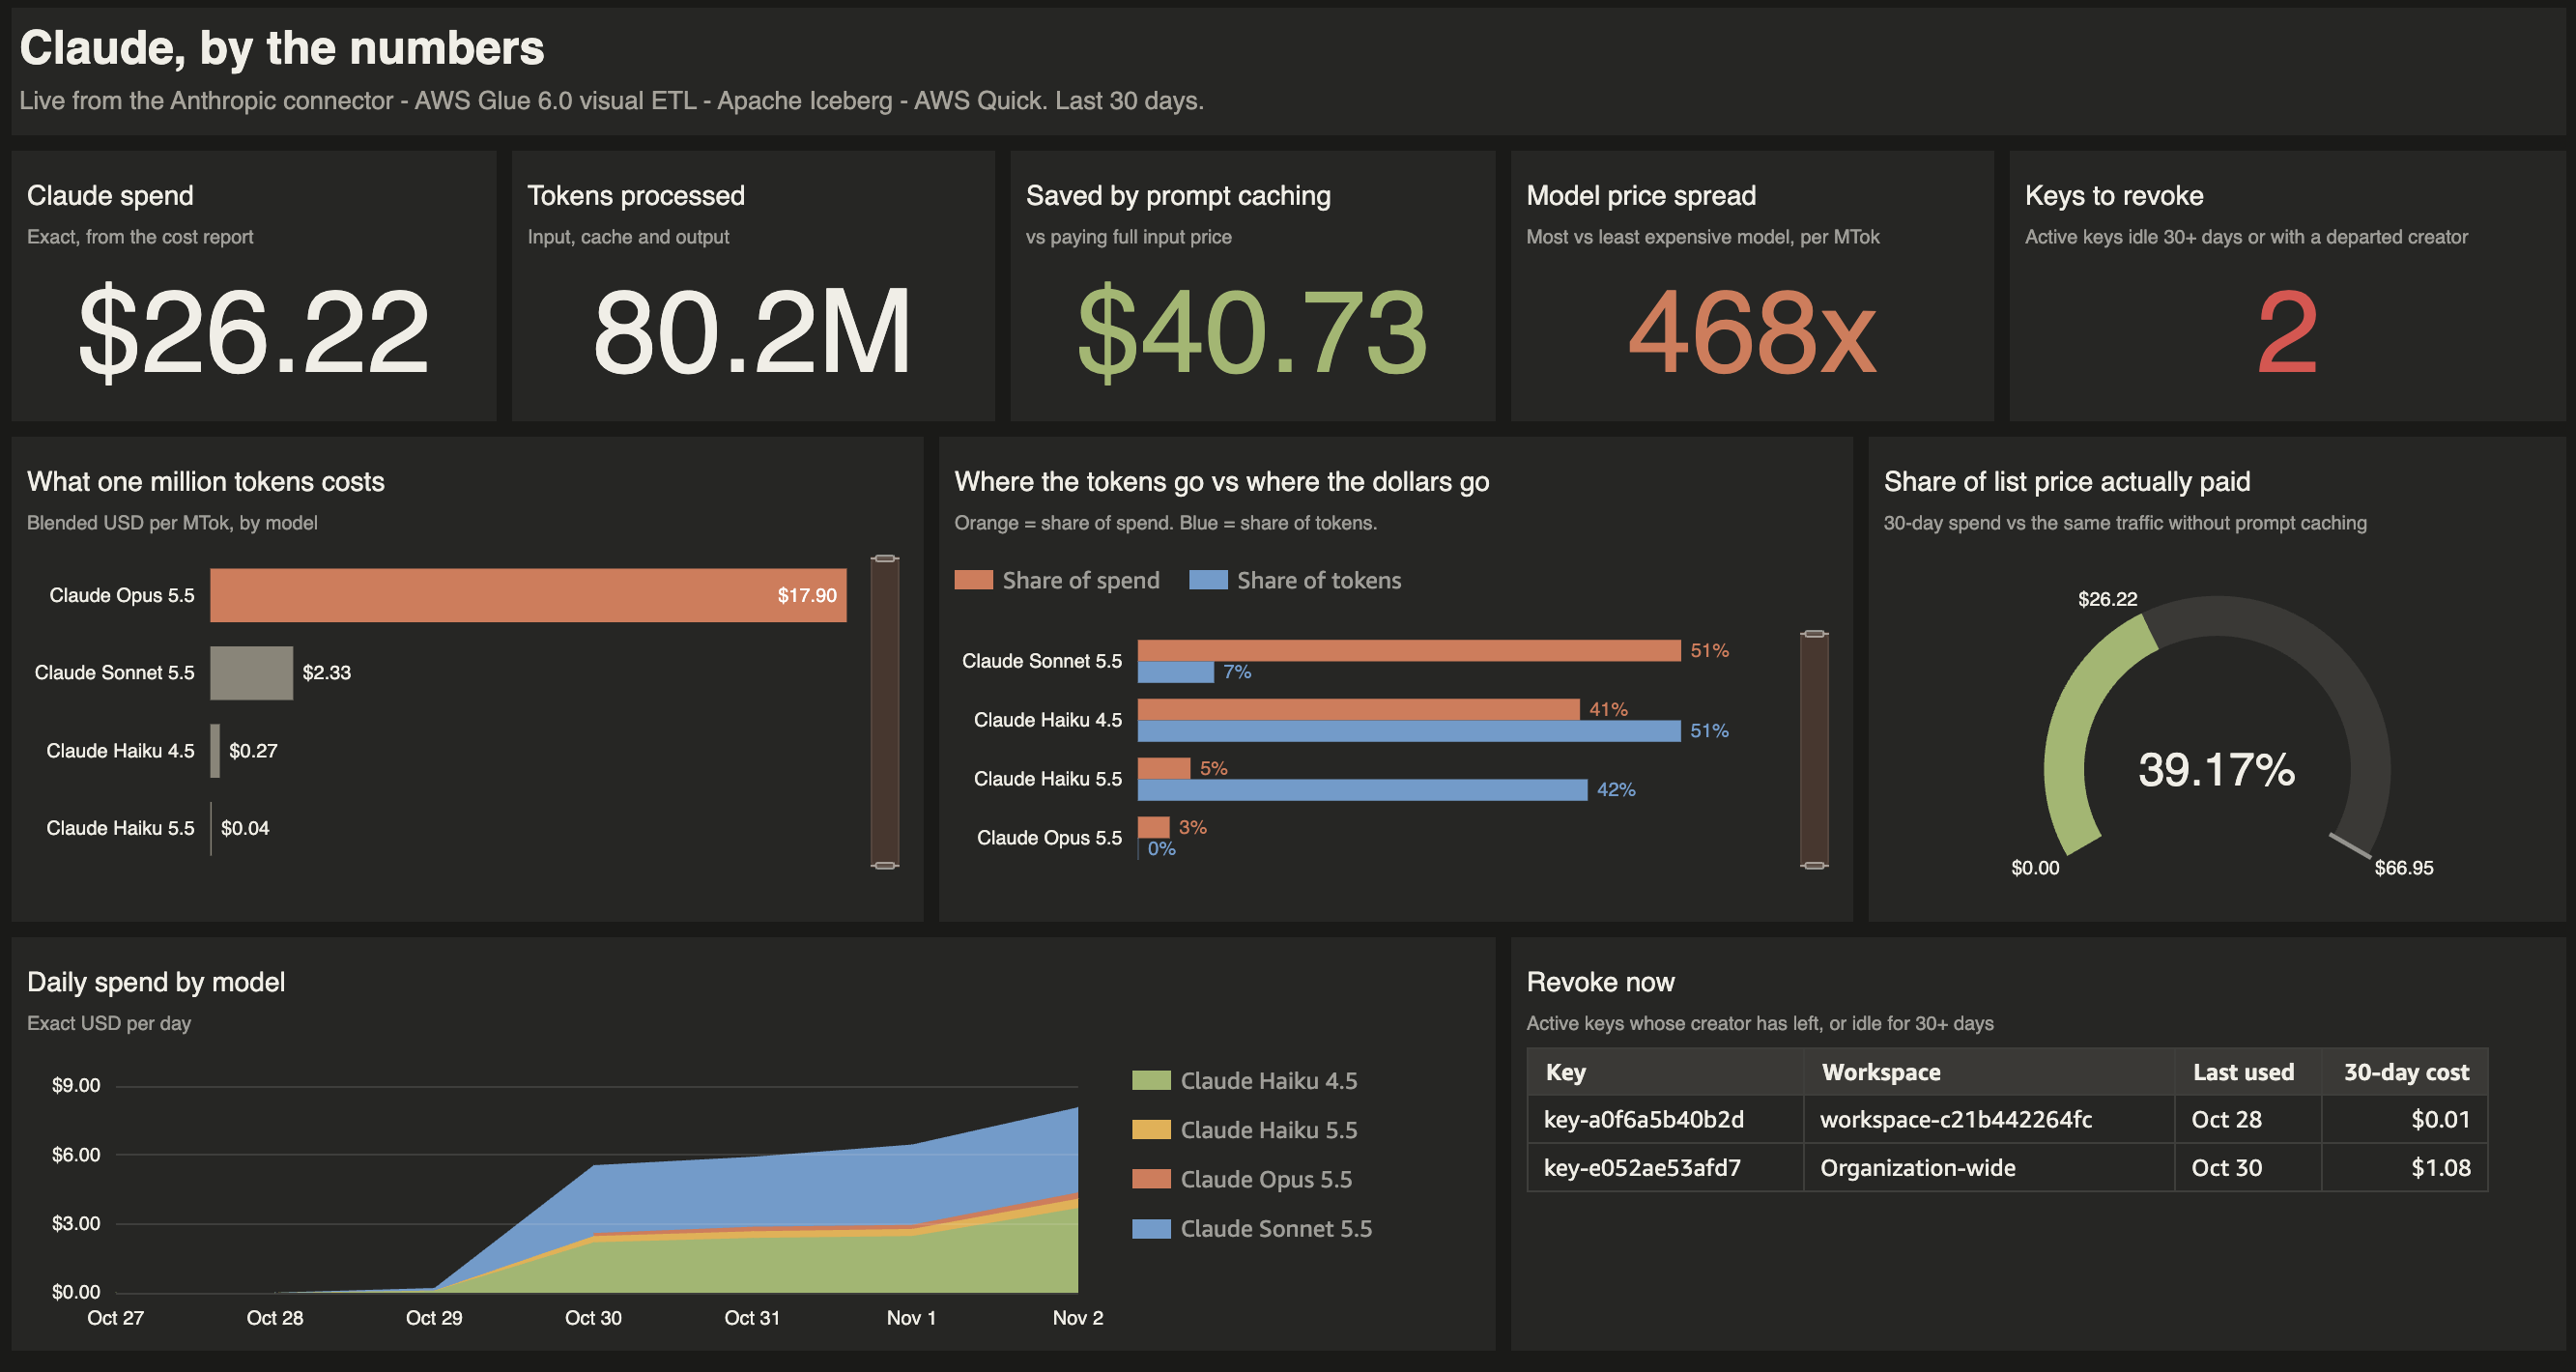
Figure 16: A richer dashboard built with the Agent Toolkit for AWS
Considerations
- Report time windows: Set
starting_atfor every usage and cost read. Daily buckets include only completed days. Usebucket_width = '1h'for the current day. - API key scope: An Admin API key reads organization data but not workspace data such as models, message batches, or files, and a workspace API key reads only its workspace. Use one connection per key, and one set of connections per Anthropic organization.
- Rate limits: The Anthropic Admin API limits request rates. Use bounded time windows and scheduled incremental reads rather than large historical reads.
- AWS Glue materialized views: AWS Glue materialized views require AWS Glue 5.1 or later and iam:PassRole for the role that refreshes them. Definitions must be deterministic, and in our testing views with a
WITHclause failed to refresh, so use inline subqueries. - Security: Grant the AWS Glue role read access only to the secrets it needs, rotate Anthropic API keys regularly, and restrict access to curated tables.
Clean up
To avoid ongoing charges, delete the resources you created: the AWS Glue jobs, workflow, and connections. The Secrets Manager secrets. The materialized views, tables, namespaces, and table bucket in Amazon S3 Tables. The reference data and scripts in Amazon S3. You can also remove the dashboards and datasets that you created in AWS Quick. Consider revoking any Anthropic API keys you created for this walkthrough.
Conclusion
In this post, we showed how to use the AWS Glue connector for Anthropic to bring Anthropic usage, cost, and access data into AWS, store it as Apache Iceberg tables in Amazon S3 Tables, and keep business-ready results current with materialized views. With Amazon Athena, the retailer can see which business units drive AI spend, whether that spend pays off, and which API keys need an ownership review. Using AWS Quick, we used natural language to create dashboards.
To get started, see Anthropic connection options in the AWS Glue Developer Guide. To browse the other connection types that AWS Glue supports, including the new native connectors for SaaS applications, see Available connections.