AWS Big Data Blog
Deep dive into the Amazon Managed Service for Apache Fink application lifecycle – Part 2
In Part 1 of this series, we discussed fundamental operations to control the lifecycle of your Amazon Managed Service for Apache Flink application. If you are using higher-level tools such as AWS CloudFormation or Terraform, the tool will execute these operations for you. However, understanding the fundamental operations and what the service automatically does can provide some level of Mechanical Sympathy to confidently implement a more robust automation.
In the first part of this series, we focused on the happy paths. In an ideal world, failures don’t happen, and every change you deploy works perfectly. However, the real world is less predictable. Quoting Werner Vogels, Amazon’s CTO, “Everything fails, all the time.”
In this post, we explore failure scenarios that can happen during normal operations or when you deploy a change or scale the application, and how to monitor operations to detect and recover when something goes wrong.
The less happy path
A robust automation must be designed to handle failure scenarios, in particular during operations. To do that, we need to understand how Apache Flink can deviate from the happy path. Due to the nature of Flink as a stateful stream processing engine, detecting and resolving failure scenarios requires different techniques compared to other long-running applications, such as microservices or short-lived serverless functions (such as AWS Lambda).
Flink’s behavior on runtime errors: The fail-and-restart loop
When a Flink job encounters an unexpected error at runtime (an unhandled exception), the normal behavior is to fail, stop the processing, and restart from the latest checkpoint. Checkpoints allow Flink to support data consistency and no data loss in case of failure. Also, because Flink is designed for stream processing applications, which run continuously, if the error happens again, the default behavior is to keep restarting, hoping the problem is transient and the application will eventually recover the normal processing.In some cases, the problem is not transient, however. For example, when you deploy a code change that contains a bug, causing the job to fail as soon as it starts processing data, or if the expected schema doesn’t match the records in the source, causing deserialization or processing errors. The same scenario might also happen if you mistakenly changed a configuration that prevents a connector to reach the external system. In these cases, the job is stuck in a fail-and-restart loop, indefinitely, or until you actively force-stop it.
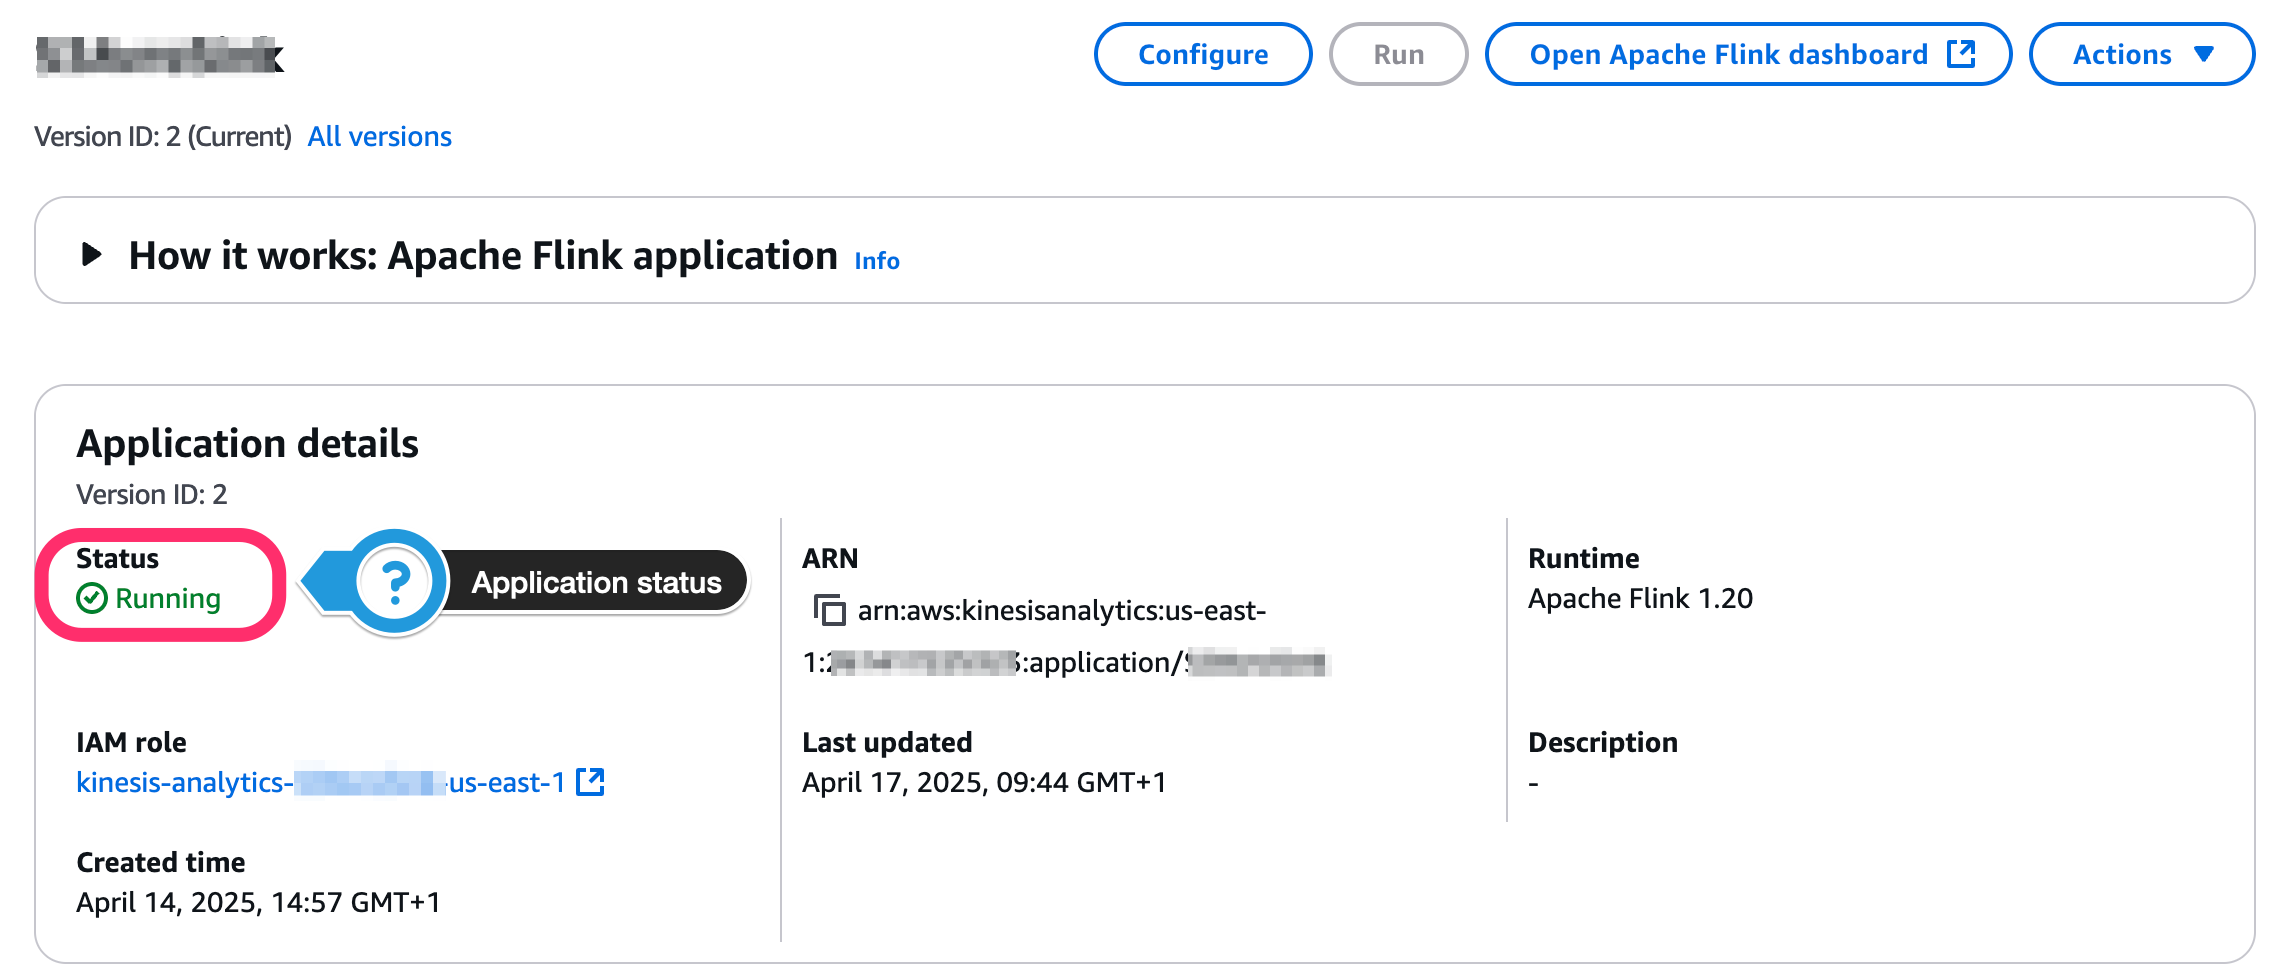
When this happens, the Managed Service for Apache Flink application status might be RUNNING, but the underlying Flink job is actually failing and restarting. The AWS Management Console gives you a hint, pointing that the application might need attention (see the following screenshot).
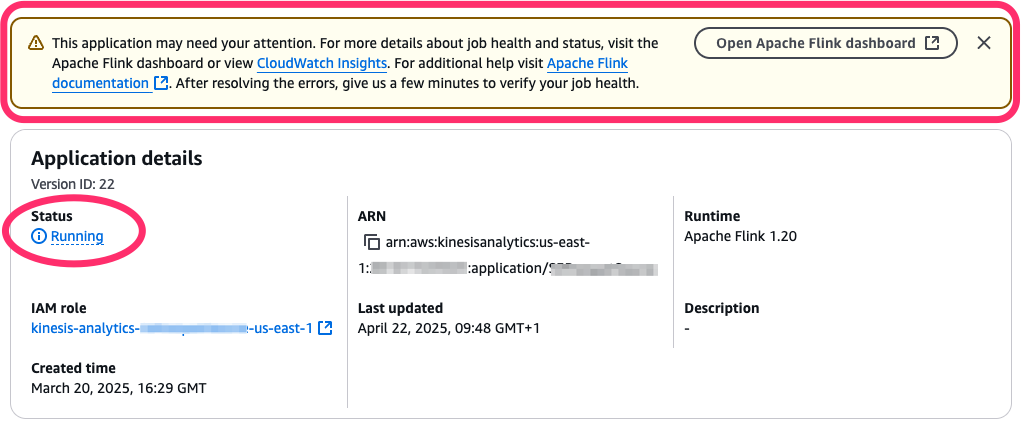
In the following sections, we learn how to monitor the application and job status, to automatically react to this situation.
When starting or updating the application goes wrong
To understand the failure mode, let’s review what happens automatically when you start the application, or when the application restarts after you issued UpdateApplication command, as we explored in Part 1 of this series. The following diagram illustrates what happens when an application starts.
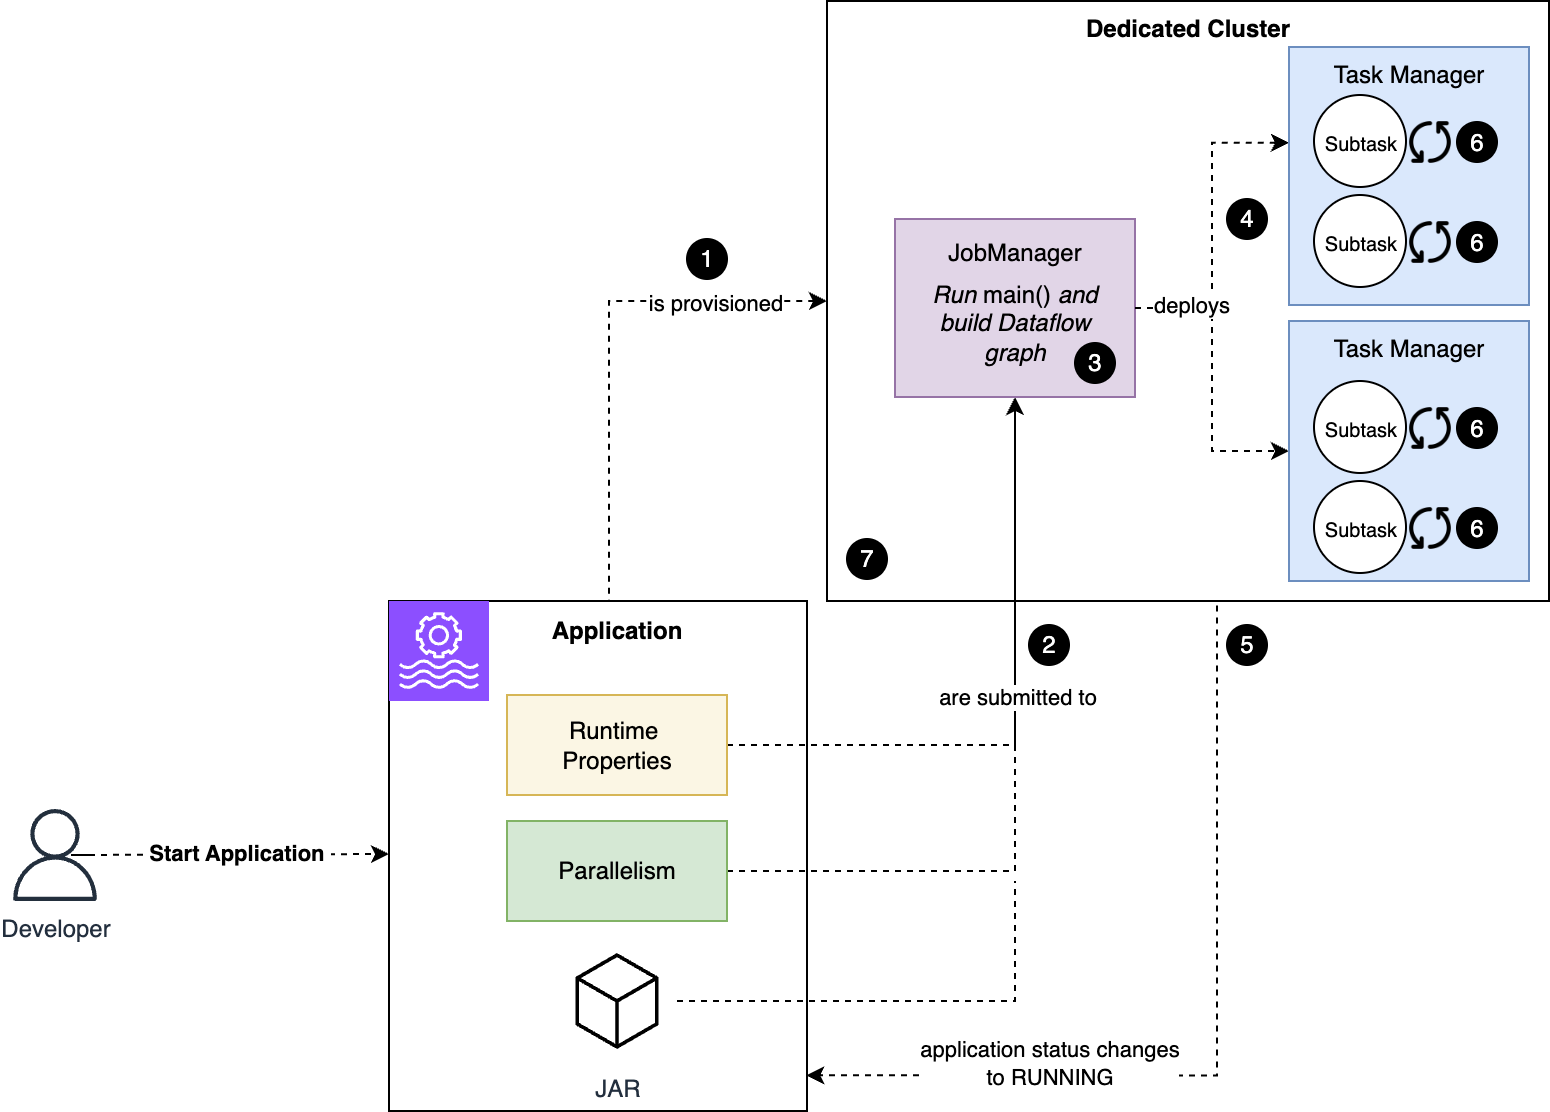
The workflow consists of the following steps:
- Managed Service for Apache Flink provisions a cluster dedicated to your application.
- The code and configuration are submitted to the Job Manager node.
- The code in the
main()method of your application runs, defining the dataflow of your application. - Flink deploys to the Task Manager nodes the substasks that make up your job.
- The job and application status change to
RUNNING. However, subtasks start initializing now. - Subtasks restore their state, if applicable, and initialize any resources. For example, a Kafka connector’s subtask initializes the Kafka client and subscribes the topic.
- When all subtasks are successfully initialized, they change to
RUNNINGstatus and the job starts processing data.
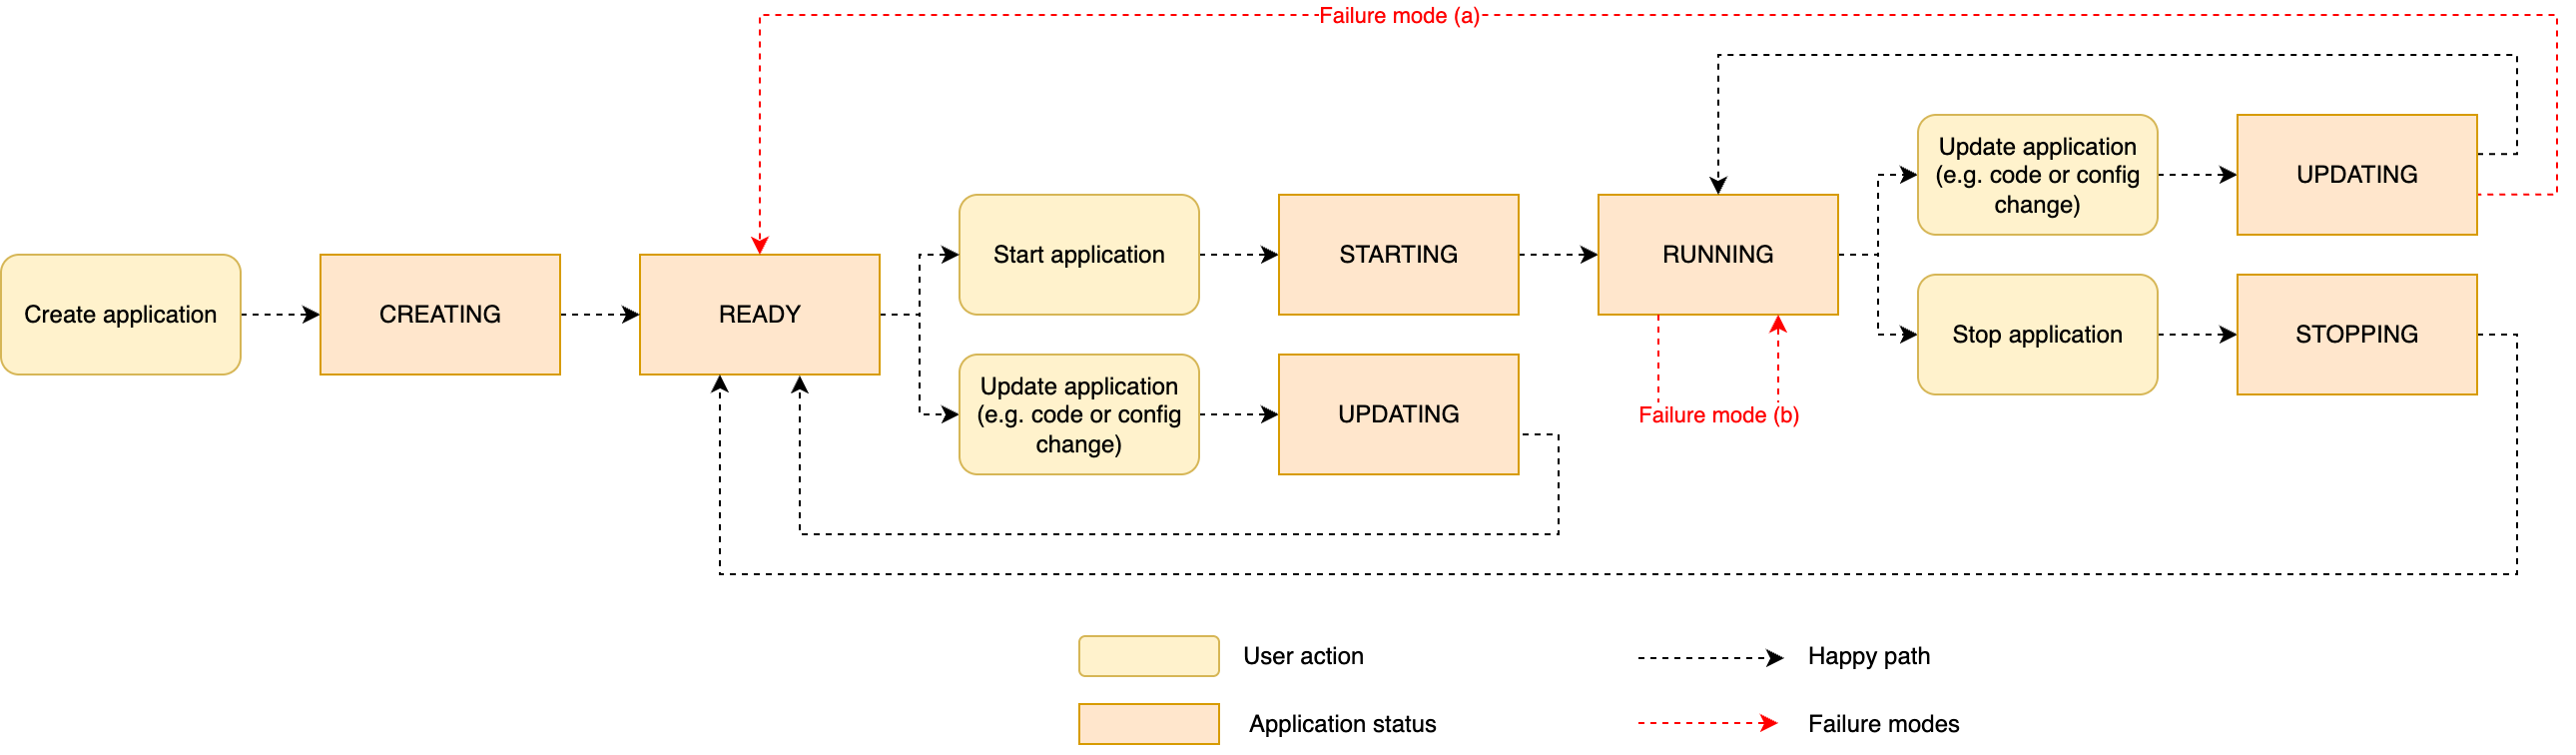
To new Flink users, it can be confusing that a RUNNING status doesn’t necessarily imply the job is healthy and processing data.When something goes wrong during the process of starting (or restarting) the application, depending on the phase when the problem arises, you might observe two different types of failure modes:
- (a) A problem prevents the application code from being deployed – Your application might encounter this failure scenario if the deployment fails as soon as the code and configuration are passed to the Job Manager (step 2 of the process), for example if the application code package is malformed. A typical error is when the JAR is missing a
mainClassor ifmainClasspoints to a class that doesn’t exist. This failure mode might also happen if the code of yourmain()method throws an unhandled exception (step 3). In these cases, the application fails to change toRUNNING, and reverts toREADYafter the attempt. - (b) The application is started, the job is stuck in a fail-and-restart loop – A problem might occur later in the process, after the application status has changed
RUNNING. For example, after the Flink job has been deployed to the cluster (step 4 of the process), a component might fail to initialize (step 6). This might happen when a connector is misconfigured, or a problem prevents it from connecting to the external system. For example, a Kafka connector might fail to connect to the Kafka cluster because of the connector’s misconfiguration or networking issues. Another possible scenario is when the Flink job successfully initializes, but it throws an exception as soon as it starts processing data (step 7). When this happens, Flink reacts to a runtime error and might get stuck in a fail-and-restart loop.
The following diagram illustrates the sequence of application status, including the two failure scenarios just described.
Troubleshooting
We have examined what can go wrong during operations, in particular when you update a RUNNING application or restart an application after changing its configuration. In this section, we explore how we can act on these failure scenarios.
Roll back a change
When you deploy a change and realize something is not quite right, you normally want to roll back the change and put the application back in working order, until you investigate and fix the problem. Managed Service for Apache Flink provides a graceful way to revert (roll back) a change, also restarting the processing from the point it was stopped before applying the fault change, providing consistency and no data loss.In Managed Service for Apache Flink, there are two types of rollbacks:
- Automatic – During an automatic rollback (also called system rollback), if enabled, the service automatically detects when the application fails to restart after a change, or when the job starts but immediately falls into a fail-and-restart loop. In these situations, the rollback process automatically restores the application configuration version before the last change was applied and restarts the application from the snapshot taken when the change was deployed. See Improve the resilience of Amazon Managed Service for Apache Flink application with system-rollback feature for more details. This feature is disabled by default. You can enable it as part of the application configuration.
- Manual – A manual rollback API operation is like a system rollback, but it’s initiated by the user. If the application is running but you observe something not behaving as expected after applying a change, you can trigger the rollback operation using the RollbackApplication API action or the console. Manual rollback is possible when the application is
RUNNINGorUPDATING.
Both rollbacks work similarly, restoring the configuration version before the change and restarting with the snapshot taken before the change. This prevents data loss and brings you back to a version of the application that was working. Also, this uses the code package that was saved at the time you created the previous configuration version (the one you are rolling back to), so there is no inconsistency between code, configuration, and snapshot, even if in the meantime you have replaced or deleted the code package from the Amazon Simple Storage Service (Amazon S3) bucket.
Implicit rollback: Update with an older configuration
A third way to roll back a change is to simply update the configuration, bringing it back to what it was before the last change. This creates a new configuration version, and requires the correct version of the code package to be available in the S3 bucket when you issue the UpdateApplication command.
Why is there a third option when the service provides system rollback and the managed RollbackApplication action? Because most high-level infrastructure-as-code (IaC) frameworks such as Terraform use this strategy, explicitly overwriting the configuration. It is important to understand this possibility even though you will probably use the managed rollback if you implement your automation based on the low-level actions.
The following are two important caveats to consider for this implicit rollback:
- You will normally want to restart the application from the snapshot that was taken before the faulty change was deployed. If the application is currently
RUNNINGand healthy, this is not the latest snapshot (RESTORE_FROM_LATEST_SNAPSHOT), but rather the previous one. You must set the restart fromRESTORE_FROM_CUSTOM_SNAPSHOTand select the correct snapshot. - UpdateApplication only works if the application is
RUNNINGand healthy, and the job can be gracefully stopped with a snapshot. Conversely, if the application is stuck in a fail-and-restart loop, you must force-stop it first, change the configuration while the application isREADY, and later start the application from the snapshot that was taken before the faulty change was deployed.
Force-stop the application
In normal scenarios, you stop the application gracefully, with the automatic snapshot creation. However, this might not be possible in some scenarios, such as if the Flink job is stuck in a fail-and-restart loop. This might happen, for example, if an external system the job uses stops working, or because the AWS Identity and Access Management (IAM) configuration was erroneously modified, removing permissions required by the job.
When the Flink job gets stuck in a fail-and-restart loop after a faulty change, your first option should be using RollbackApplication, which automatically restores the previous configuration and starts from the correct snapshot. In the rare cases you can’t stop the application gracefully or use RollbackApplication, the last resort is force-stopping the application. Force-stop uses the StopApplication command with Force=true. You can also force-stop the application from the console.
When you force-stop an application, no snapshot is taken (if that were possible, you would have been able to gracefully stop). When you restart the application, you can either skip restoring from a snapshot (SKIP_RESTORE_FROM_SNAPSHOT) or use a snapshot that was previously taken, scheduled using Snapshot Manager, or manually, using the console or CreateApplicationSnapshot API action.
We strongly recommend setting up scheduled snapshots for all production applications that you can’t afford restarting with no state.
Monitoring Apache Flink application operations
Effective monitoring of your Apache Flink applications during and after operations is crucial to verify the outcome of the operation and allow lifecycle automation to raise alarms or react, in case something goes wrong.
The main indicators you can use during operations include the FullRestarts metric (available in Amazon CloudWatch) and the application, job, and task status.
Monitoring the outcome of an operation
The simplest way to detect the outcome of an operation, such as StartApplication or UpdateApplication, is to use the ListApplicationOperations API command. This command returns a list of the most recent operations of a specific application, including maintenance events that force an application restart.
For example, to retrieve the status of the most recent operation, you can use the following command:
The output will be similar to the following code:
OperationStatus will follow the same logic as the application status reported by the console and by DescribeApplication. This means it might not detect a failure during the operator initialization or while the job starts processing data. As we have learned, these failures might put the application in a fail-and-restart loop. To detect these scenarios using your automation, you must use other techniques, which we cover in the rest of this section.
Detecting the fail-and-restart loop using the FullRestarts metric
The simplest way to detect whether the application is stuck in a fail-and-restart loop is using the fullRestarts metric, available in CloudWatch Metrics. This metric counts the number of restarts of the Flink job after you started the application with a StartApplication command or restarted with UpdateApplication.
In a healthy application, the number of full restarts should ideally be zero. A single full restart might be acceptable during deployment or planned maintenance; multiple restarts normally indicate some issue. We recommend not to trigger an alarm on a single restart, or even a couple of consecutive restarts.
The alarm should only be triggered when the application is stuck in a fail-and-restart loop. This implies checking whether several restarts have happened over a relatively short period of time. Deciding the period is not trivial, because the time the Flink job takes to restart from a checkpoint depends on the size of the application state. However, if the state of your application is lower than several GB per KPU, you can safely assume the application should start in less than a minute.
The goal is creating a CloudWatch alarm that triggers when fullRestarts keeps increasing over a time period sufficient for multiple restarts. For example, assuming your application restarts in less than 1 minute, you can create a CloudWatch alarm that relies on the DIFF math expression of the fullRestarts metric. The following screenshot shows an example of the alarm details.
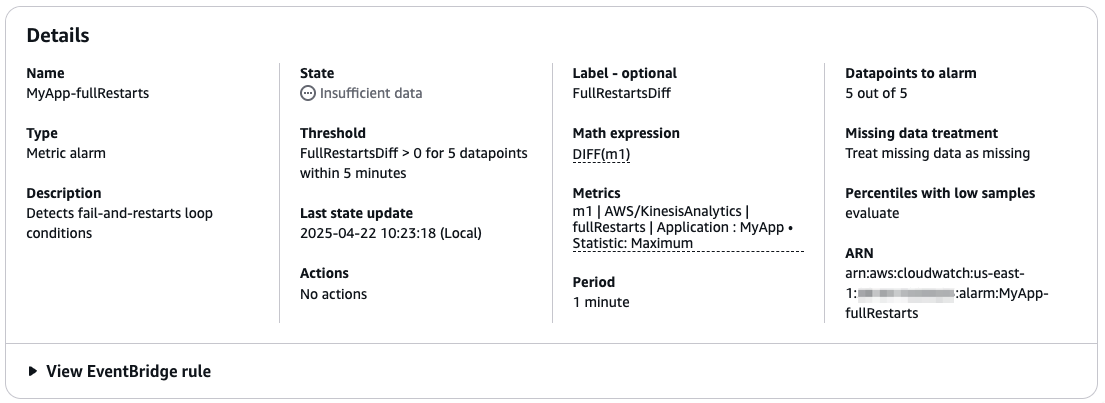
This example is a conservative alarm, only triggering if the application keeps restarting for over 5 minutes. This means you detect the problem after at least 5 minutes. You might consider reducing the time to detect the failure earlier. However, be careful not to trigger an alarm after just one or two restarts. Occasional restarts might happen, for example during normal maintenance (patching) that is managed by the service, or for a transient error of an external system. Flink is designed to recover from these conditions with minimal downtime and no data loss.
Detecting whether the job is up and running: Monitoring application, job, and task status
We have discussed how you have different statuses: the status of the application, job, and subtask. In Managed Service for Apache Flink, the application and job status change to RUNNING when the subtasks are successfully deployed on the cluster. However, the job is not really running and processing data until all the subtasks are RUNNING.
Observing the application status during operations
The application status is visible on the console, as shown in the following screenshot.
In your automation, you can poll the DescribeApplication API action to observe the application status. The following command shows how to use the AWS Command Line Interface (AWS CLI) and jq command to extract the status string of an application:
Observing job and subtask status
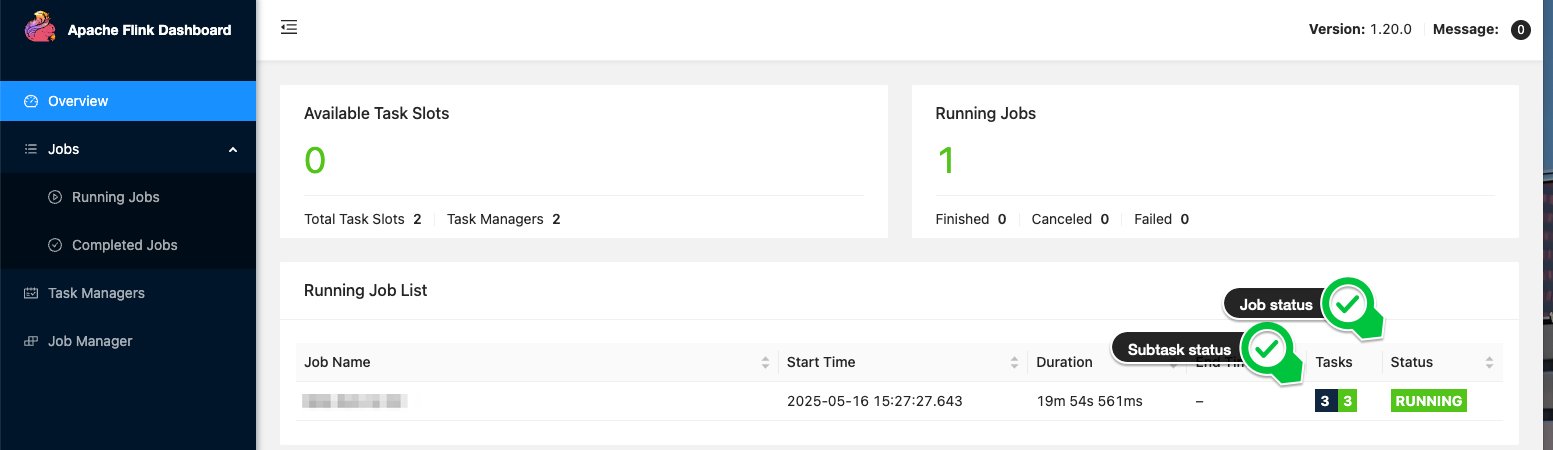
Managed Service for Apache Flink gives you access to the Flink Dashboard, which provides useful information for troubleshooting, including the status of all subtasks. The following screenshot, for example, shows a healthy job where all subtasks are RUNNING.
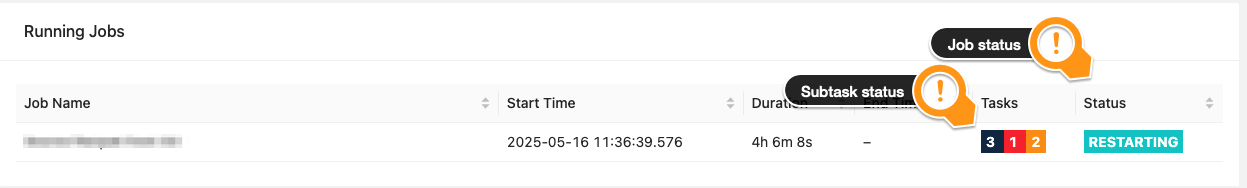
In the following screenshot, we can see a job where subtasks are failing and restarting.
In your automation, when you start the application or deploy a change, you want to be sure the job is eventually up and running and processing data. This happens when all the subtasks are RUNNING. Note that waiting for the job status to become RUNNING after an operation is not completely safe. A subtask might still fail and cause the job to restart after it was reported as RUNNING.
After you execute a lifecycle operation, your automation can poll the substasks status waiting for one of two events:
- All subtasks report
RUNNING– This indicates the operation was successful and your Flink job is up and running. - Any subtask reports
FAILINGorCANCELED– This indicates something went wrong, and the application is likely stuck in a fail-and-restart loop. You need to intervene, for example, force-stopping the application and then rolling back the change.
If you are restarting from a snapshot and the state of your application is quite big, you might observe subtasks will report INITIALIZING status for longer. During the initialization, Flink restores the state of the operator before changing to RUNNING.
The Flink REST API exposes the state of the subtasks, and can be used in your automation. In Managed Service for Apache Flink, this requires three steps:
- Generate a pre-signed URL to access the Flink REST API using the CreateApplicationPresignedUrl API action.
- Make a GET request to the
/jobsendpoint of the Flink REST API to retrieve the job ID. - Make a GET request to the
/jobs/<job-id>endpoint to retrieve the status of the subtasks.
The following GitHub repository provides a shell script to retrieve the status of the tasks of a given Managed Service for Apache Flink application.
Monitoring subtasks failure while the job is running
The approach of polling the Flink REST API can be used in your automation, immediately after an operation, to observe whether the operation was eventually successful.
We strongly recommend not to continuously poll the Flink REST API while the job is running to detect failures. This operation is resource consuming, and might degrade performance or cause errors.
To monitor for suspicious subtask status changes during normal operations, we recommend using CloudWatch Logs instead. The following CloudWatch Logs Insights query extracts all subtask state transitions:
How Managed Service for Apache Flink minimizes processing downtime
We have seen how Flink is designed for strong consistency. To guarantee exactly-once state consistency, Flink temporarily stops the processing to deploy any changes, including scaling. This downtime is required for Flink to take a consistent copy of the application state and save it in a savepoint. After the change is deployed, the job is restarted from the savepoint, and there is no data loss. In Managed Service for Apache Flink, updates are fully managed. When snapshots are enabled, UpdateApplication automatically stops the job and uses snapshots (based on Flink’s savepoints) to retain the state.
Flink guarantees no data loss. However, your business requirements or Service Level Objectives (SLOs) might also impose a maximum delay for the data received by downstream systems, or end-to-end latency. This delay is affected by the processing downtime, or the time the job doesn’t process data to allow Flink deploying the change.With Flink, some processing downtime is unavoidable. However, Managed Service for Apache Flink is designed to minimize the processing downtime when you deploy a change.
We have seen how the service runs your application in a dedicated cluster, for complete isolation. When you issue UpdateApplication on a RUNNING application, the service prepares a new cluster with the required amount of resources. This operation might take some time. However, this doesn’t affect the processing downtime, because the service keeps the job running and processing data on the original cluster until the last possible moment, when the new cluster is ready. At this point, the service stops your job with a savepoint and restarts it on the new cluster.
During this operation, you are only charged for the number of KPU of a single cluster.
The following diagram illustrates the difference between the duration of the update operation, or the time the application status is UPDATING, and the processing downtime, observable from the job status, visible in the Flink Dashboard.
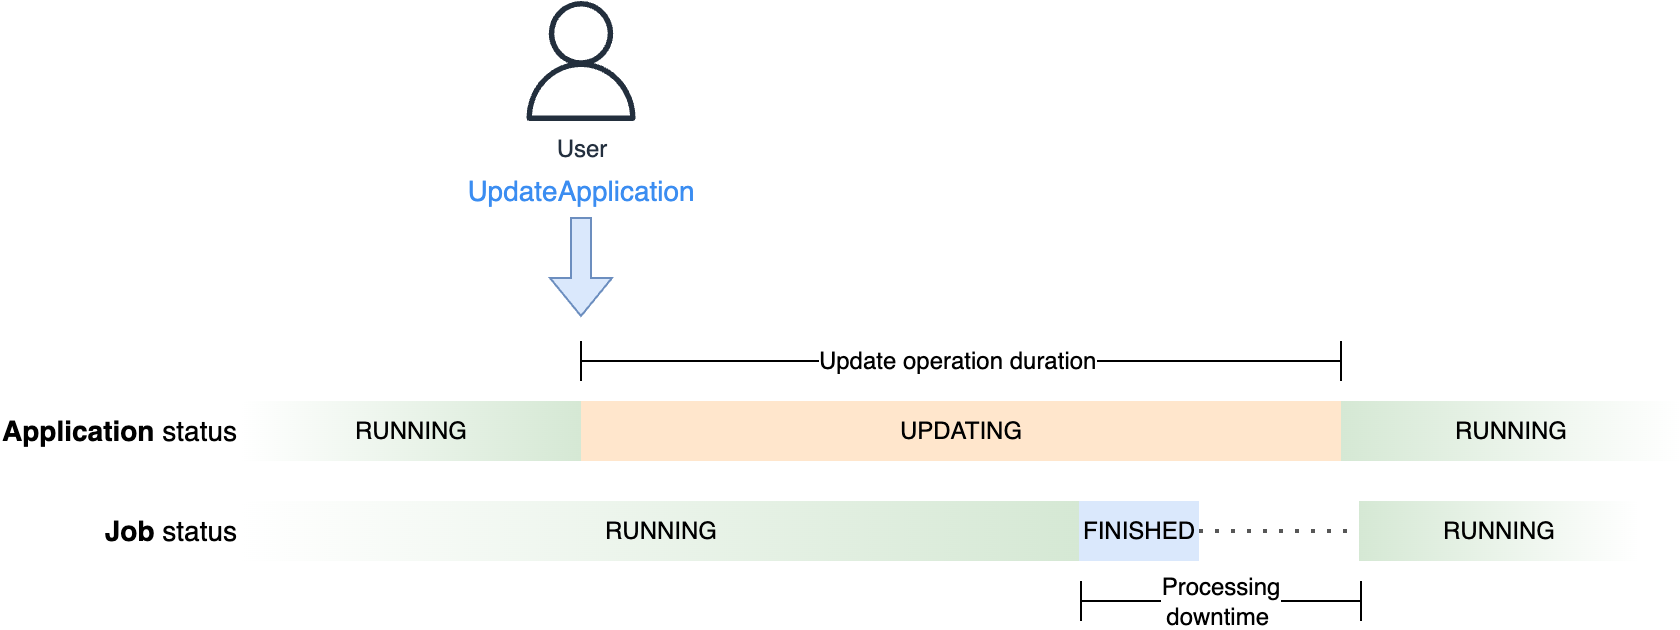
You can observe this process, keeping both the application console and Flink Dashboard open, when you update the configuration of a running application, even with no changes. The Flink Dashboard will become temporarily unavailable when the service switches to the new cluster. Additionally, you can’t use the script we provided to check the job status for this scope. Even though the cluster keeps serving the Flink Dashboard until it’s tore down, the CreateApplicationPresignedUrl action doesn’t work while the application is UPDATING.
The processing time (the time the job is not running on either clusters) depends on the time the job takes to stop with a savepoint (snapshot) and restore the state in the new cluster. This time largely depends on the size of the application state. Data skew might also affect the savepoint time due to the barrier alignment mechanism. For a deep dive into the Flink’s barrier alignment mechanism, refer to Optimize checkpointing in your Amazon Managed Service for Apache Flink applications with buffer debloating and unaligned checkpoints, keeping in mind that savepoints are always aligned.
For the scope of your automation, you normally want to wait until the job is back up and running and processing data. You normally want to set a timeout. If both the application and job don’t return to RUNNING within this timeout, something probably went wrong and you might want to raise an alarm or force a rollback. This timeout should consider the entire update operation duration.
Conclusion
In this post, we discussed possible failure scenarios when you deploy a change or scale your application. We showed how Managed Service for Apache Flink rollback functionalities can seamlessly bring you back to a safe place after a change went wrong. We also explored how you can automate monitoring operations to observe application, job, and subtask status, and how to use the fullRestarts metric to detect when the job is in a fail-and-restart loop.
For more information, see Run a Managed Service for Apache Flink application, Implement fault tolerance in Managed Service for Apache Flink, and Manage application backups using Snapshots.