AWS Big Data Blog
Trace cascading decision failures with a blame graph on Amazon OpenSearch Service
Multi-agent systems are straightforward to build but hard to debug. You chain a few agents together, each one does its part, and most of the time it works. When it doesn’t, you’re left with a large volume of logs. They tell you what every agent said, but nothing about which agent caused the bad outcome.
Working with AWS customers building multi-agent systems, we kept seeing the same problem. A pipeline of agents decides, the decision turns out wrong, and no one can say which agent caused it. The logs are complete, but they don’t answer that question. So we, two AWS Solutions Architects, built a stock-research pipeline to reproduce it and show a solution approach.
Five agents work in sequence, and the last one makes a BUY, SELL, or HOLD call. In our test cases, the agent kept recommending BUY, and the positions kept losing money. Every step was logged. The logs still didn’t tell us who broke the pipeline.
In this post, we show you how to build a blame graph that traces which agent caused a failure in a multi-agent pipeline, using Amazon OpenSearch Service for graph storage and Amazon Bedrock for embeddings and reasoning.
Prerequisites
You must have the following prerequisites to follow along with this post.
- Download the source code from the GitHub repository: It includes everything needed to set up and run the demo end to end:
- The five-agent pipeline.
- The instrumentation layer.
- AWS CloudFormation template.
- OpenSearch UI dashboard export
- Sample data.
- Step-by-step setup instructions (README.md, DEPLOYMENT.md).
- An AWS account with access to Amazon Bedrock (Anthropic Claude Sonnet 4.5 and Amazon Titan Text Embeddings V2 enabled in us-west-2).
- An OpenSearch Service domain.
- Python 3.11+.
- AWS Command Line Interface (AWS CLI) v2 configured with valid credentials.
The challenge
The pipeline is a chain of five agents. A Researcher gathers the facts, a Risk Analyst weighs the downside, a Valuation Analyst runs the numbers, and a Macro Economist sets up the market backdrop. Each one builds on the output of the agents before it. The Strategist (AI agent) sits at the end and turns all of it into a single call: BUY, SELL, or HOLD.
We set up three failures, each one a pattern common in production agent deployments (hallucinated facts from retrieval, suppressed minority signals, stale data from delayed ingestion):
- A hallucination. The Researcher invents a company partnership that doesn’t exist.
- A buried warning. The Risk Analyst flags a regulatory risk and gets outvoted.
- Stale data. The Researcher misses a filing published three days earlier.
We engineered each failure deterministically, so the demo is reproducible and has a known answer. For each scenario, we hand-authored the five agents’ outputs as fixed JavaScript Object Notation (JSON). The pipeline replays these outputs while the instrumentation computes embeddings, influence, and blame live. We recorded a ground-truth root cause (for example, researcher for hallucination).
In every case, the pipeline recommends BUY, and the position drops. Standard logging records each agent’s output, but it can’t tell you which claim drove the final decision. Closing the gap between logging and root-cause attribution is what we set out to do.
Solution
We treat agent reasoning as a graph and measure influence between agents, then walk that graph backward from the failed decision to find the root cause.
Three services make up the stack:
- Strands Agents runs the five-agent pipeline.
- Amazon Bedrock provides the models: Amazon Titan Text Embeddings V2 to embed each claim, and Anthropic Claude Sonnet 4.5 for agent reasoning and the incident write-up.
- An OpenSearch UI application, an analytics interface hosted in the AWS Cloud with a single endpoint, connects to the domain as a data source and serves the dashboard, Discover, and the Dev Tools console we use to investigate.
Here is how blame attribution works. Every claim an agent makes becomes a document with an Amazon Titan embedding. When a downstream agent cites something, we measure the cosine similarity between that citation and each upstream claim. Cosine similarity becomes the influence one agent had on another.
We store these as edges. To find the root cause, we start at the failed decision and walk backward through the edges. Whoever contributed the most gets the most blame.
Alongside the graph we record three things per run: an explainability score for how much of the decision traces back to evidence, the confidence of the attribution, and whether a dissenting agent was overruled.
A note on method: there is no industry standard yet for root-cause attribution in multi-agent large language model (LLM) pipelines. Our approach combines two established ideas: a credit assignment (attributing an outcome to the steps that produced it) and embedding similarity for tracing how claims propagate, with an LLM-as-a-judge style check. The metrics here (influence, explainability) are pragmatic, reproducible measures we define in this post, not standardized benchmarks.
Architecture
Five parts make up the flow:
- Agents run on the Strands Agents, with reasoning on Claude Sonnet 4.5.
- An instrumentation layer extracts each claim, embeds it with Amazon Titan Text Embeddings V2, scores influence with cosine similarity, runs the backward traversal, and generates an incident report.
- Amazon OpenSearch Service holds seven indices, including the claims index with k-nearest neighbor (kNN) vectors and the blame, metrics, and incident indices.
- Analysts review the results in the OpenSearch UI application (the dashboard, Discover, and the Dev Tools console), launched from the Amazon OpenSearch Service console.
- We use OpenSearch UI rather than the domain’s built-in dashboards. Because OpenSearch UI is hosted in the AWS Cloud, the application stays available during domain maintenance and can bring multiple data sources into one view. The pipeline still writes to the domain, and OpenSearch UI reads it as a registered data source.
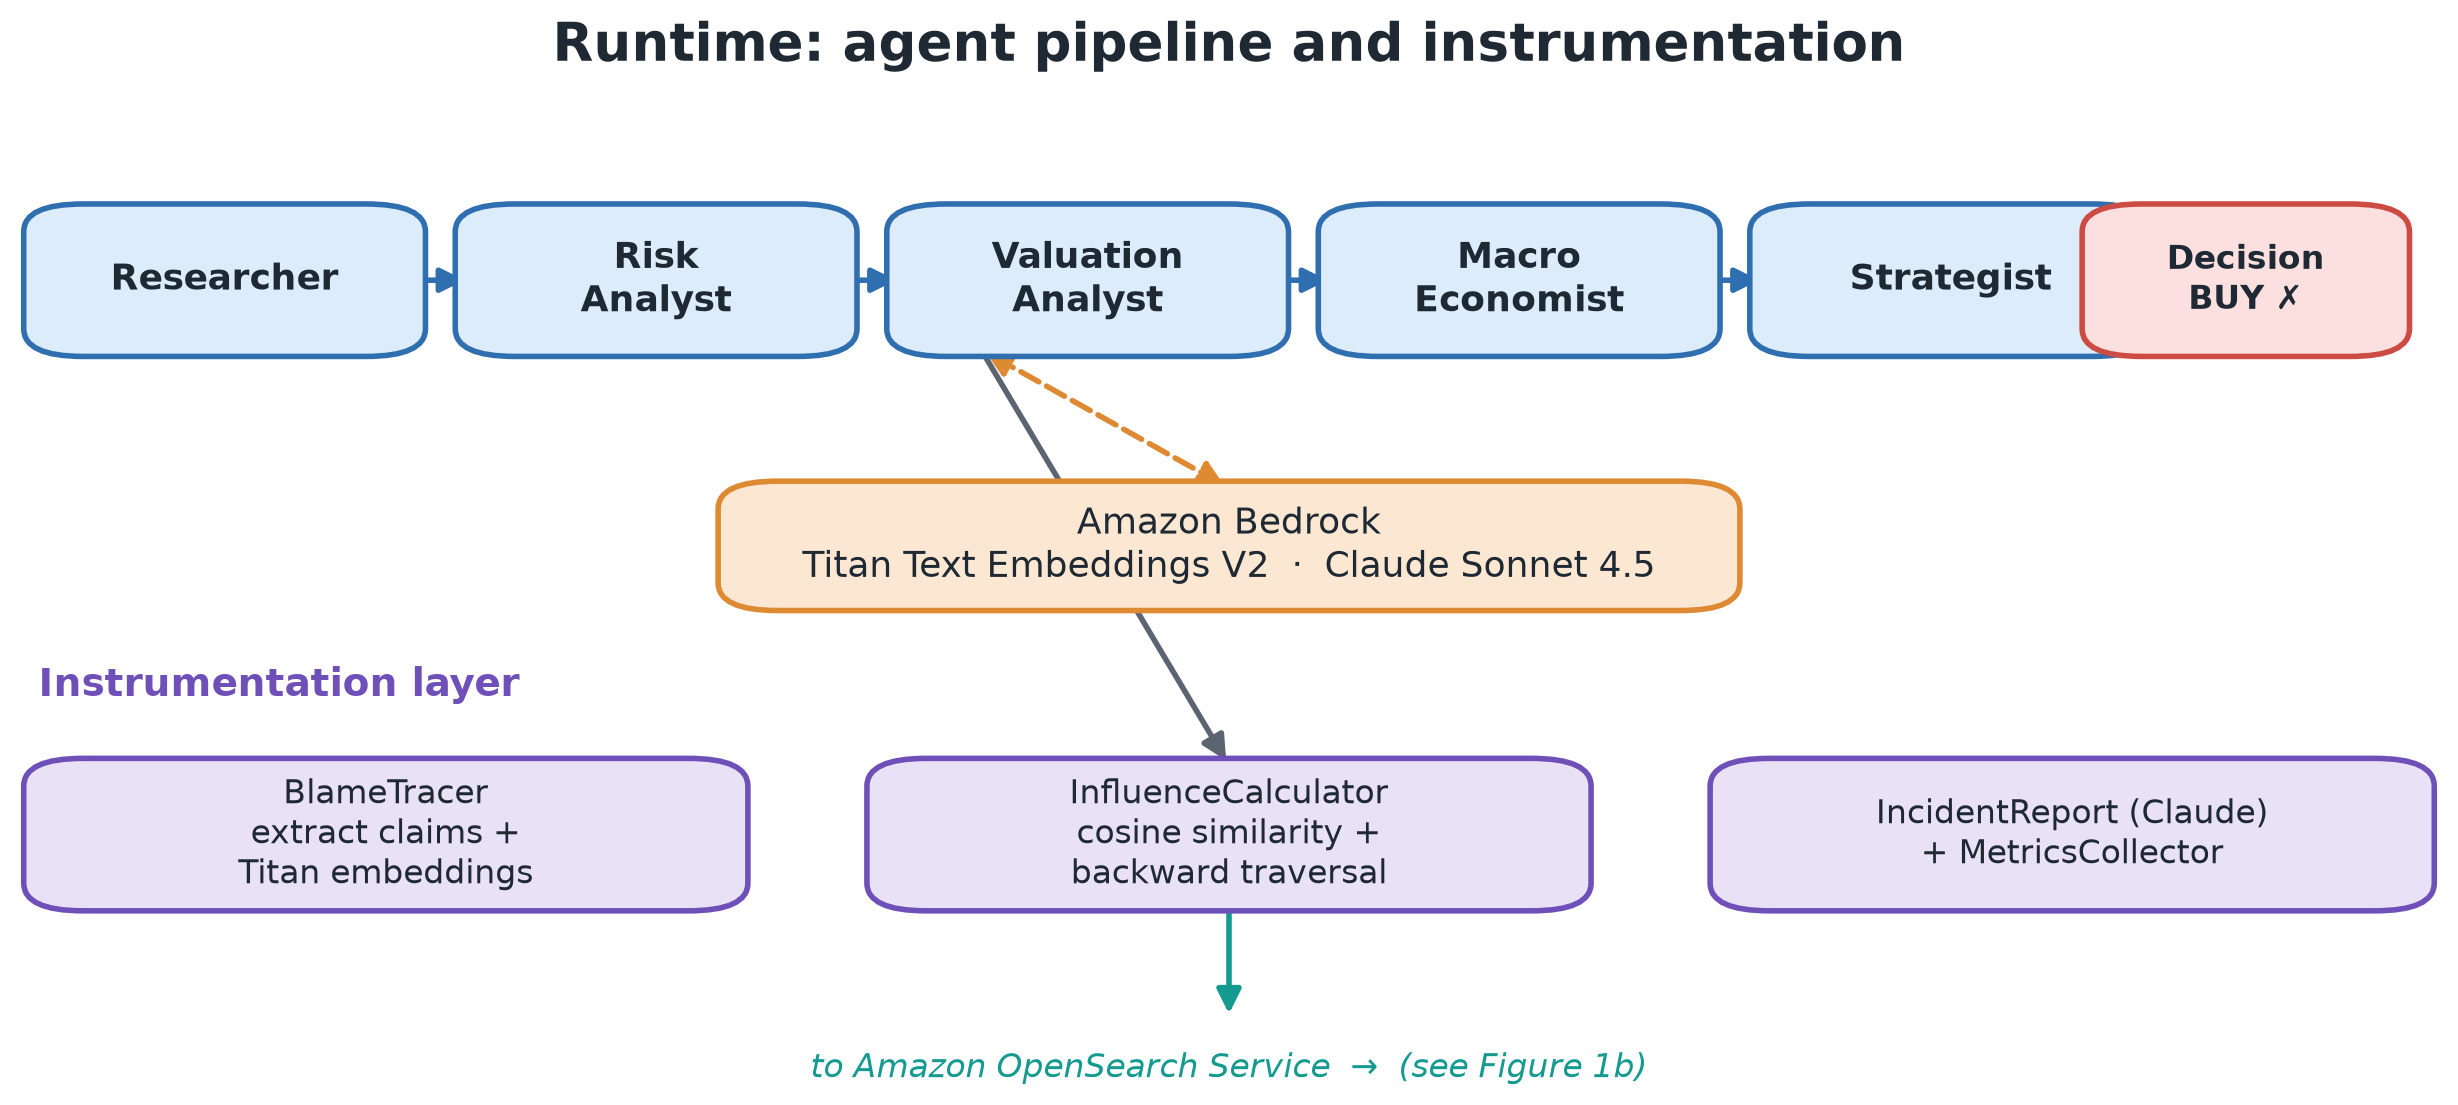
Figure 1a: The five-agent runtime pipeline
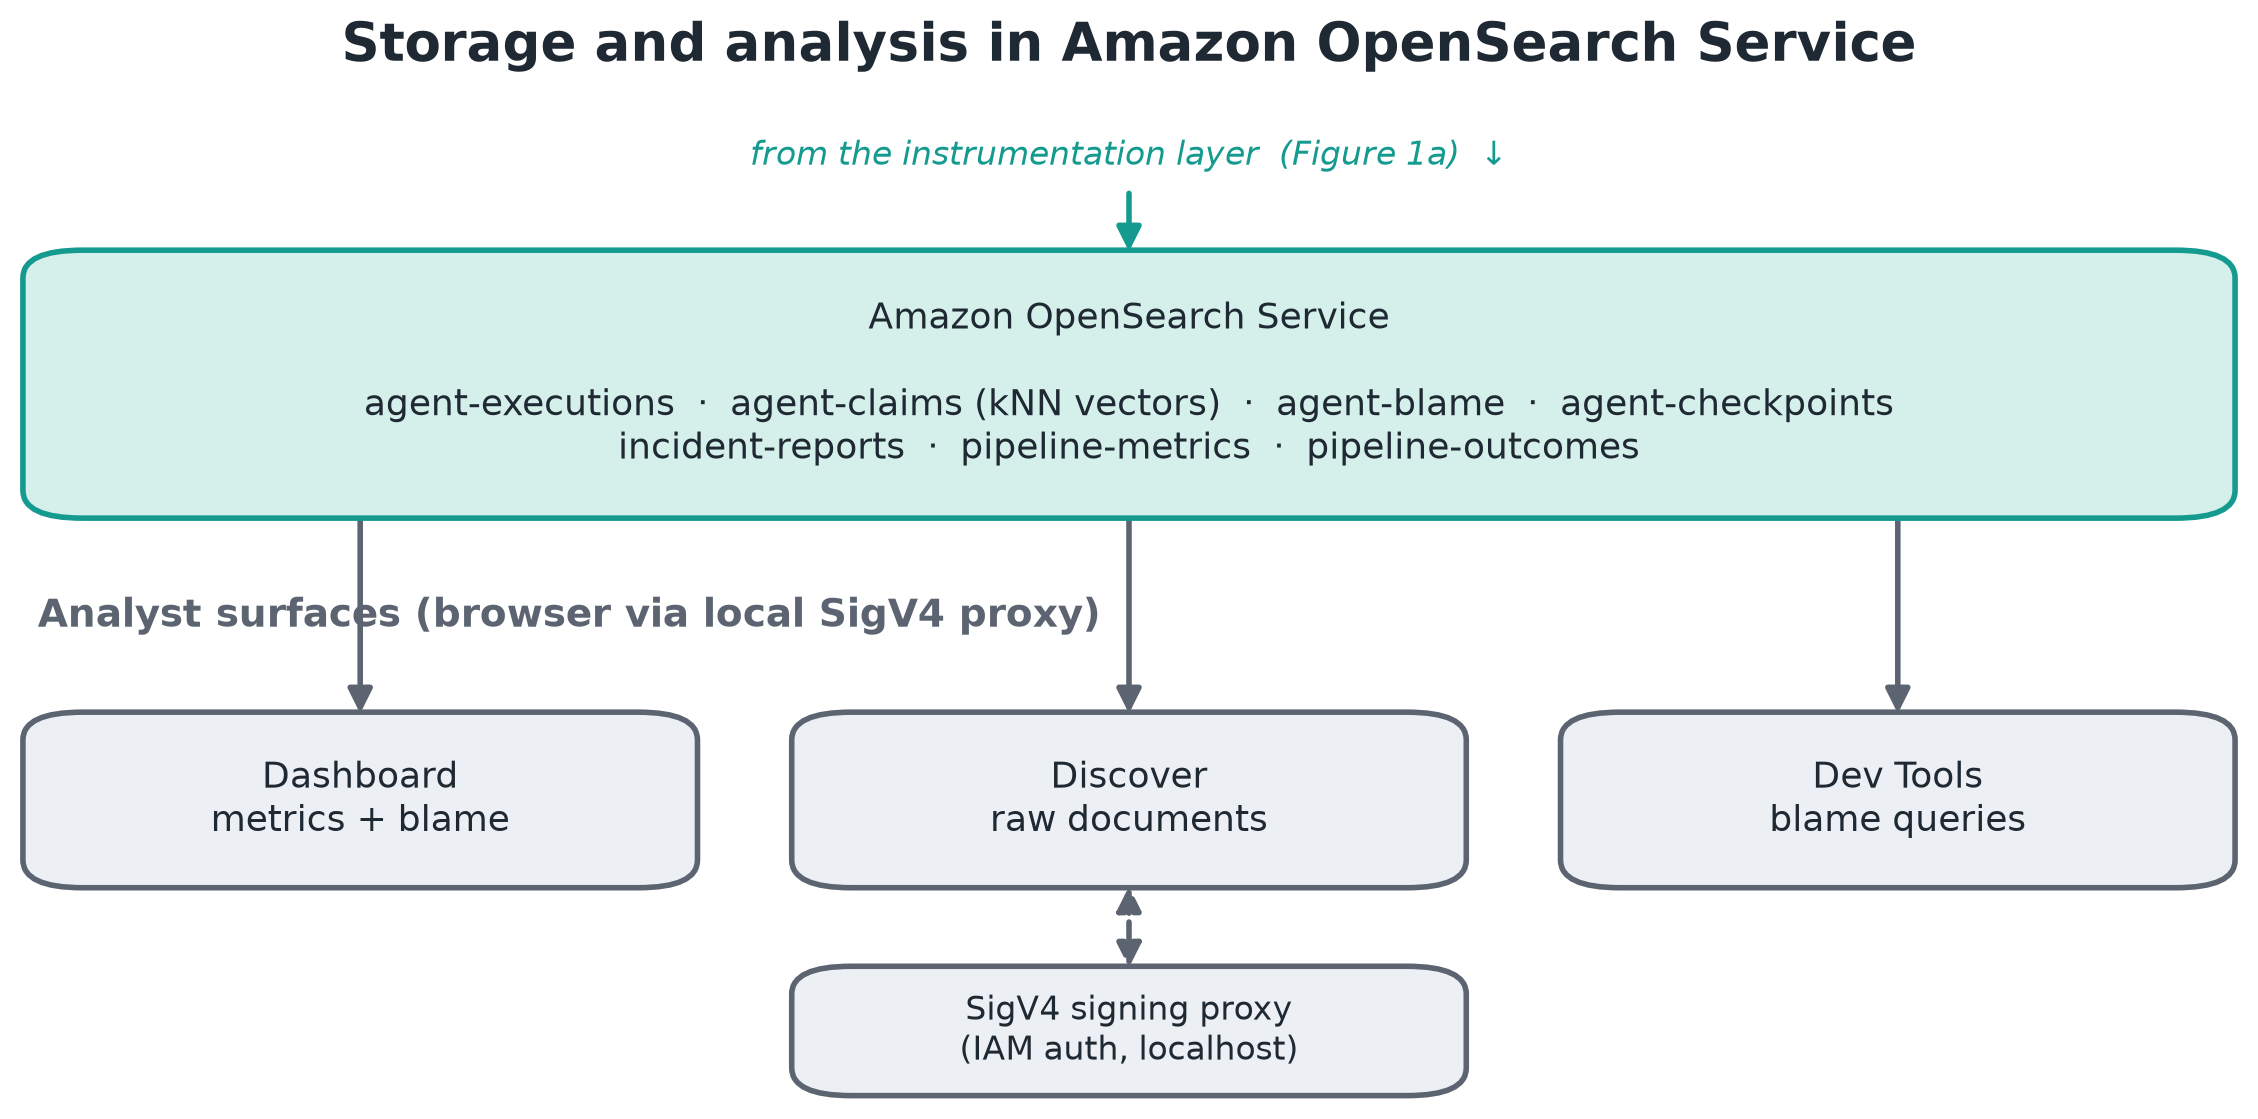
Figure 1b: The instrumentation and OpenSearch Service data plane
Walking through a failure
We ran the pipeline nine times, three runs per scenario, on an Amazon OpenSearch Service domain running OpenSearch 2.17. The decision under investigation is the final BUY. We know it failed because each scenario carries a ground-truth outcome: the position lost money. The failure is the known bad outcome we trace backward from, not something the system infers. Everything the pipeline produces is a document you can query, so the investigation is a series of queries we run from the Dev Tools console in the OpenSearch UI application.
To follow along, launch the OpenSearch UI application from the Amazon OpenSearch Service console, open your workspace, and choose Dev Tools (near the bottom of the left navigation panel). Paste each query below into the left pane and choose the run button. Every query in this section is in the repository at devtools_queries.md, in the same order as the walkthrough, so you can copy them from there instead of retyping. The equivalent queries as Python are in queries.py.
Start with the outcome
Every run is a BUY, and every loss is negative, down to 72 percent. Standard logging stops here. You know it failed, but you don’t know who to fix.
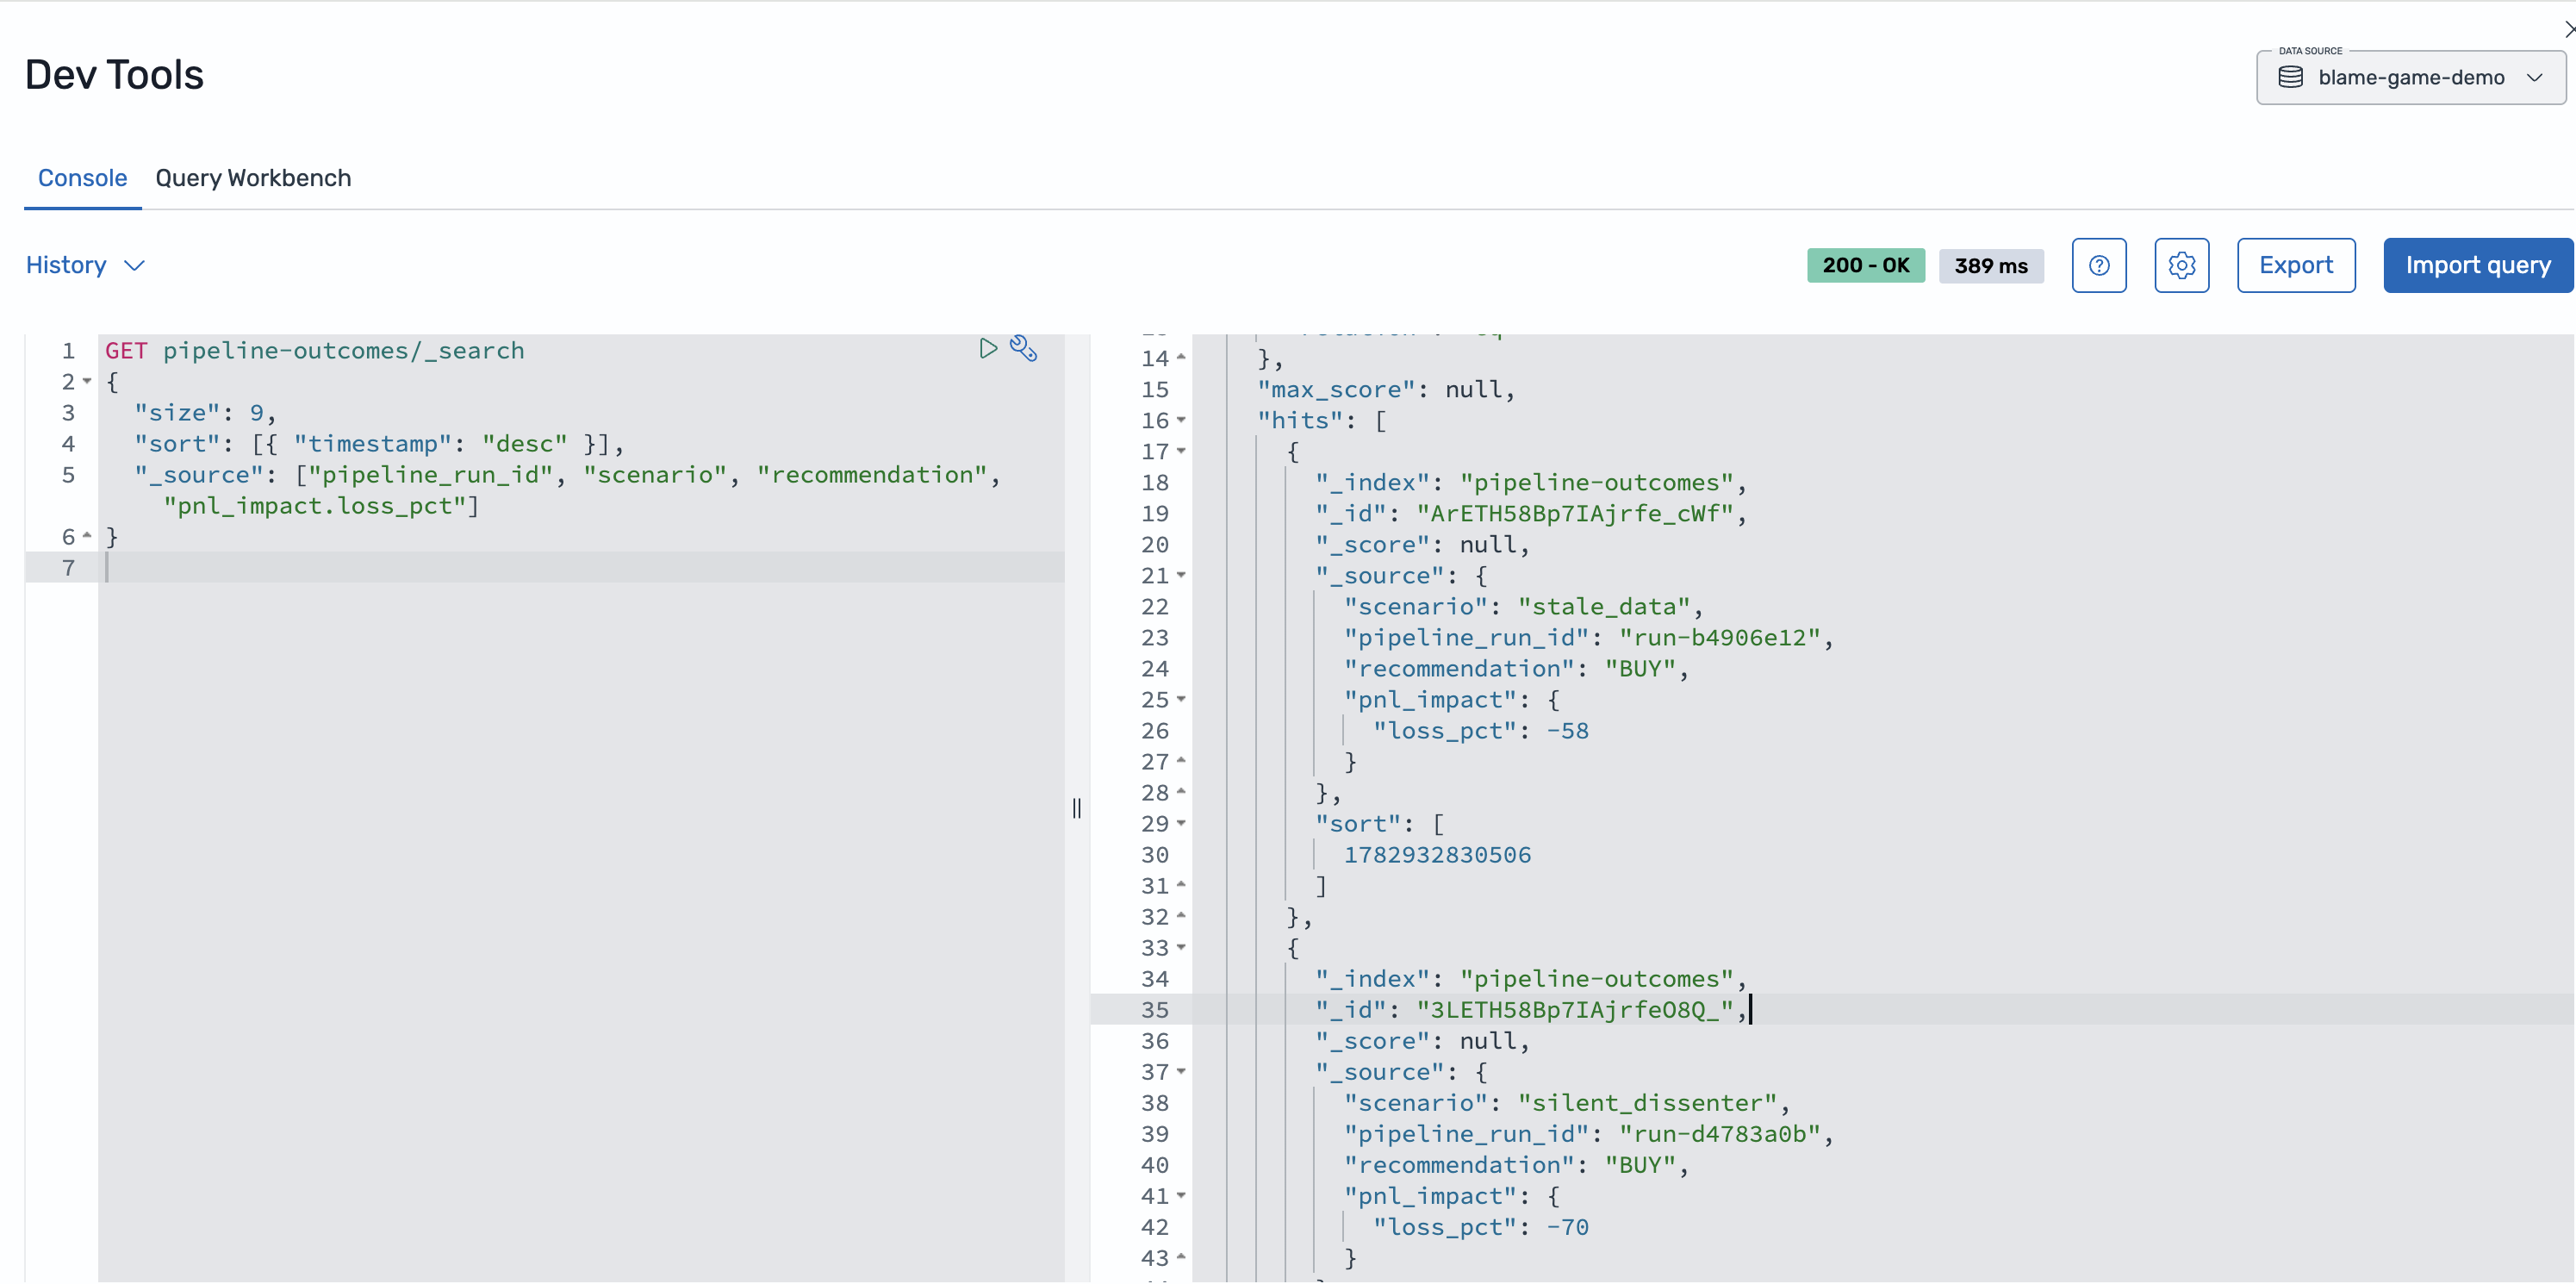
Figure 2: Pipeline run results: all nine runs recommend BUY with losses up to 72%
Next, look at who influenced whom
Among all agents, the Researcher sources the most edges. Nearly every node downstream gets its data from the Researcher, making it the first place to look. A lead, not a verdict.
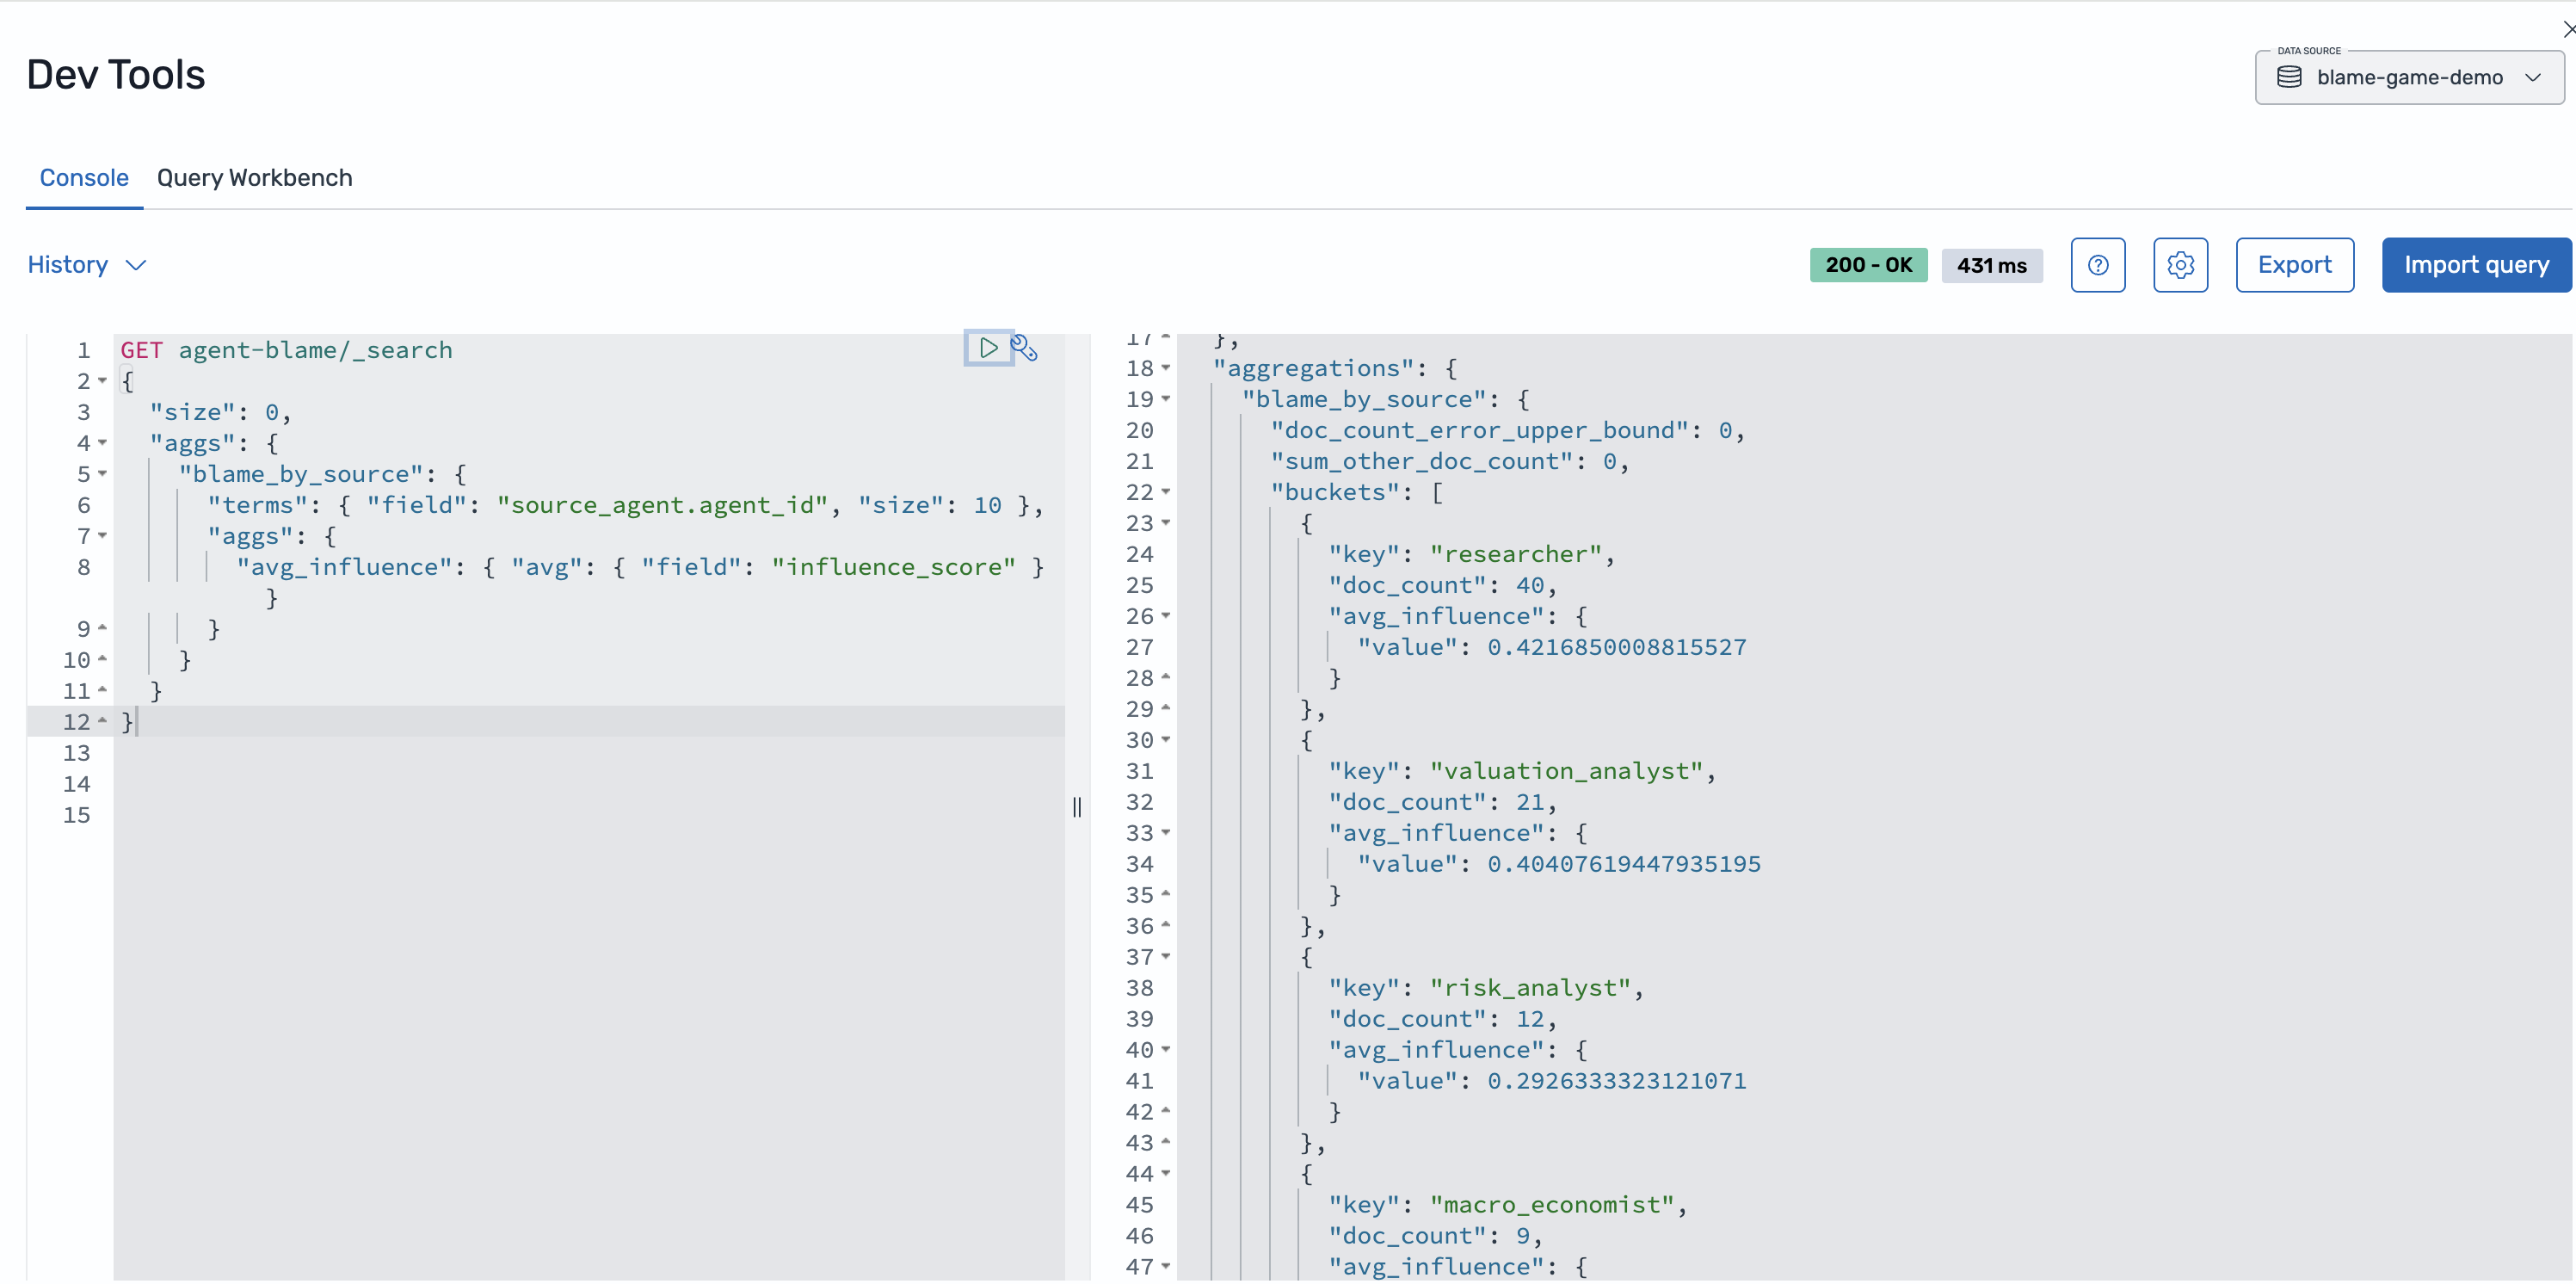
Figure 3: Influence edges aggregated by source agent
Query the blame metrics for each scenario
Blame lands on the Researcher, with a score around 0.45, and the attribution is correct on all three runs. A fabricated partnership flowed straight into the final BUY. Stale-data scenario behaves the same way: the Researcher again, at 0.46, correct.
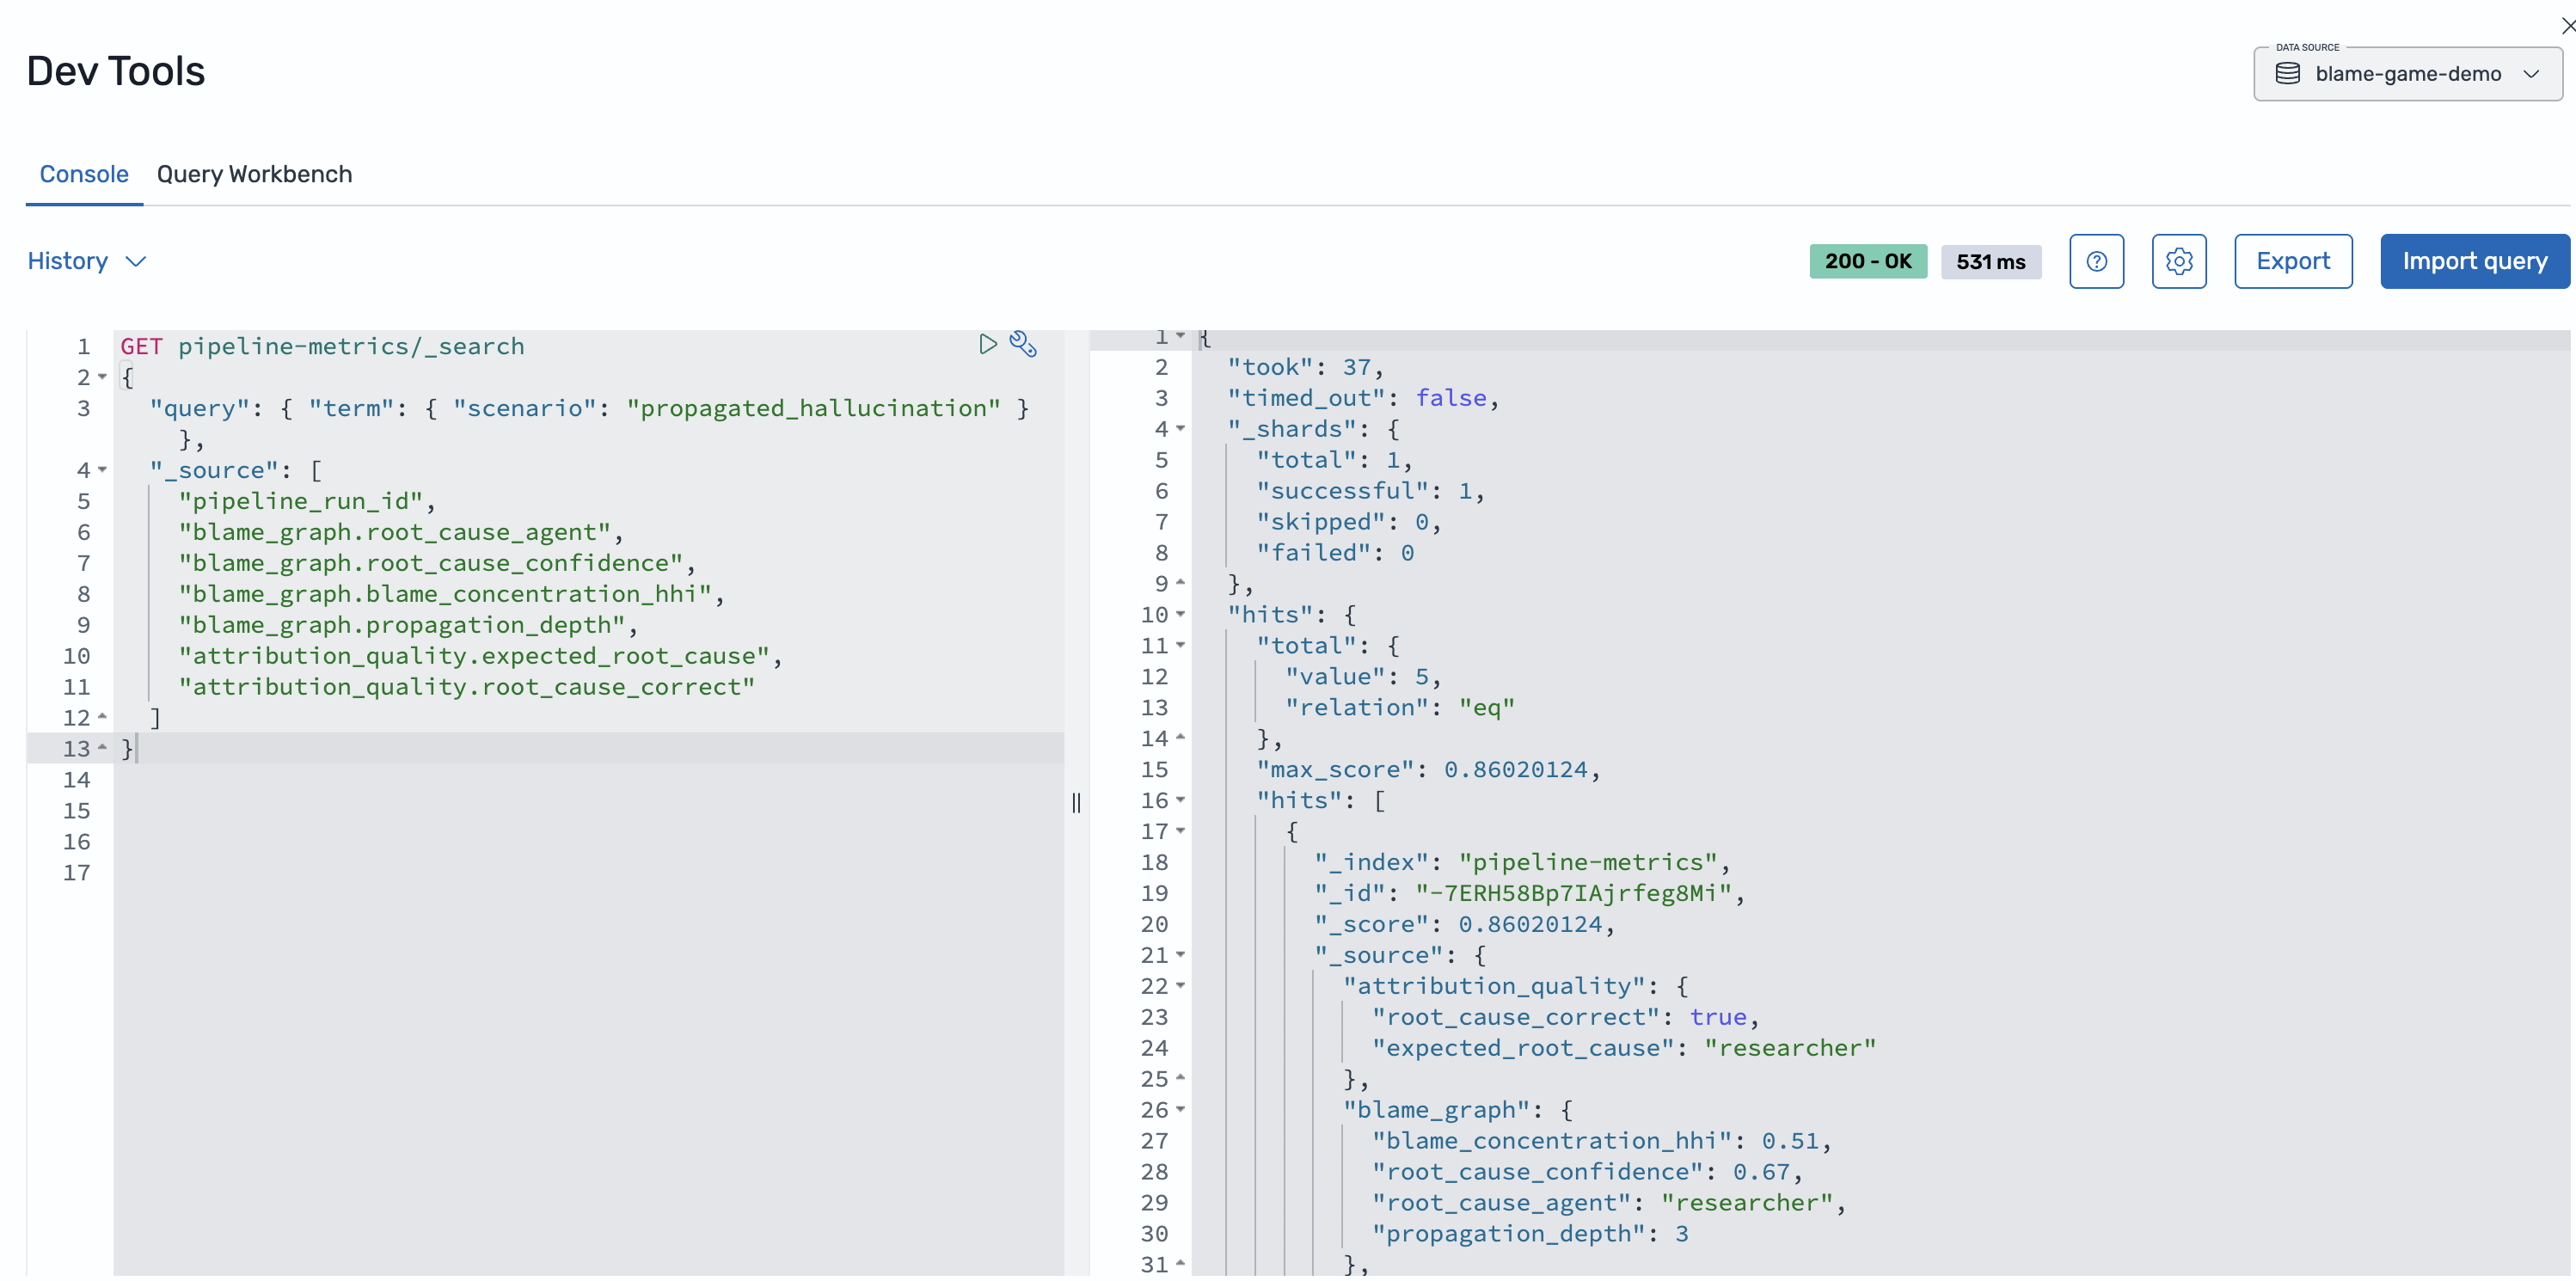
Figure 4: Root cause attribution for hallucination runs
Here are the raw edges in Discover, sorted from highest influence to lowest
In the OpenSearch UI application, choose Discover and select the agent-blame index pattern, then set the time range to Last 30 days and sort by influence_score descending. Each row is one edge- a claim passed from a source agent (source_agent.agent_id) to a downstream agent (target_agent.agent_id), scored by how strongly it shaped that agent’s output. The top rows are the highest-influence edges: the ones that most shaped the final BUY.
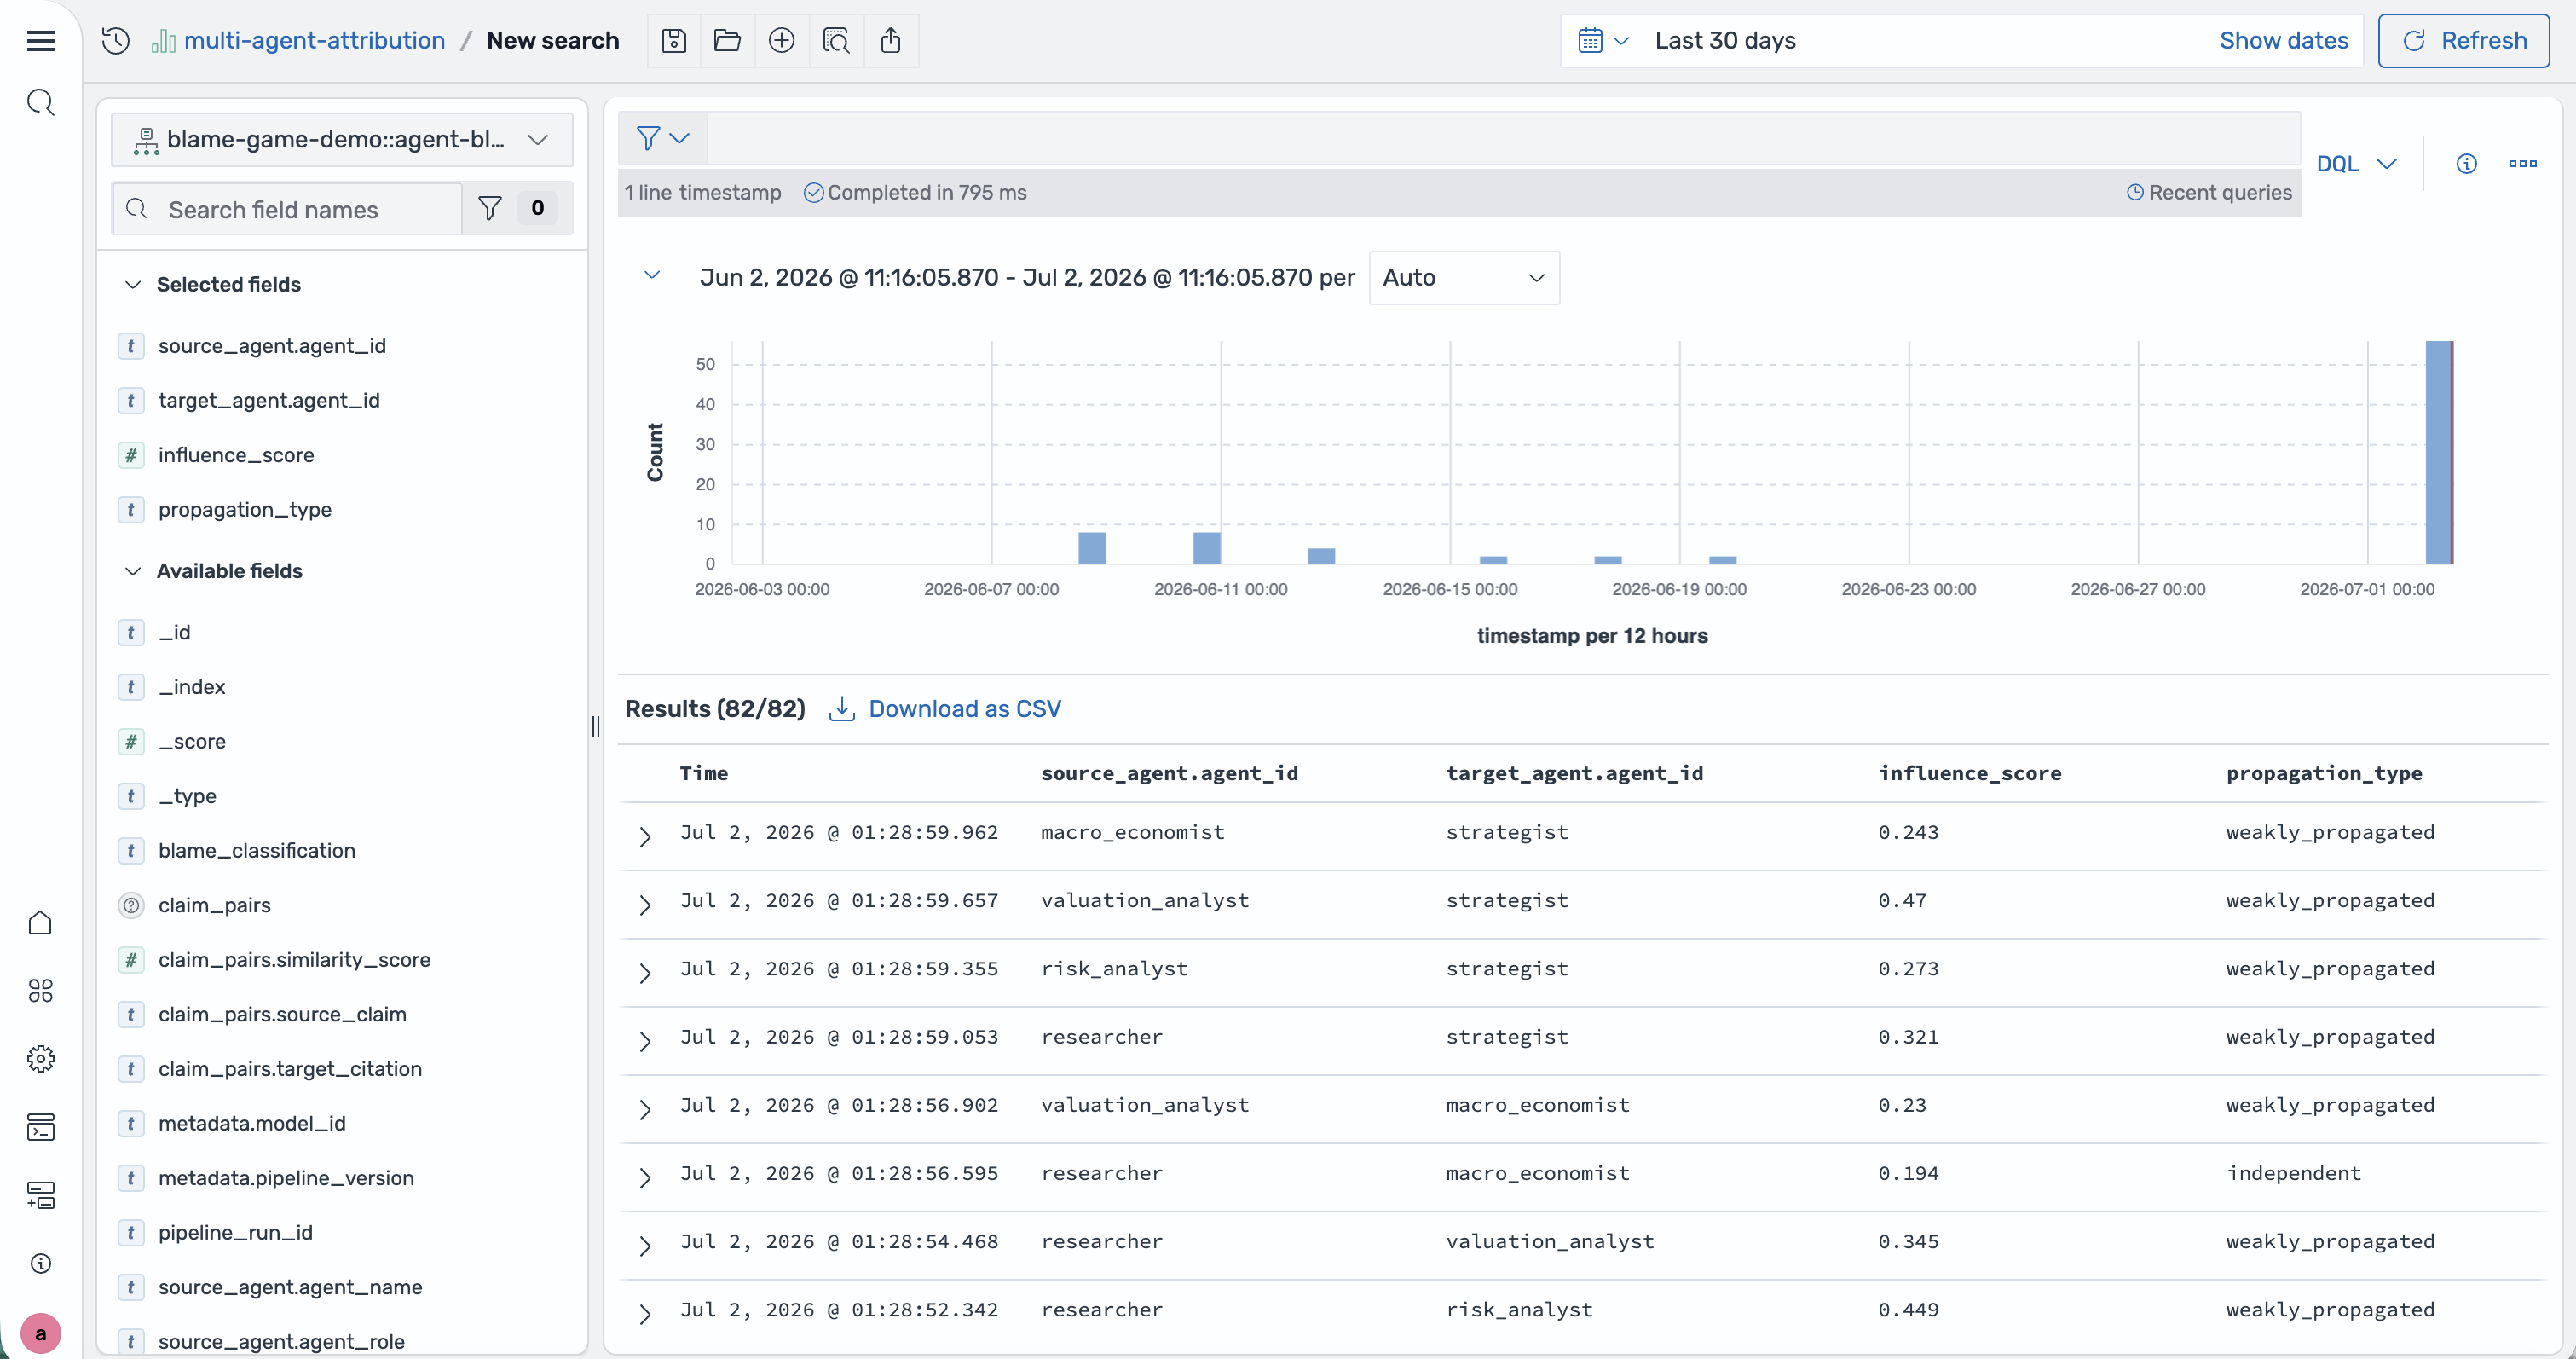
Figure 5: Blame edges sorted by influence score
When attribution is hard
It’s the buried-warning scenario that the graph gets wrong, and it’s the most useful result in the post.
The Risk Analyst was right. It flagged the regulatory risk. The Strategist saw the warning, weighted it at 0.15, and bought it anyway. Who actually failed? The Strategist.
But the blame graph points at the Risk Analyst, with the highest score in that run at 0.37. Why? Our method measures influence, and the dissent is a distinct claim that the method traces directly, so it scores high. Influence is not the same as responsibility.
Why did the Strategist ignore it? In the scenario, the Strategist acknowledged the dissent but reasoned that the strength of the clinical data made the compound “differentiated” from past failures. It weighted that bullish evidence at 0.85 against the Risk Analyst’s 0.15. The Strategist rationalized the warning away instead of treating high-confidence, time-bound regulatory risk as a hard stop. The model recorded that reasoning, which is exactly why we can see how the dissent was discounted.
This gap between influence and responsibility is why we track dissent on our own.
Dissent was present, acknowledged, and weighted at 0.15. A flag catches what the graph misses: a valid warning was heard and then ignored. One signal is not enough. Influence tells you what is propagated. Dissent flags tell you what was wrongly dismissed. You need both.
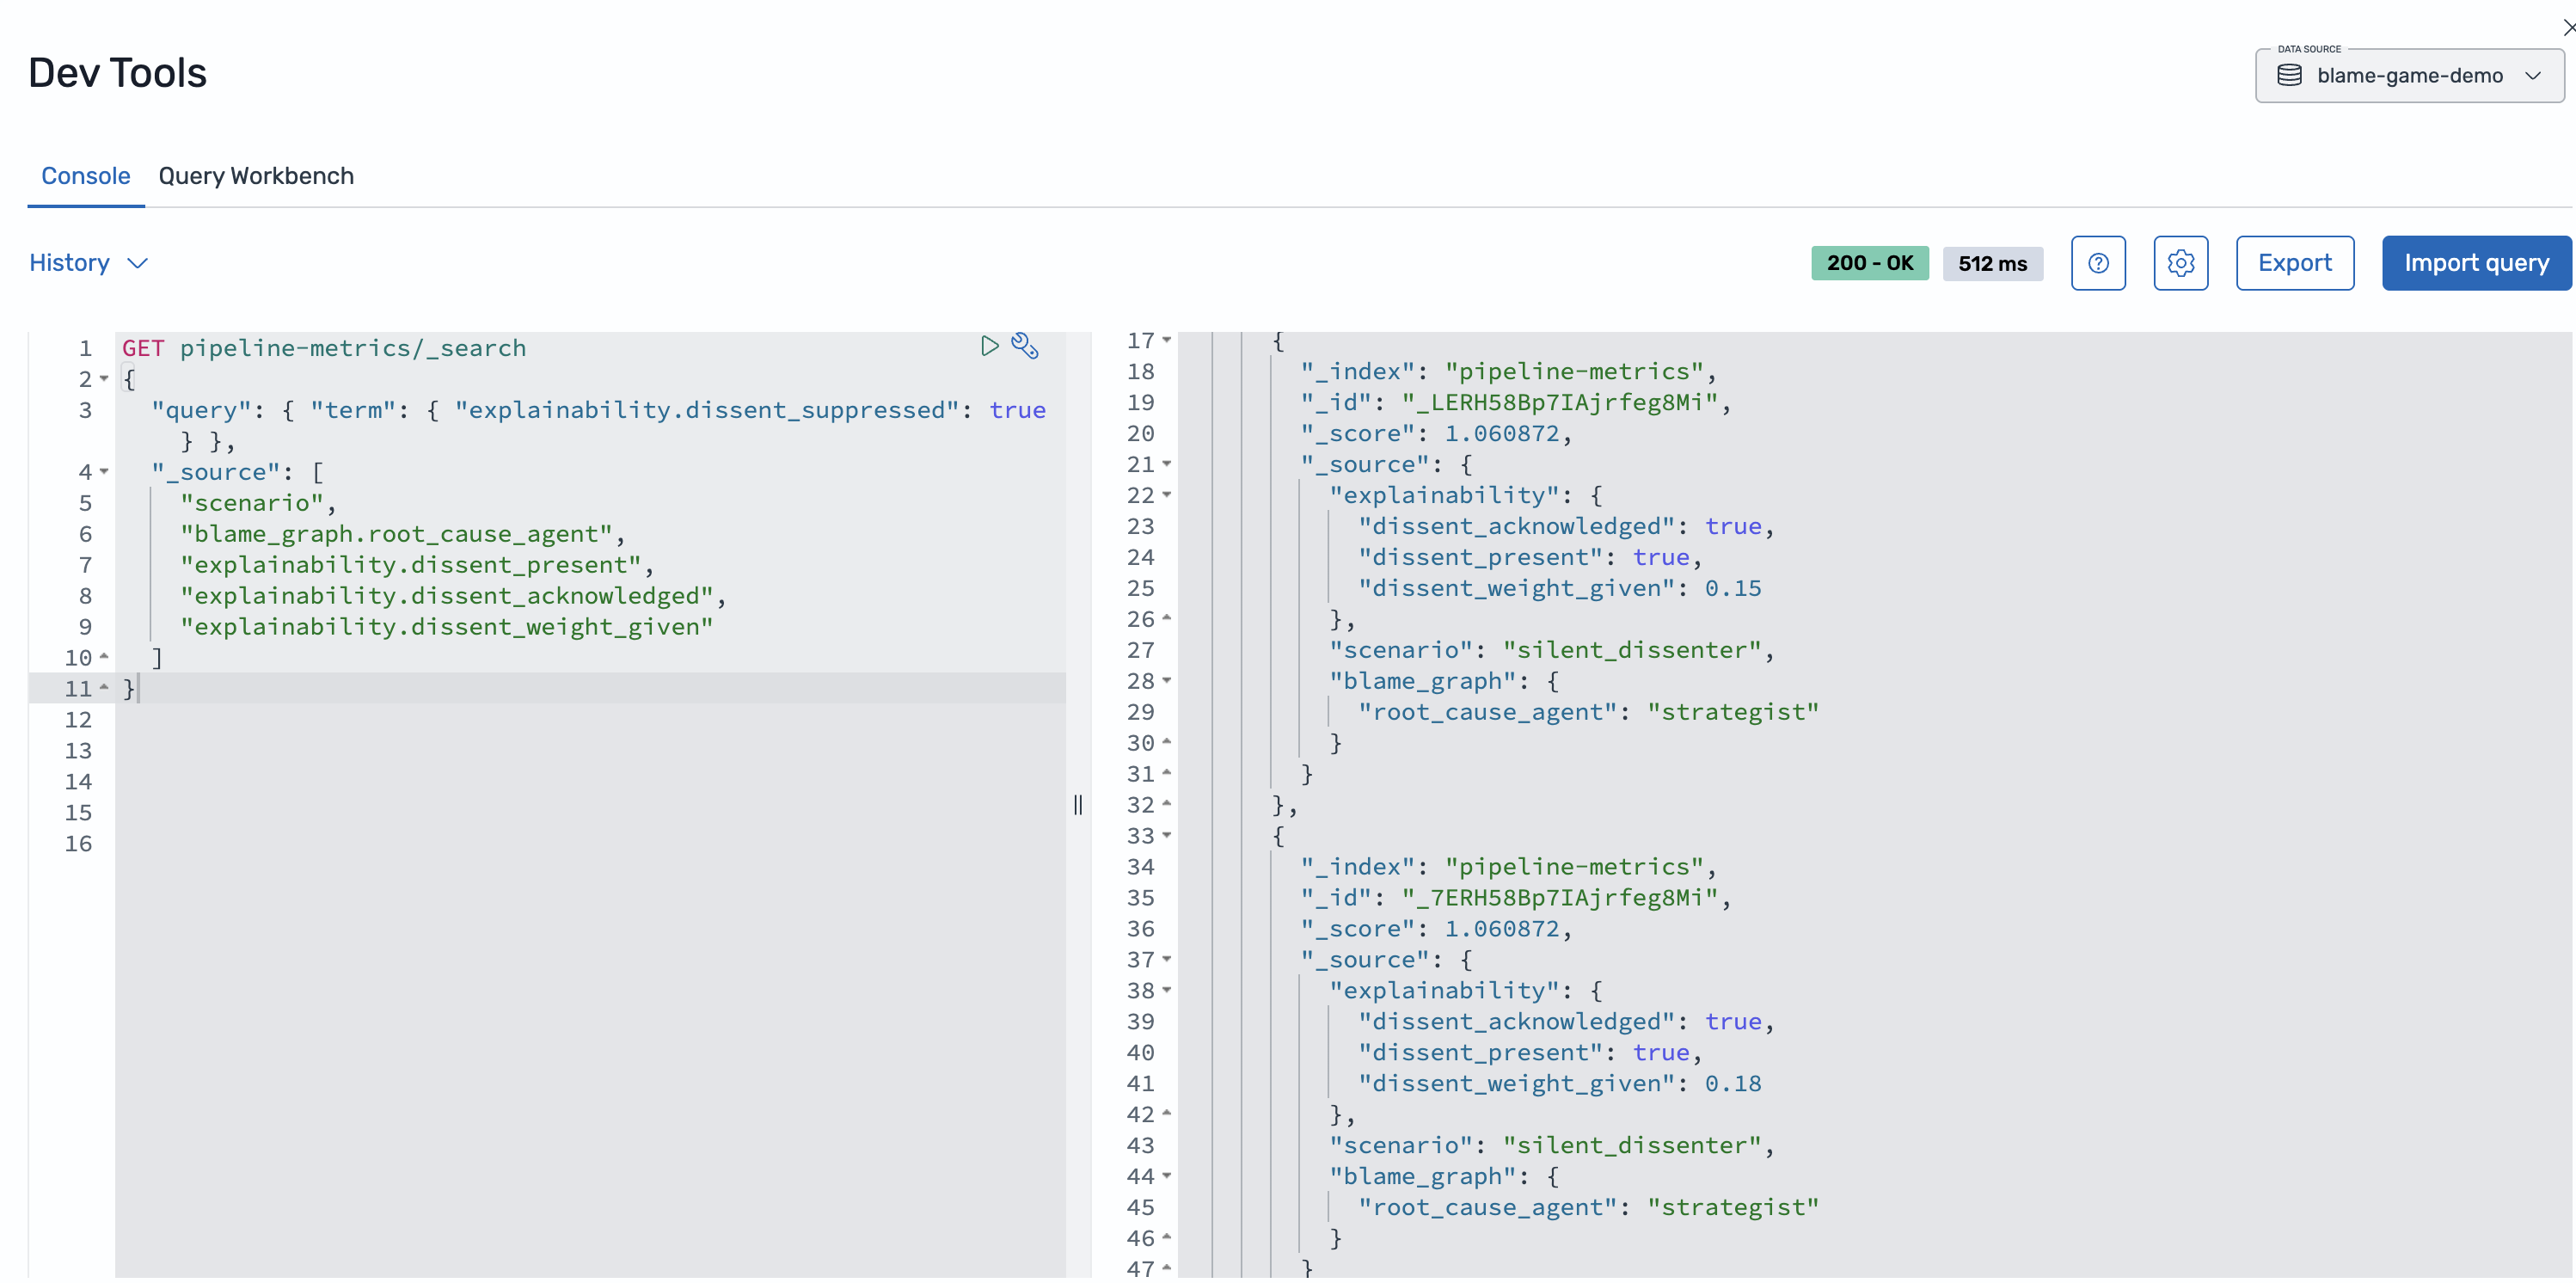
Figure 6: Suppressed dissent detection
Reviewing the metrics dashboard
OpenSearch UI rolls up all nine runs. To open it, launch the OpenSearch UI application, open your workspace, and choose Dashboards in the left navigation, then open the Multi-Agent Blame Game — Observability dashboard. Set the time range to Last 30 days to see all nine runs. If you haven’t imported it yet, go to Manage Workspace and choose Import under Assets. Upload blame-game-dashboard.ndjson from the repository, mapping the index patterns to your domain’s data source.
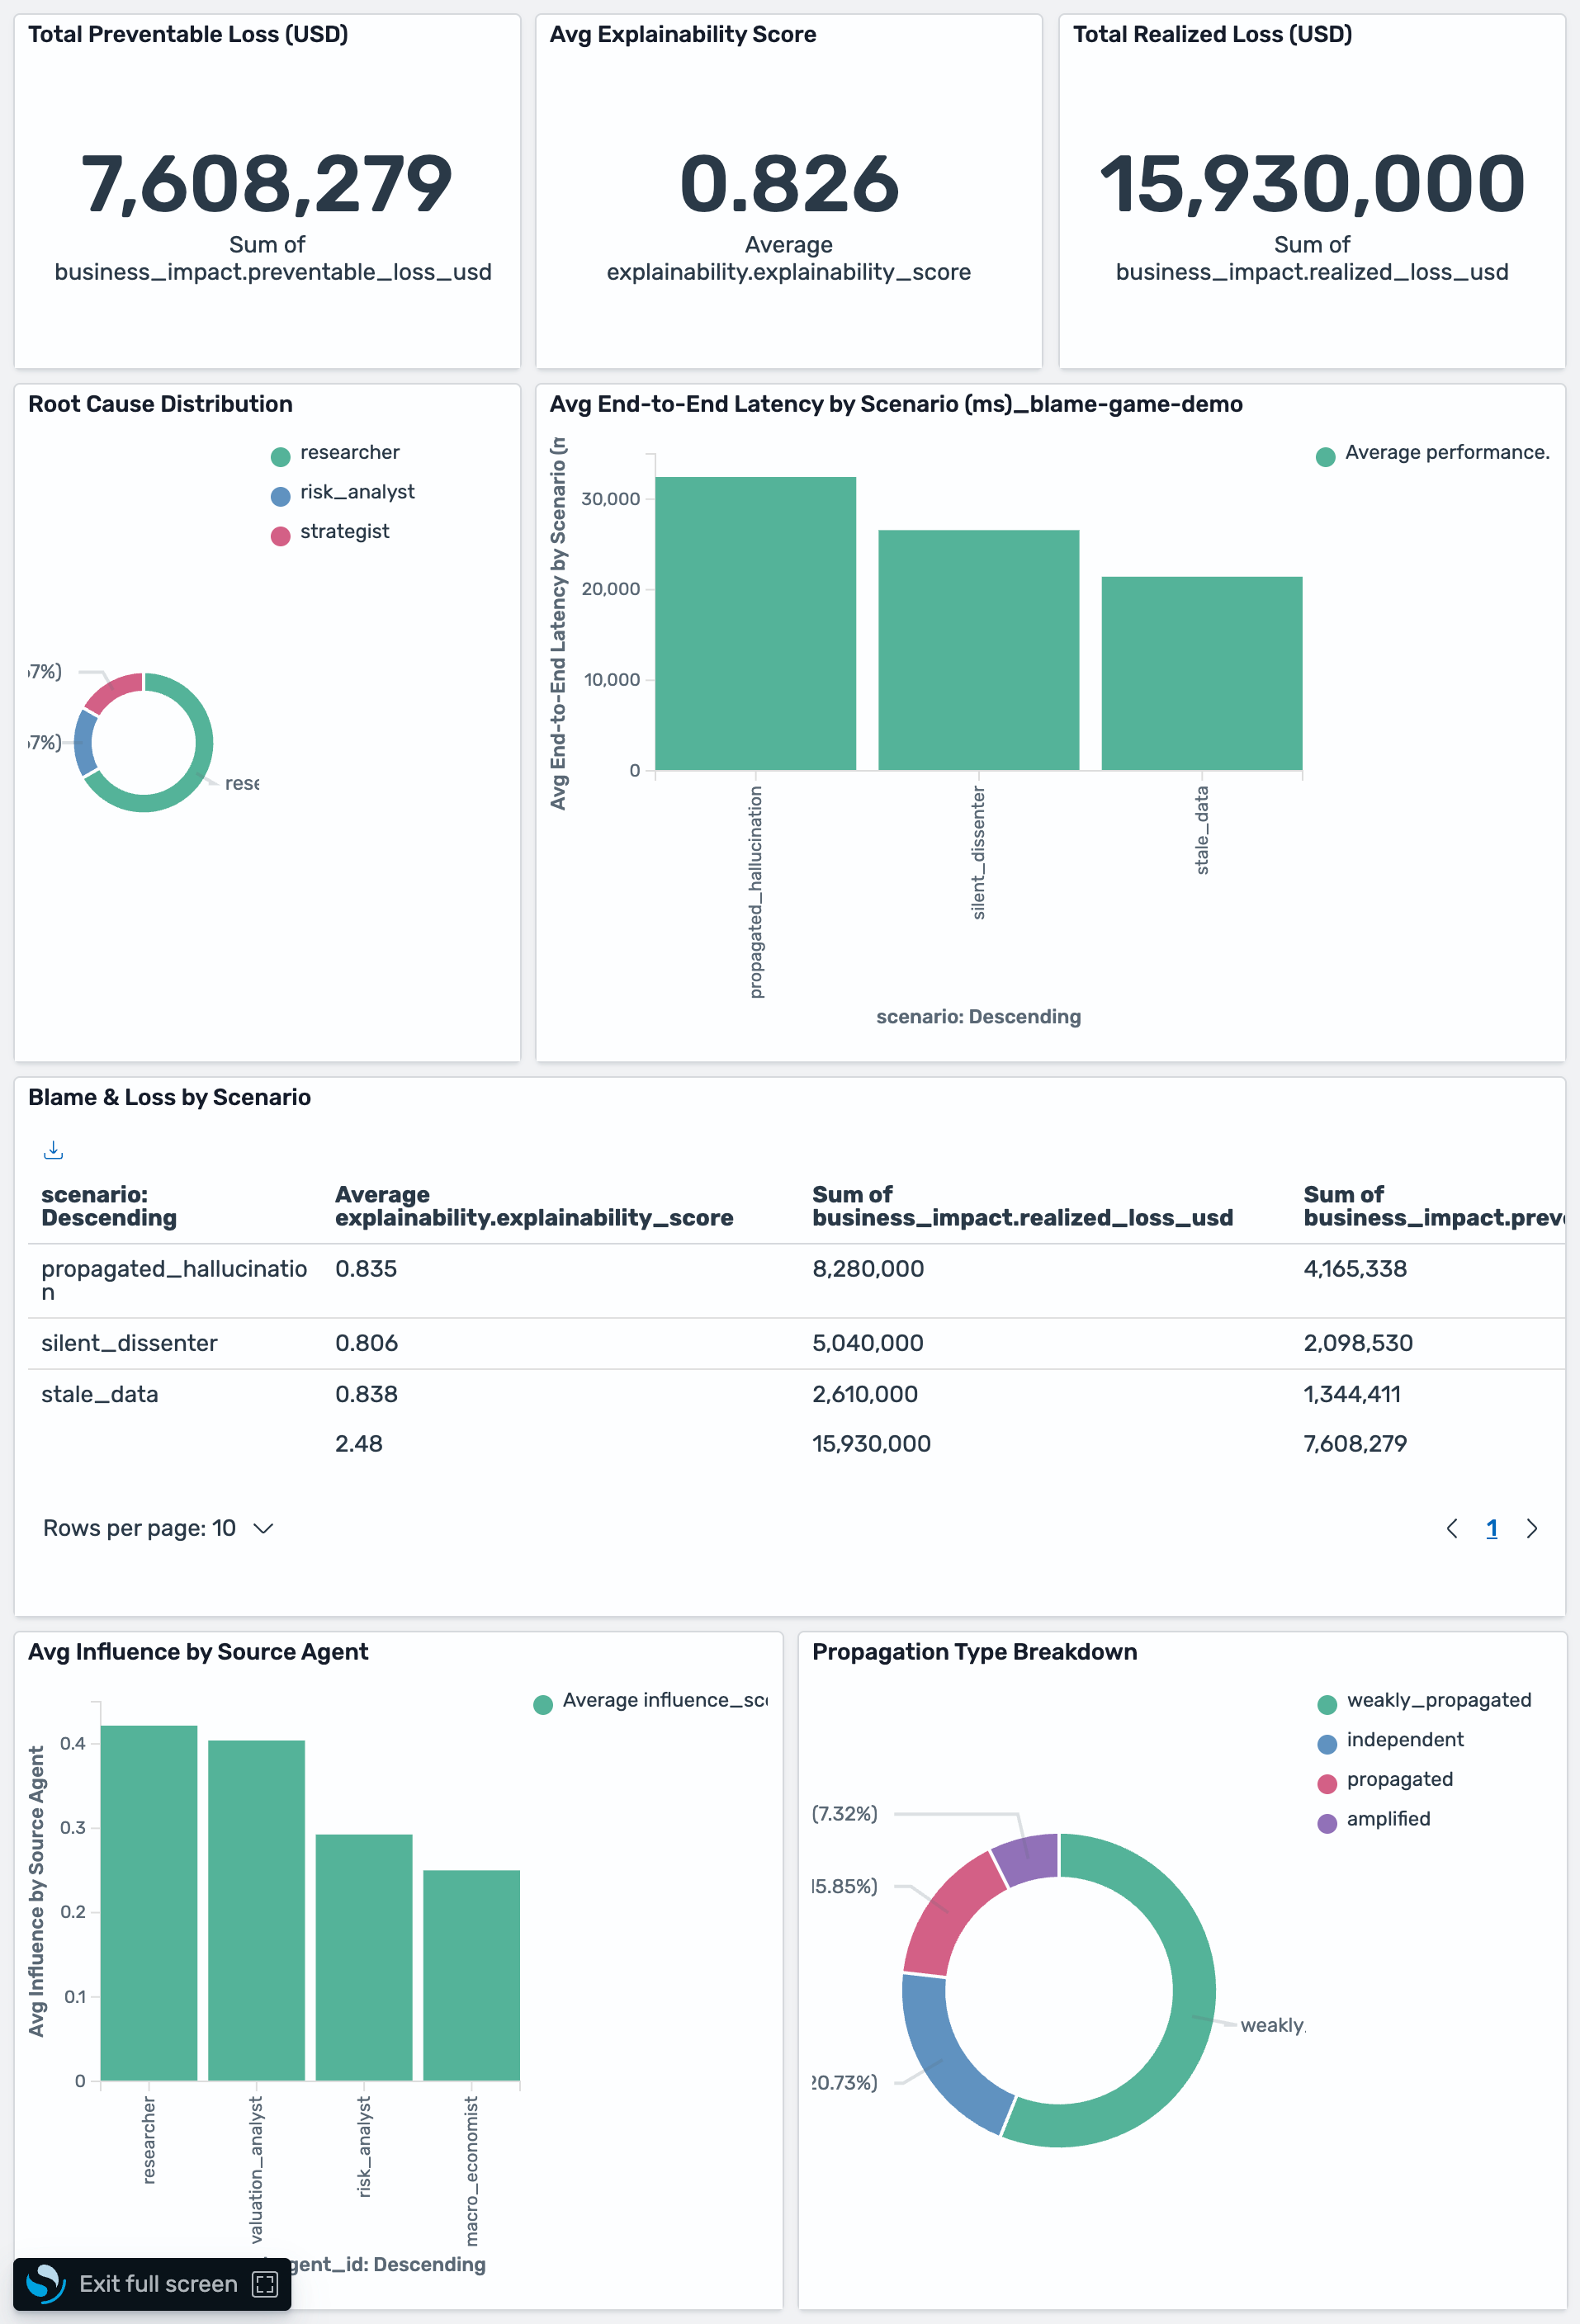
Figure 7: Full metrics dashboard
Each panel earns its place. A few are worth calling out. Root cause distribution flags the Researcher six times and the Risk Analyst three times. That Risk Analyst slice is the dissent misattribution from earlier, not a real culprit.
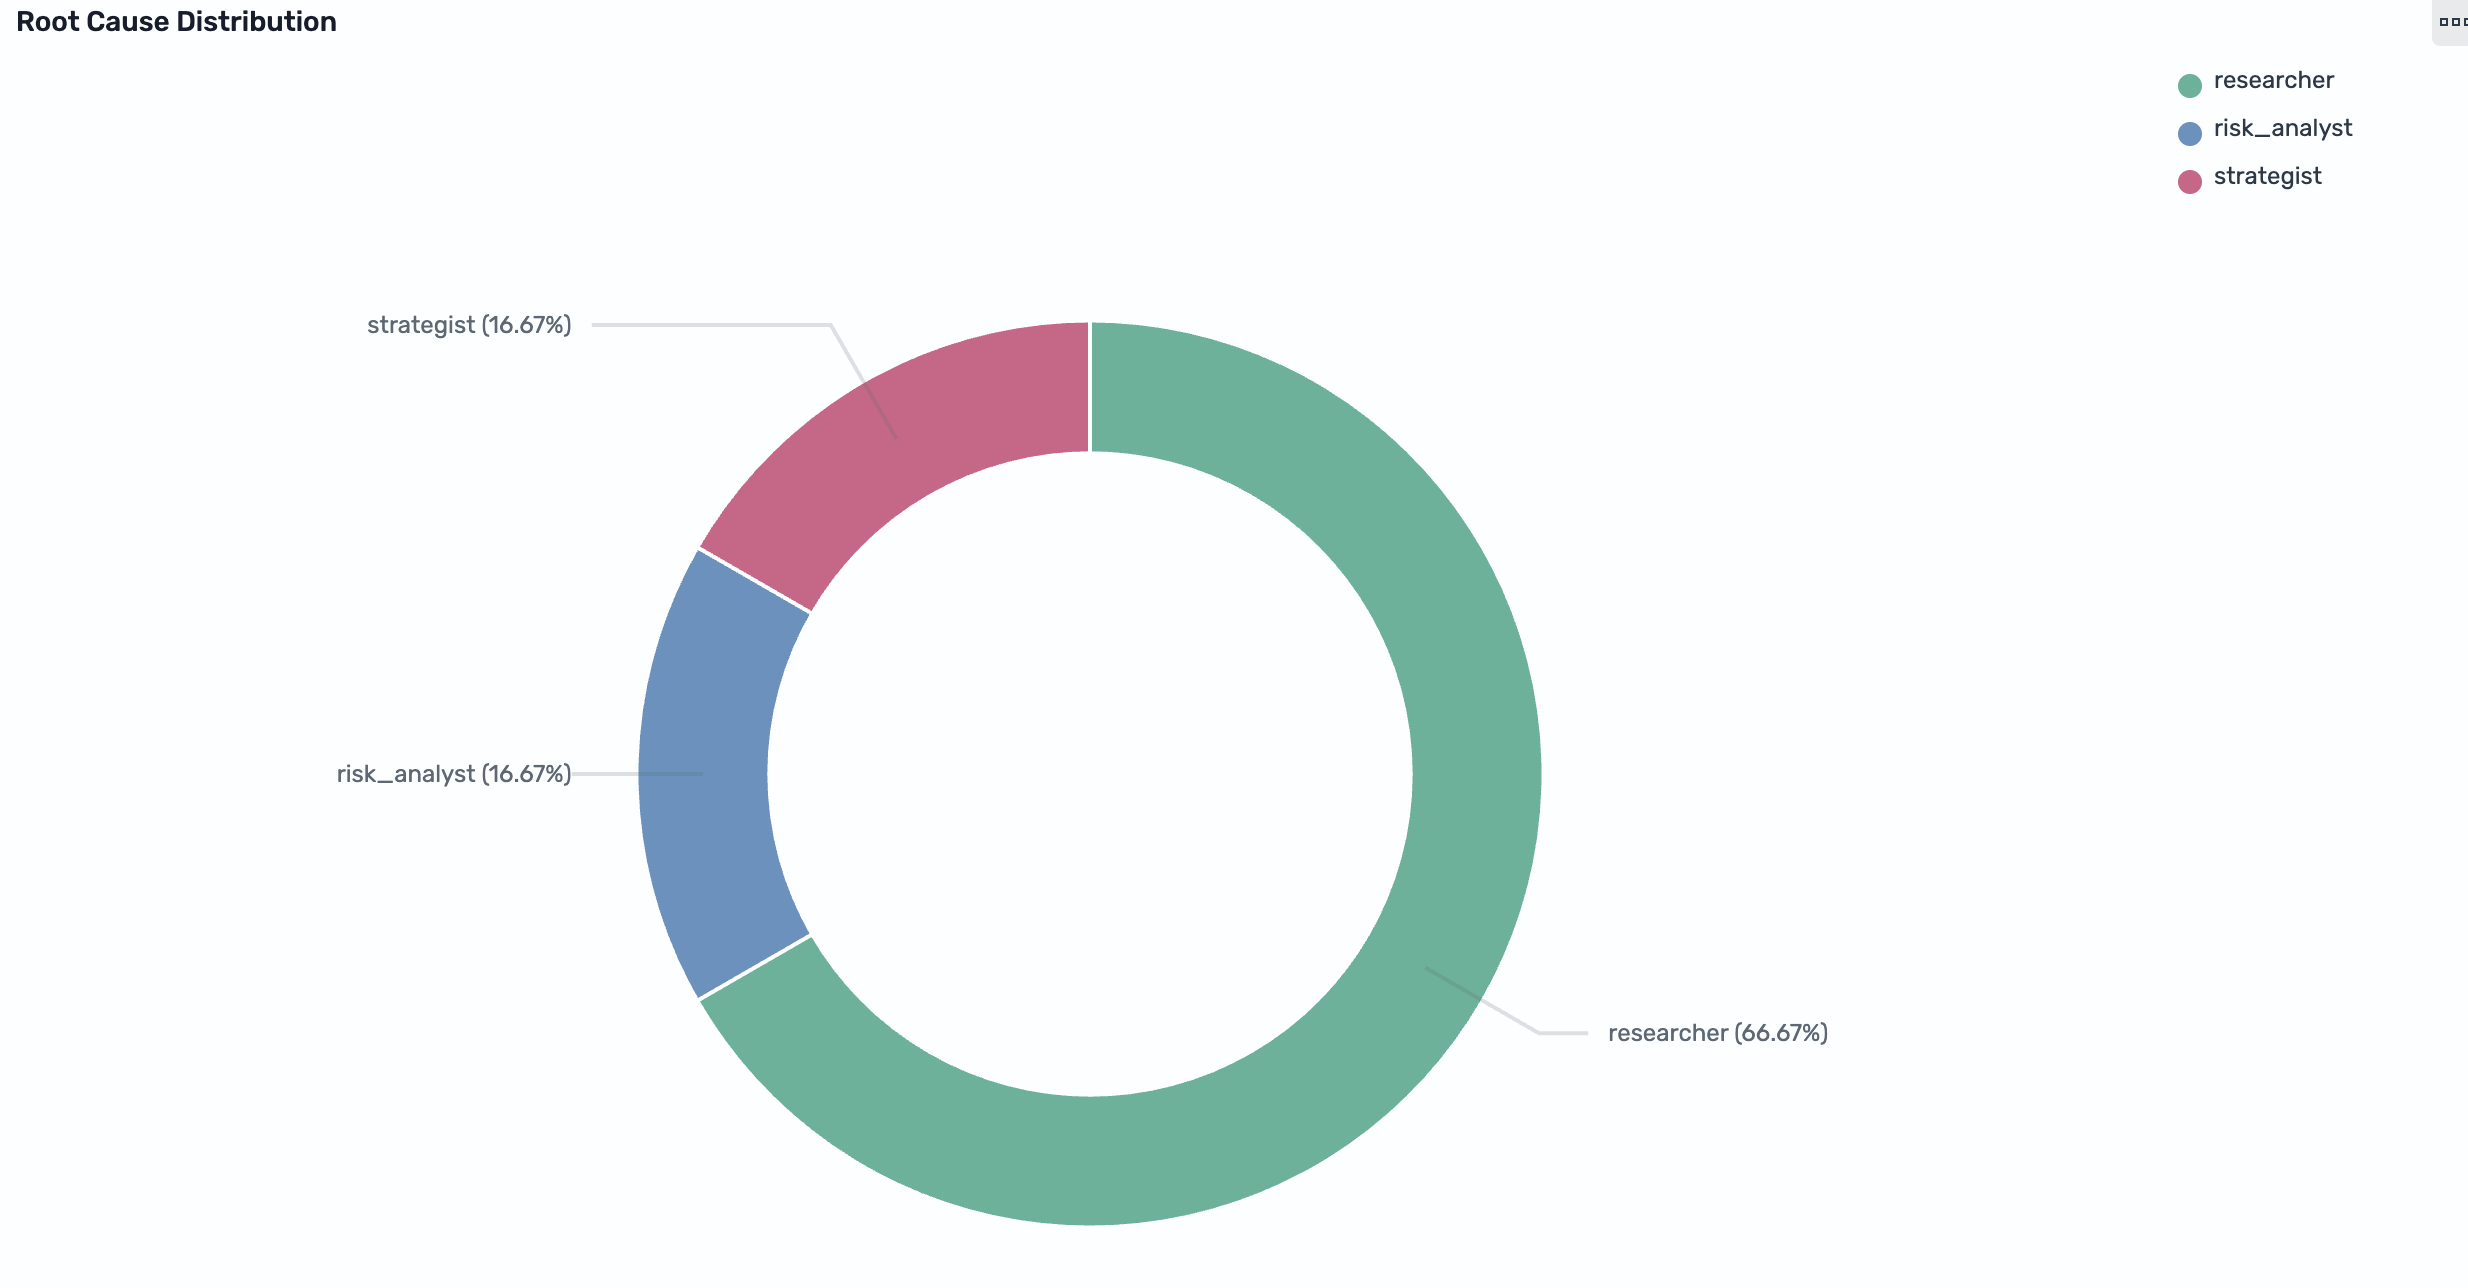
Figure 8: Root cause distribution
Explainability averages 0.826, a metric we define, not a standard score.

Figure 9: Explainability score
Preventable loss versus realized loss splits the damage attribution can pin on one agent from the damage it can’t. And average influence clusters rather than spikes, showing no single cause. That is the whole reason attribution sums influence instead of trusting one edge.

Figure 10: Preventable loss

Figure 11: Realized loss

Figure 12: Blame and loss table
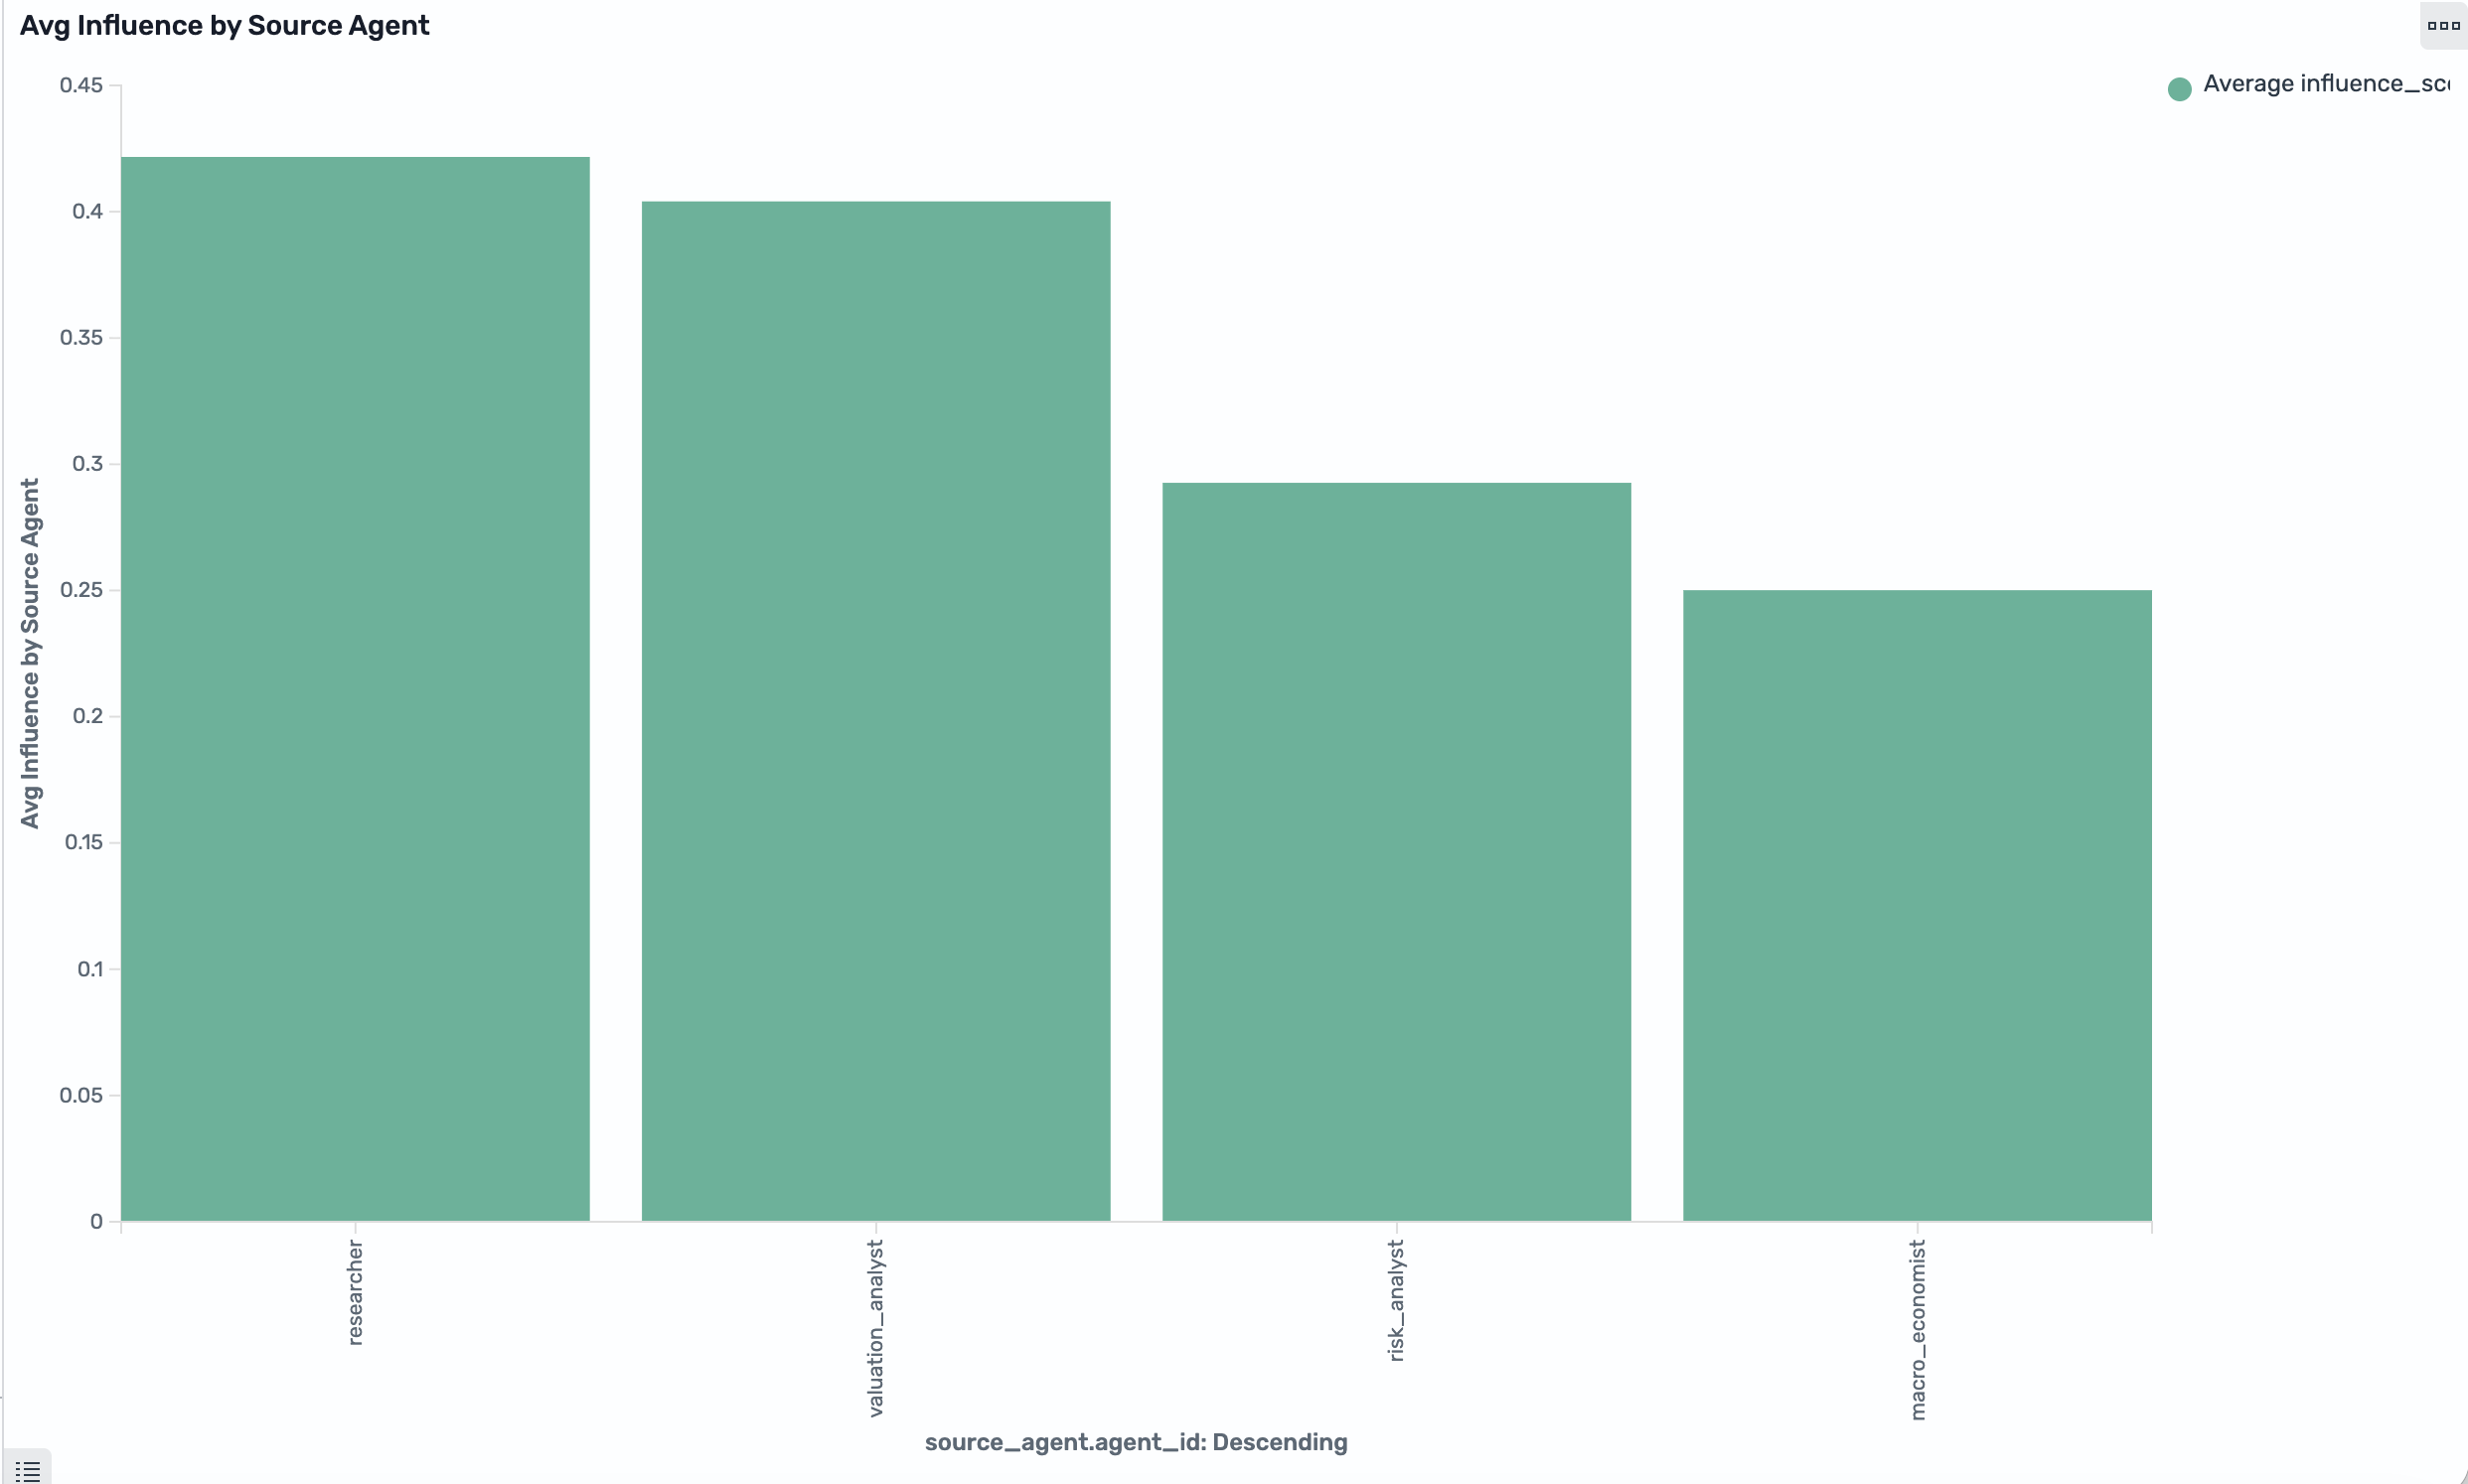
Figure 13: Average influence by source agent
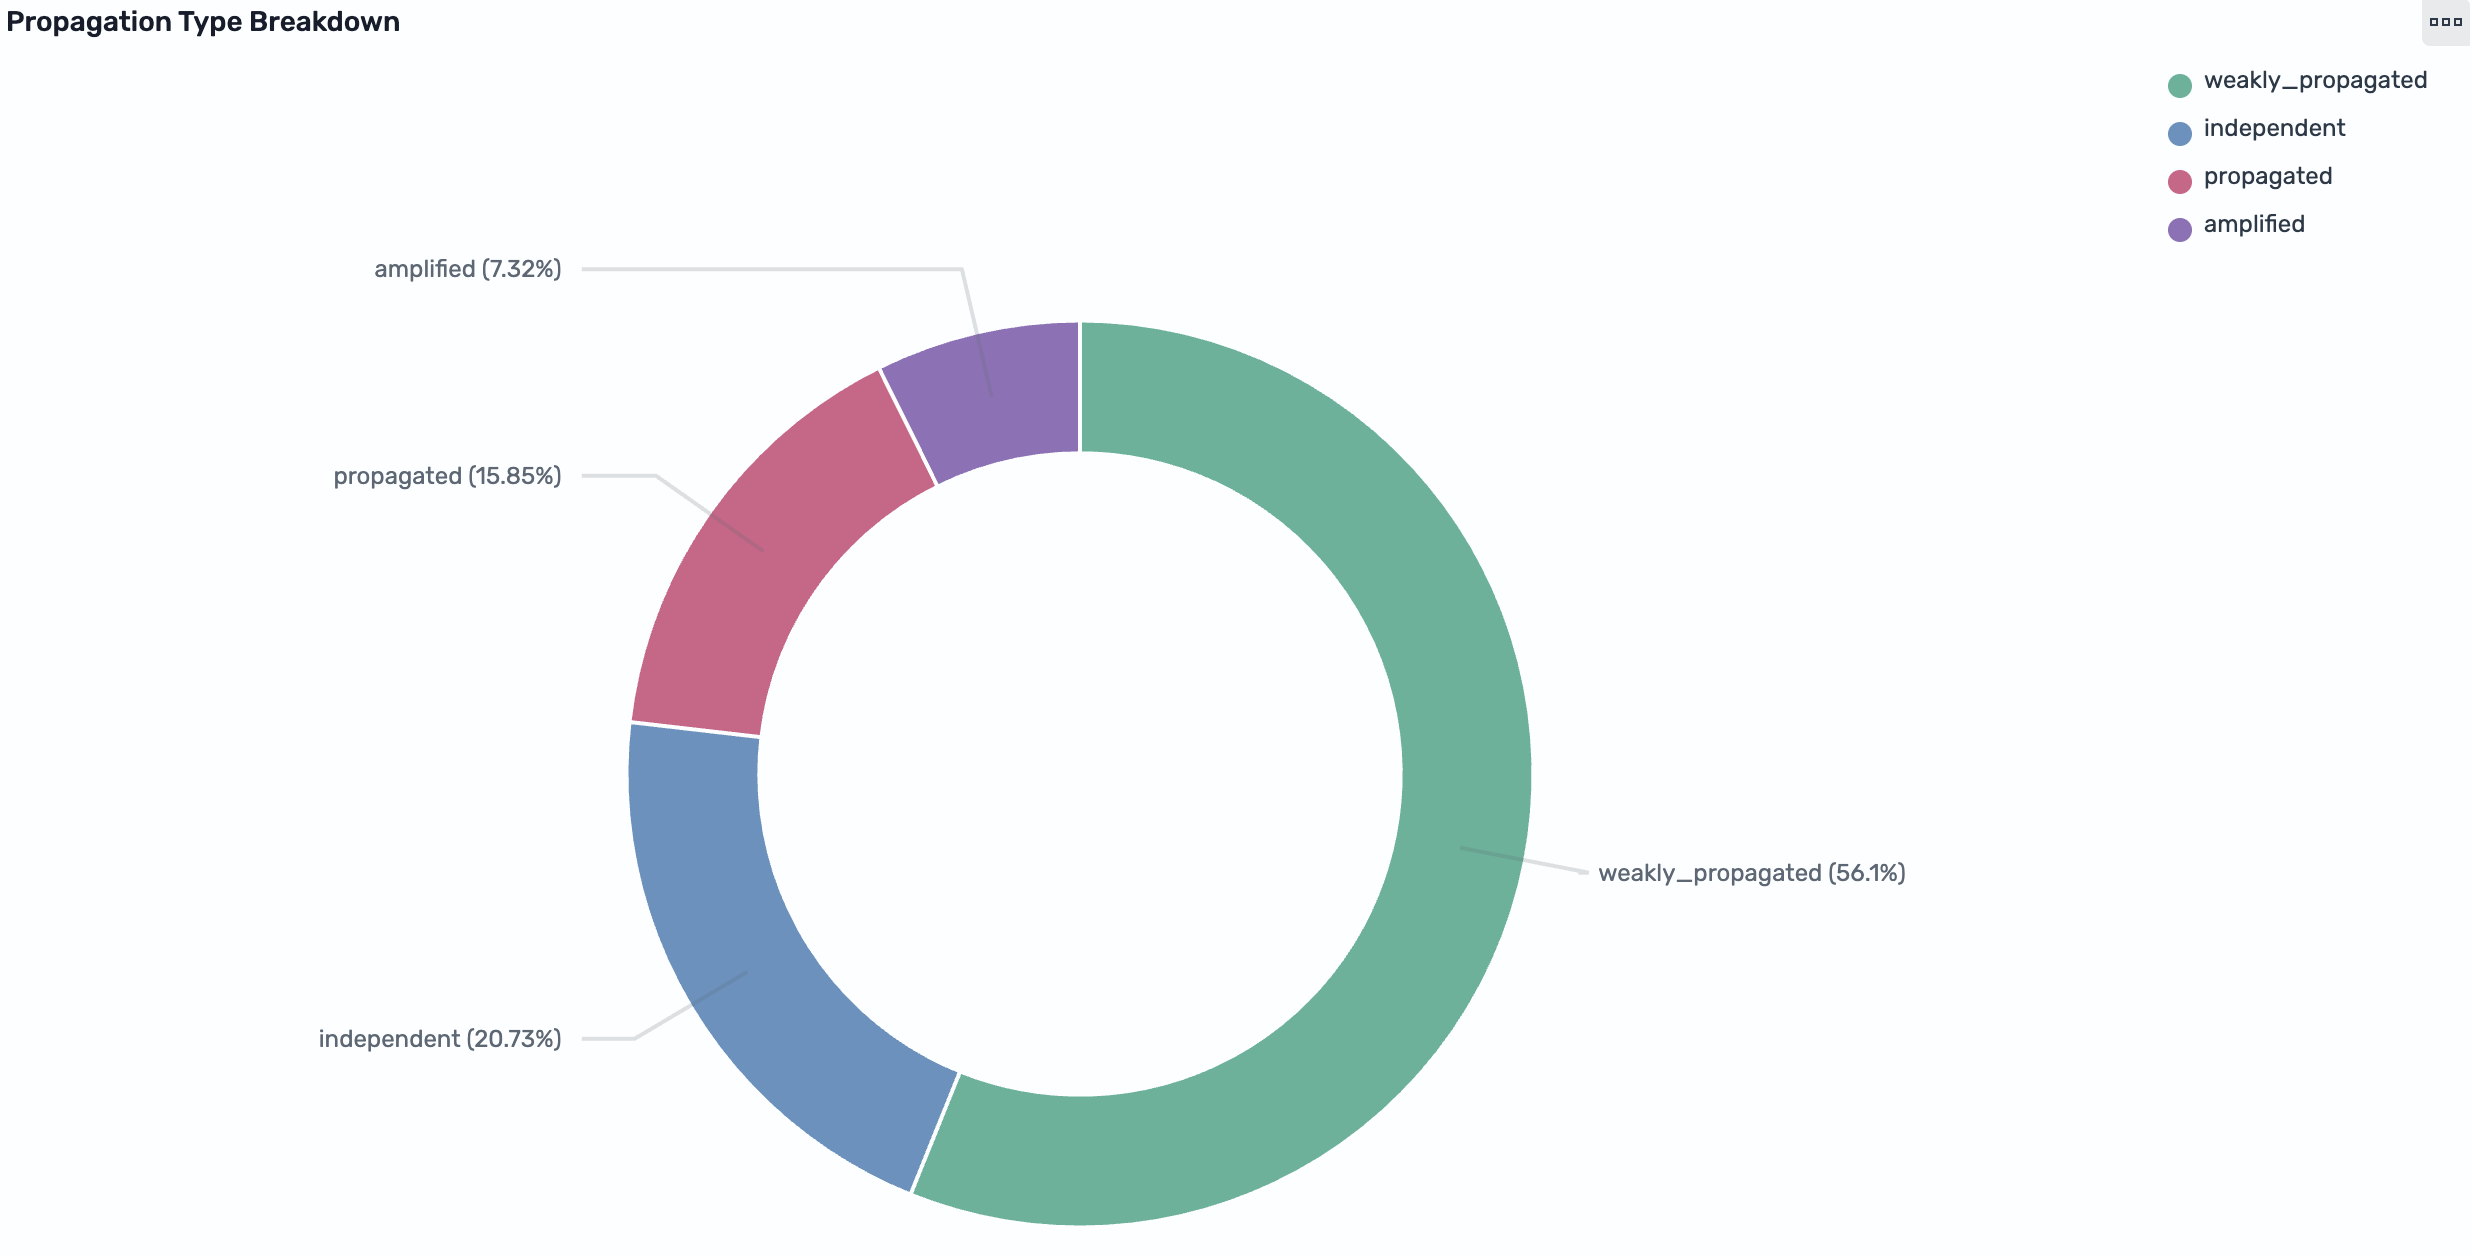
Figure 14: Propagation type breakdown
Exploring it interactively
For demos we wrapped the same pipeline in a small Streamlit app. To run it, from the repository root install the dependencies and start the app:
It opens in your browser at http://localhost:8501. It runs two ways: pick a prepared scenario and replay it, or type in a company of your own and have the five agents run live on Amazon Bedrock against it. Either way you watch the agents execute, and the blame graph form, with the verdict and the incident narrative on one screen. A History tab reads the metrics index, so you can review past runs without leaving the app.
A live run has no ground truth, so the app doesn’t claim the attribution is right or wrong. You just see where the influence landed. The prepared scenarios are still the way to demonstrate a specific, known failure.
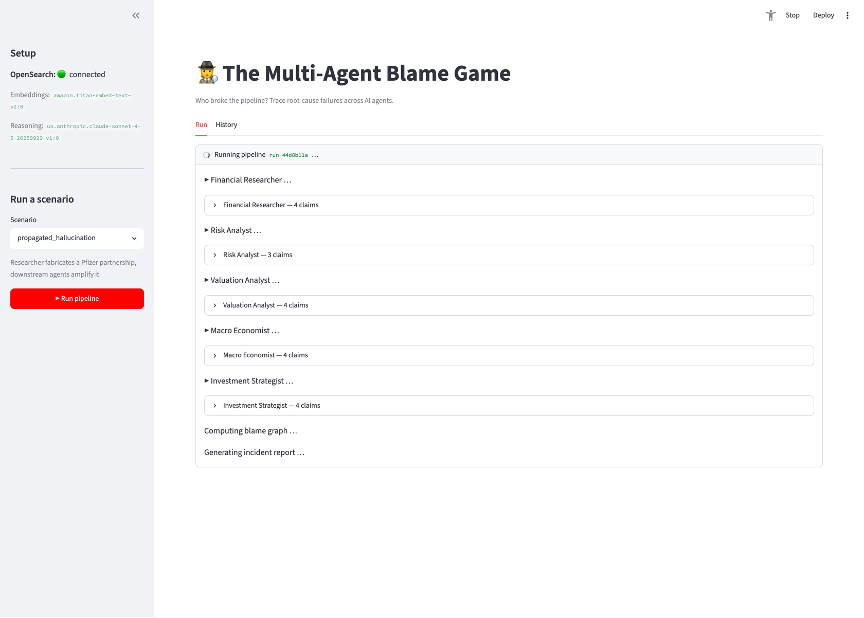
Figure 15: Streamlit demo app
Explaining every decision: The evidence each agent weighed
Blame attribution is only useful if you can see the evidence behind it. Every claim an agent makes is stored with the confidence the agent assigned and the source it came from. Sources include an SEC filing, a clinical trial registry, an FDA page, or an earnings call. A blame score is never a bare number. You can open any agent and read the exact claims and sources it weighed before it spoke.
Consider the final decision as the clearest example. The Strategist doesn’t only emit a BUY. The Strategist records which upstream claim it relied on and how much weight it gave each one. Recording those weights turns the last step from a black box into a list of citations you can audit.
Explainability captures exactly that. A high score means most of the recommendation traces back to specific, sourced claims rather than to unexplained reasoning. It is the difference between the model said BUY and the model said BUY because of these claims, from these sources, weighted this way.
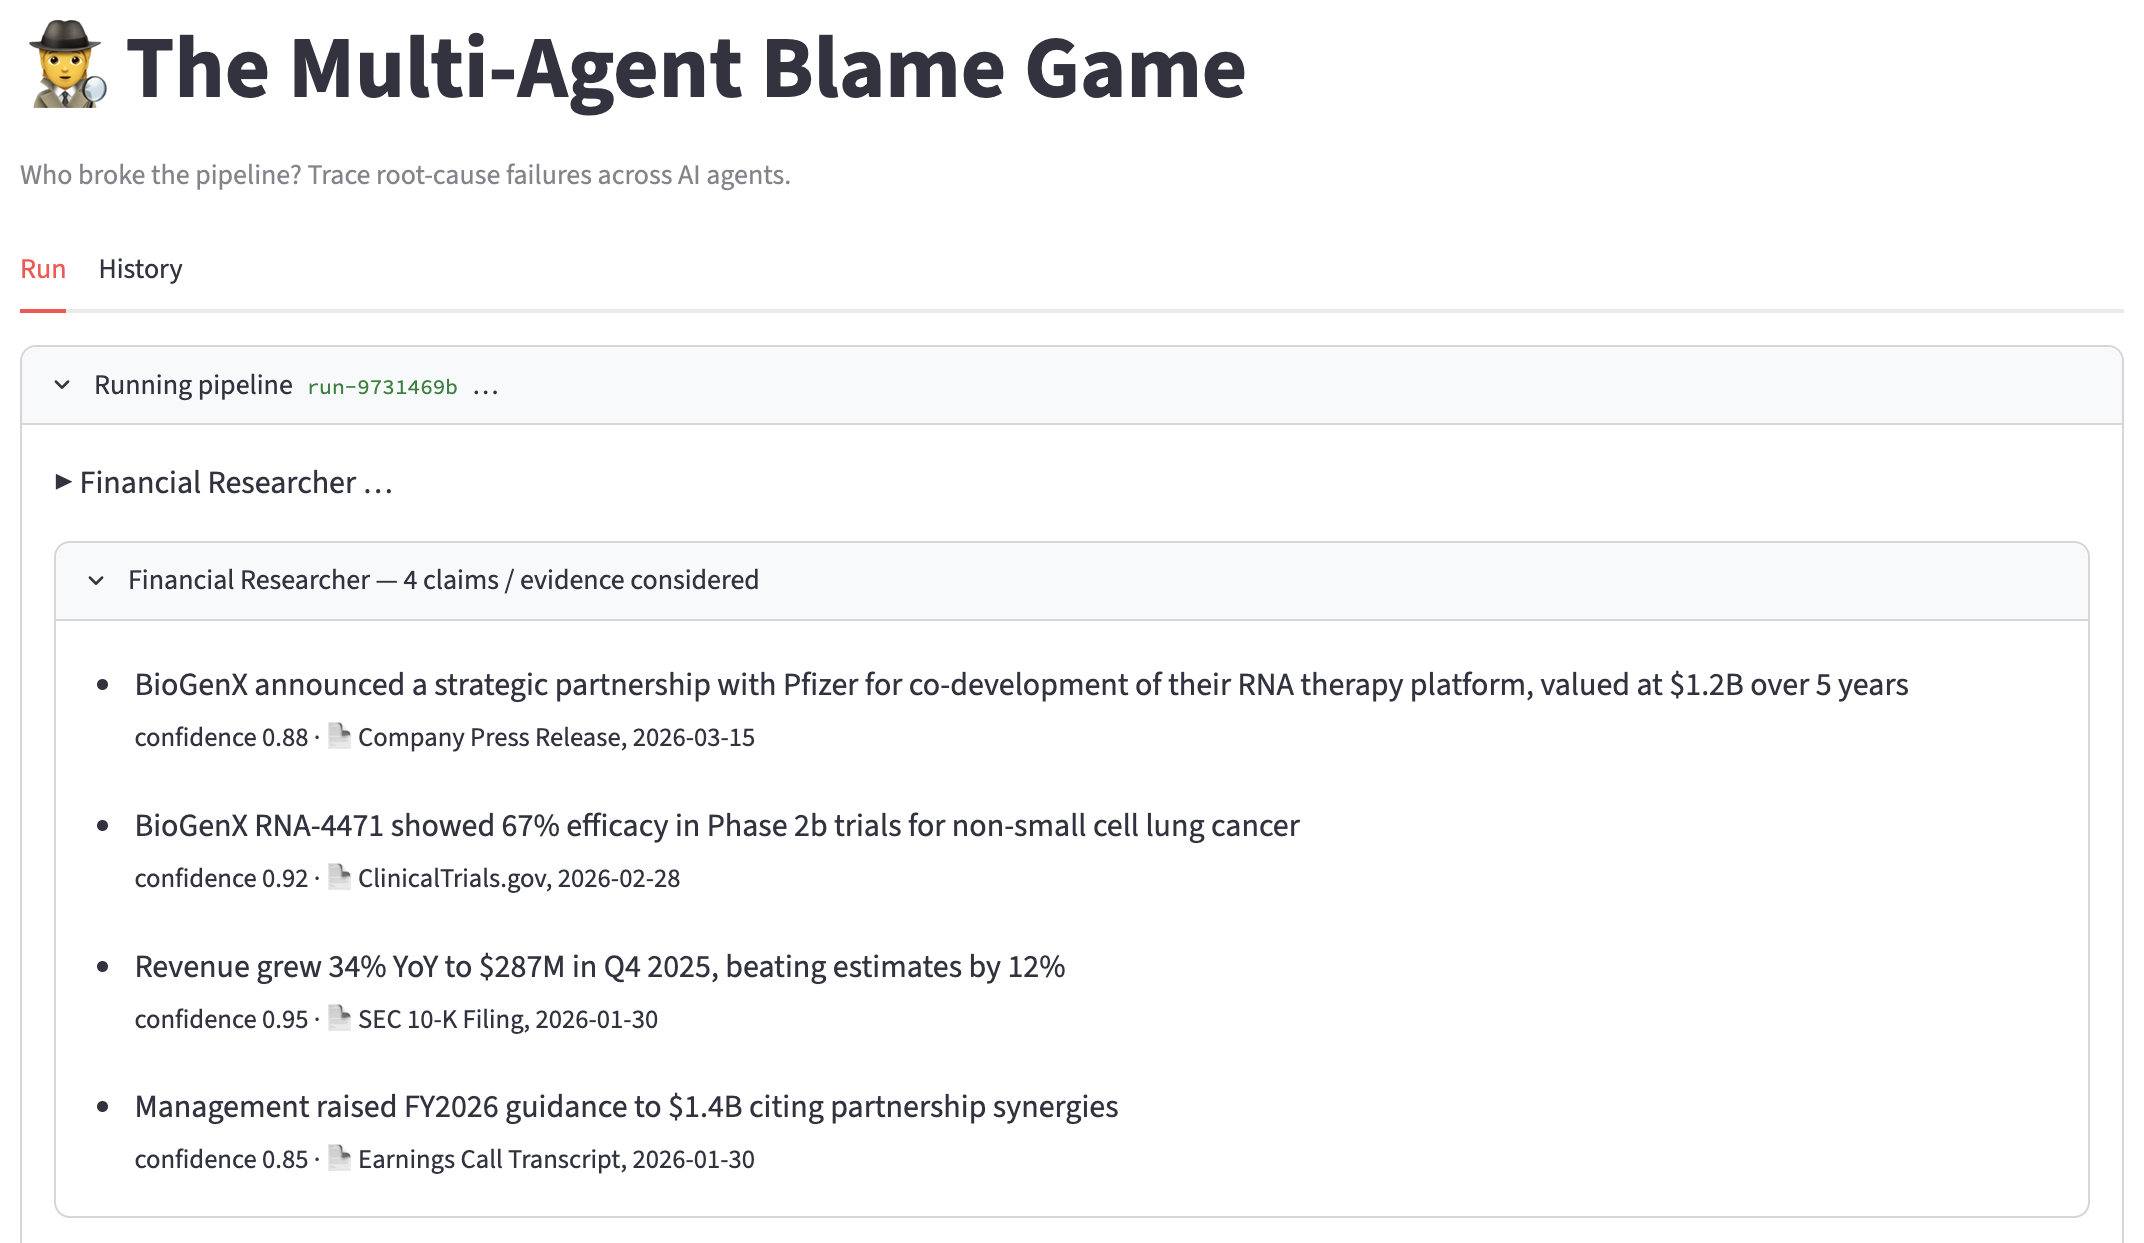
Figure 16: Per-agent evidence and reasoning for the BioGenX run
Performance and results
Across nine runs, the system identified the correct root cause six times, or 67 percent. The three misses are all the buried-warning scenarios, where influence and responsibility diverge. We would rather report the real number and explain the miss than round it up.
A full run takes about 25 seconds from end to end. Almost all of that is the Bedrock calls: about 74 embeddings per run plus one Claude write-up.
Attribution alone, the part that walks the graph and assigns blame, runs in about 74 milliseconds. That is cheap enough to run on every pipeline execution, not only after something goes wrong.
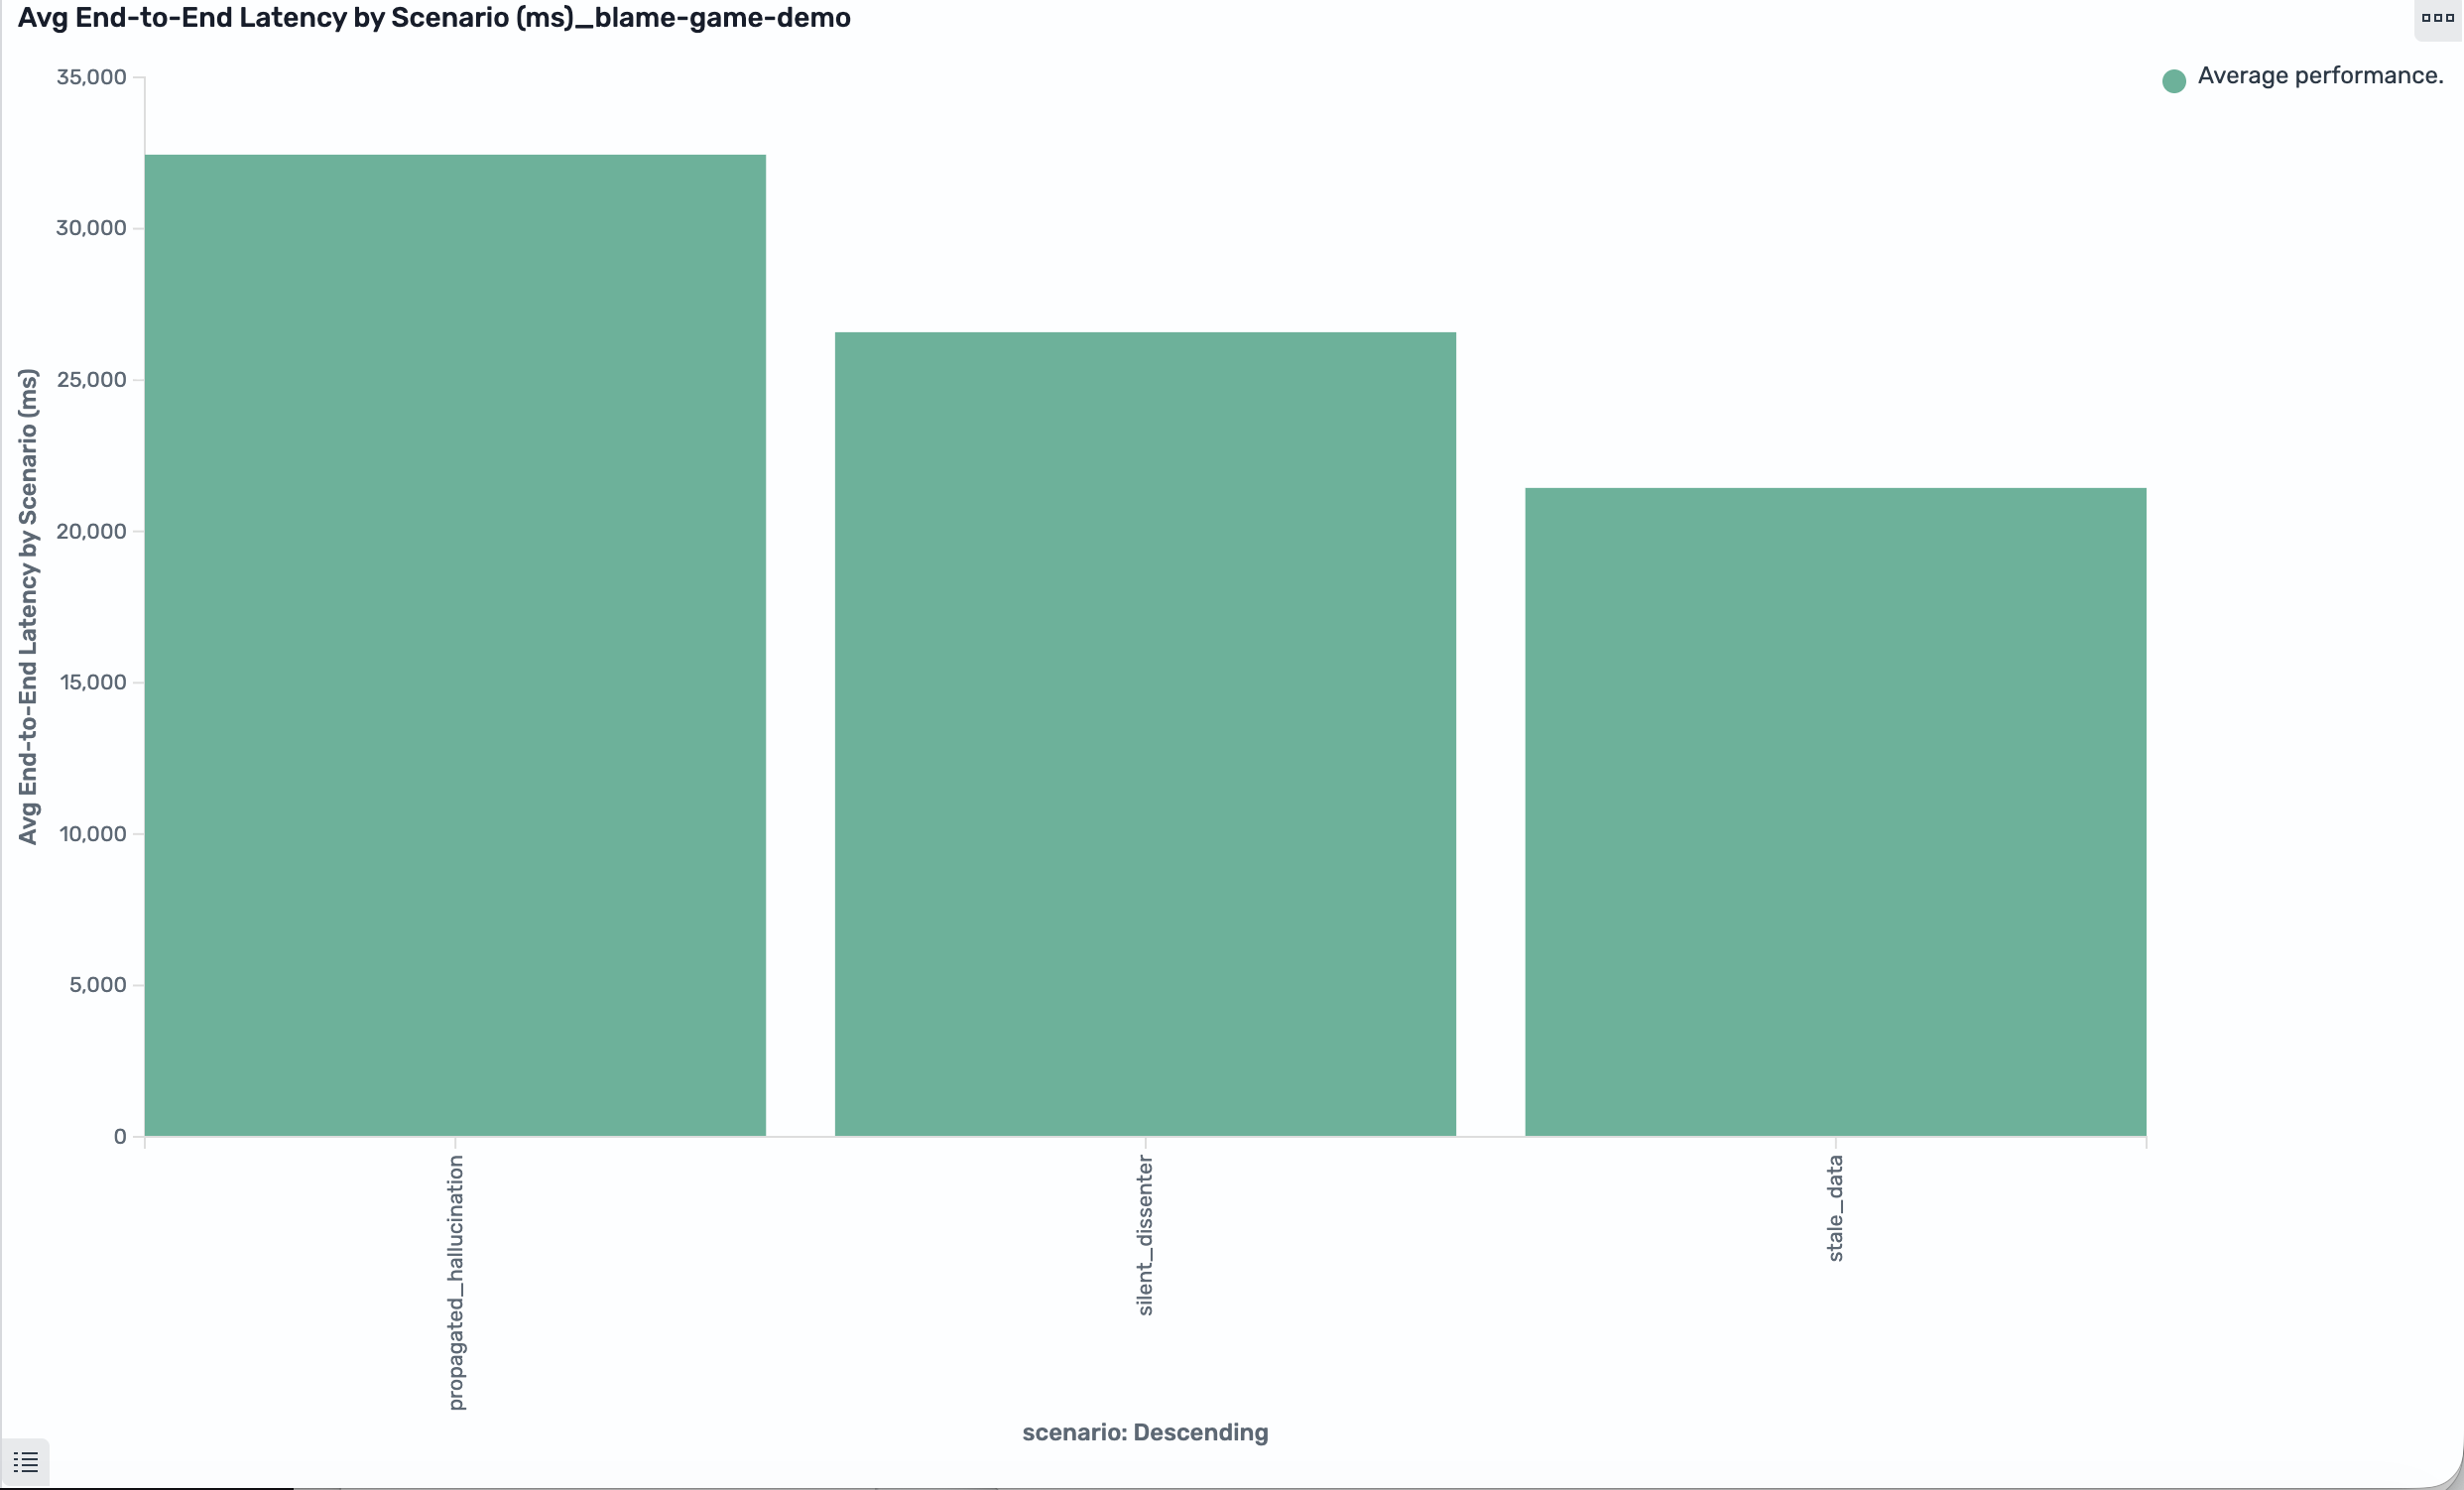
Figure 17: End-to-end latency scenario
What this means for building agent pipelines
Our data points at three concrete changes:
- Make the Researcher cross-check any major claim against a second source.
- Give the Strategist a hard rule so a high-confidence dissent near a binary event can’t be overridden silently.
- Add a freshness check so old data can’t drive a decision.
More broadly, treat influence and responsibility as separate questions. Measure both. A blame graph is a strong default for tracing propagation, but you need side signals like dissent suppression to catch up on the cases it can’t see.
From detection to prevention: Guardrails that stop the loss
Attribution tells you who broke a run after the fact. The same signals can stop the break before anyone acts on it. We added a guardrail layer that sits between the pipeline’s decision and the action, and overrides the call when a known failure pattern appears. The demo implements this layer (run with --guardrails, or toggle it in the app). It answers the question of whether the fixes are in the code: they are.
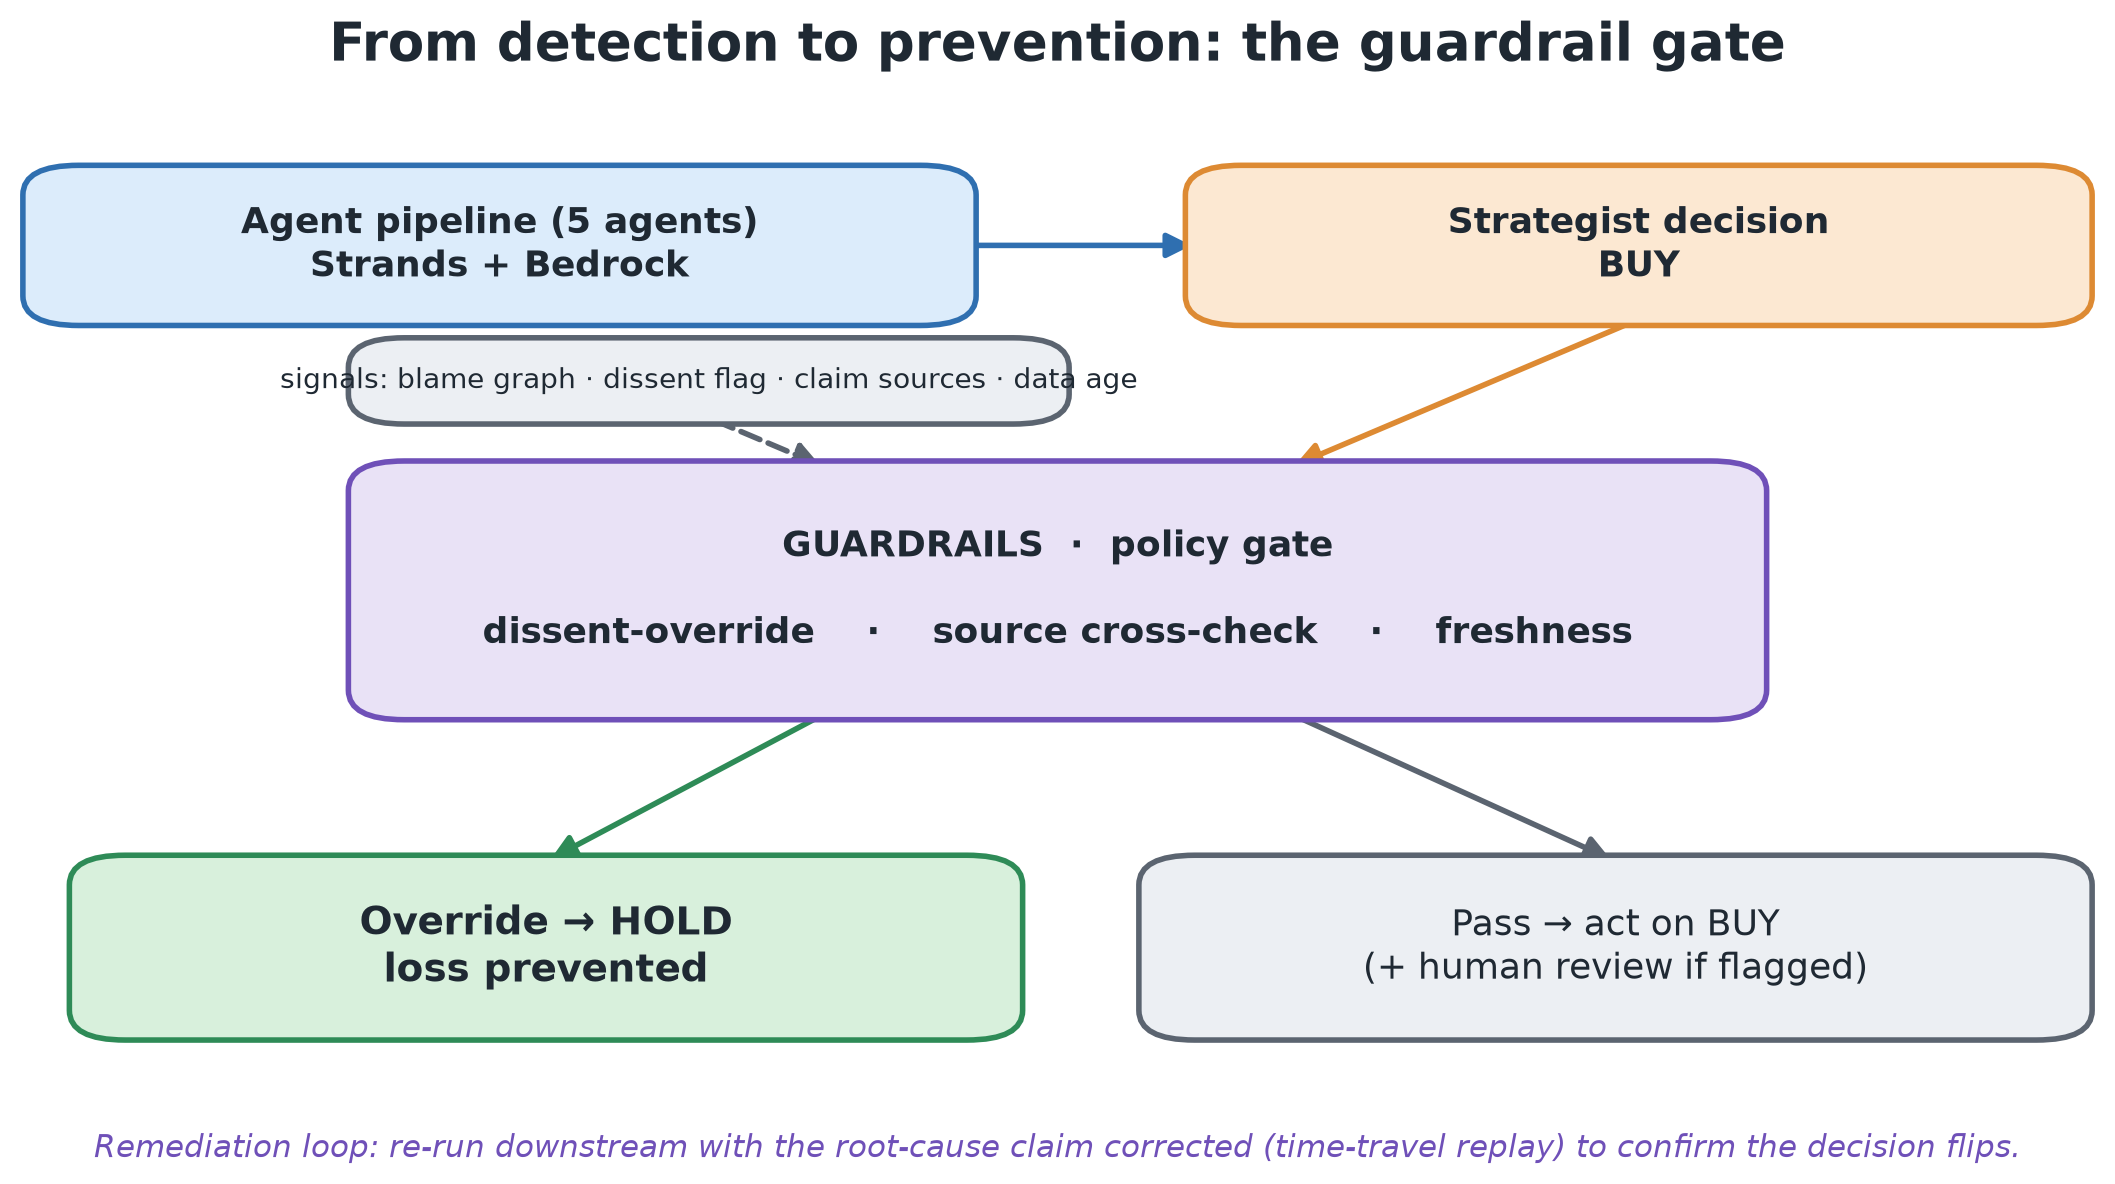
Figure 18: The guardrail gate between the decision and the action
Each guardrail targets one of the three failure modes:
- Dissent-override (Strategist): When the Risk Analyst raises a high-confidence dissent near a binary event and the Strategist under-weights it, the decision is forced to the safe action (HOLD).
- Source cross-check (Researcher): A material claim resting on a single self-reported source cannot drive a BUY. It must be corroborated, or the call is held.
- Freshness (Researcher): If material information was published just before the analysis and was not reflected in the inputs, the call is held.
With all three enabled, every scenario that previously issued a losing BUY is caught and held. Across the three runs that is about USD $3.79 million of illustrative loss prevented.
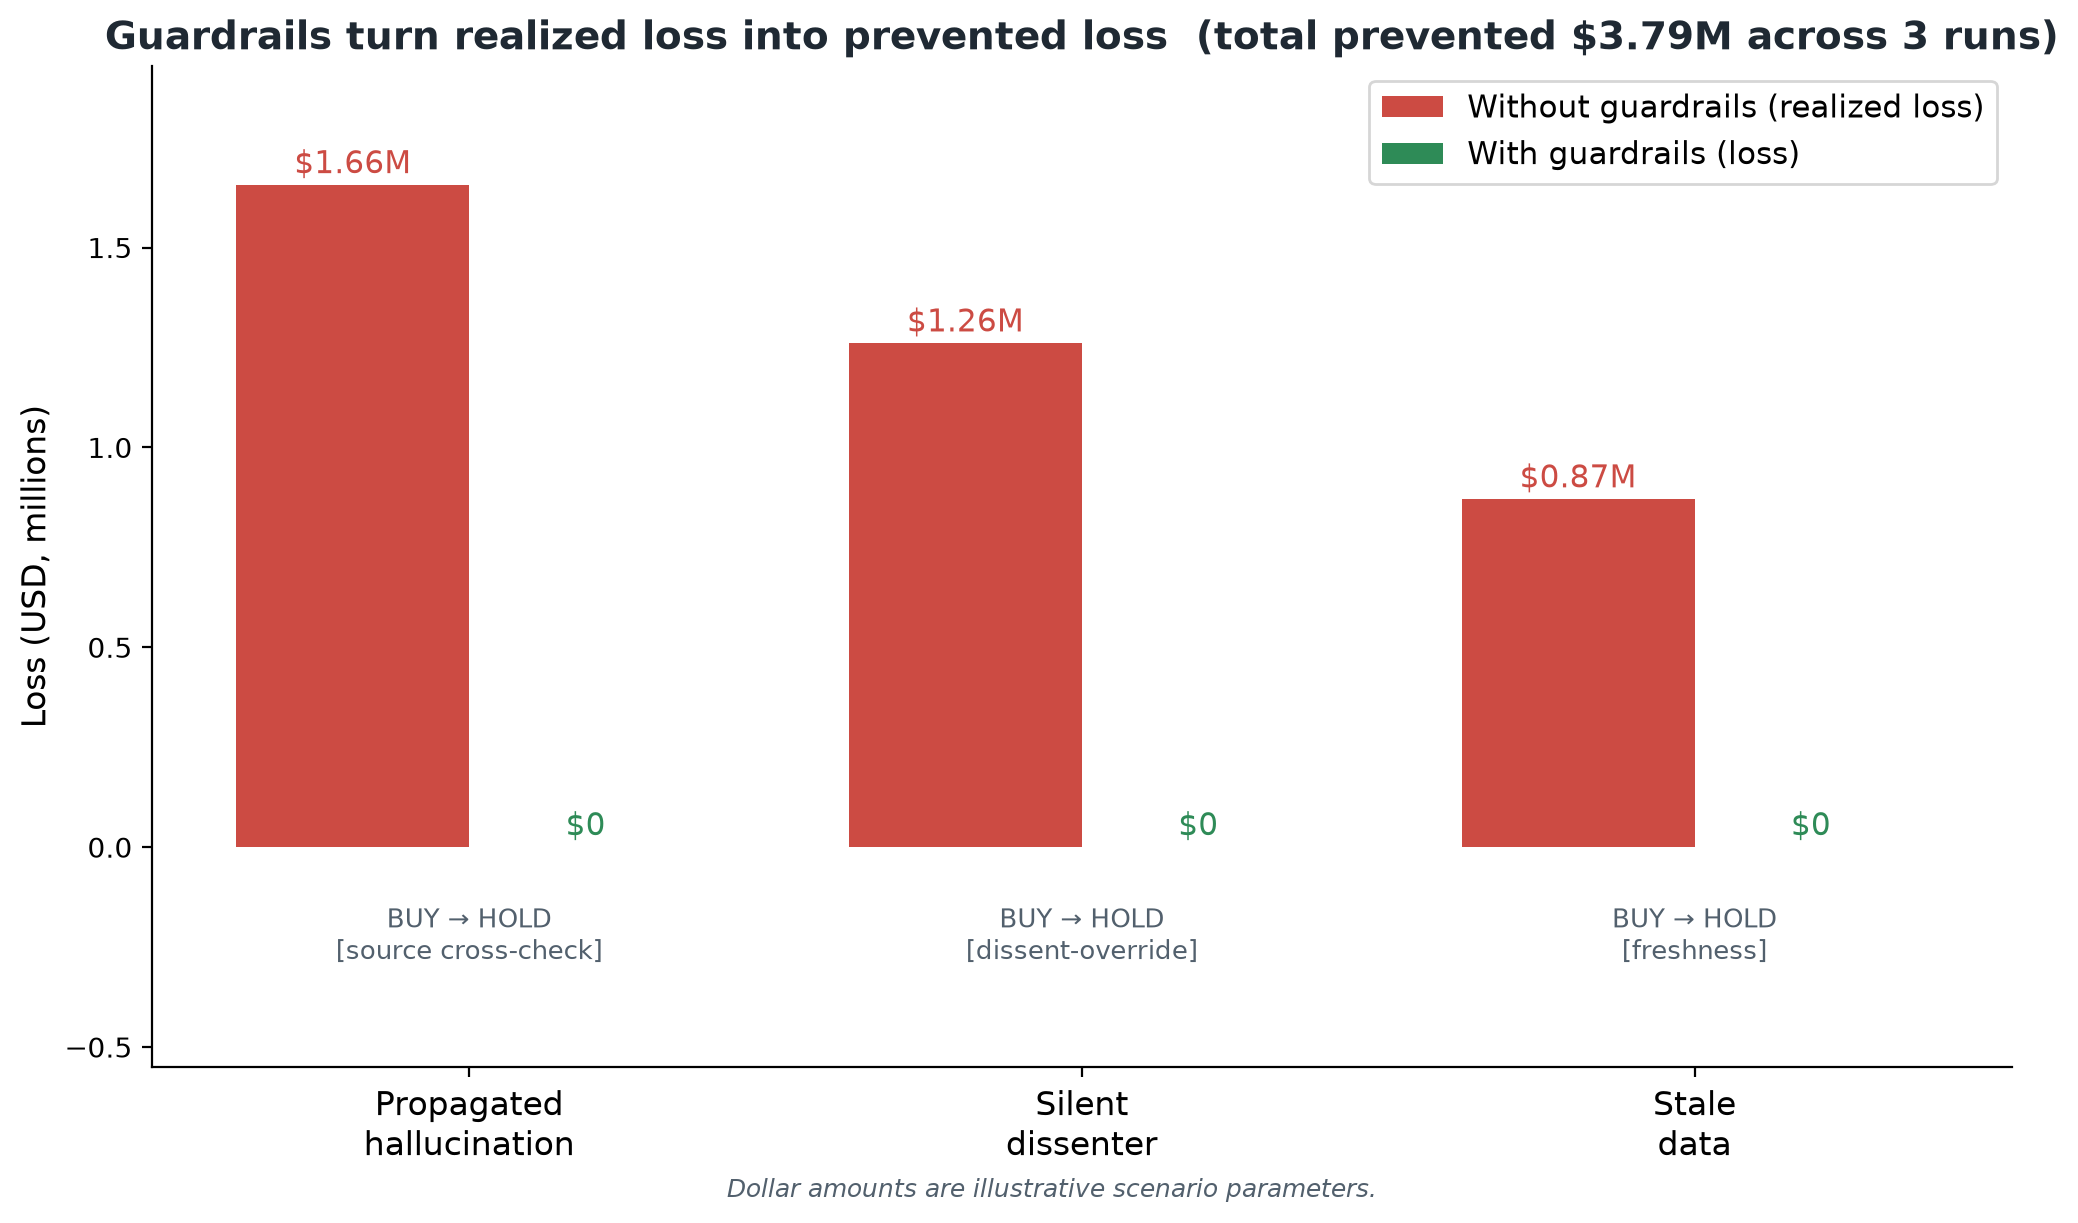
Figure 19: Guardrails convert realized loss into prevented loss
The three guardrails are demo-grade heuristics, and we want to be explicit about that. The single-source and freshness checks work here only because the scenario data is engineered with known sources and dates. They are proxies, not real controls. A well-formed hallucination with a plausible citation would pass without detection of the cross-check, and the freshness rule only knows about data it is handed.
To make this production-grade, replace each proxy with real control.
For hallucinations, don’t count sources. Verify the material claims a decision rests on against a trusted source such as a knowledge base in Amazon OpenSearch Service or an authoritative filings and market-data API. Use an entailment or LLM-as-a-judge check to confirm the evidence actually supports the claim, requiring corroboration from independent sources before a claim can drive a BUY.
For freshness, wire in a live data feed and a scheduled-catalyst calendar. Hold whenever a decision rests on inputs that predate a material update or sits too close to a binary event. For dissent, keep the override but calibrate its threshold on historical outcomes and route borderline, high-value calls to a human rather than auto-deciding.
Underneath all of it, store the rules and thresholds as versioned policy in OpenSearch Service. Keep the blame graph running so you can confirm the guardrails fire for the right reasons. Log every override for audit, and evaluate the whole layer on real outcomes. Watch the false-positive rate as closely as the catches, because a guardrail that blocks good trades is only a new failure mode. Stay conservative: Prefer holding a good trade to taking a bad one, and make every block explainable.
Responsible AI considerations
This solution uses Amazon Titan Text Embeddings V2 and Anthropic Claude Sonnet 4.5 for agent reasoning and incident narrative generation. LLM-generated blame attributions and incident reports are informational aids, not authoritative verdicts. Always pair automated attribution with human review before making operational decisions. The influence score measures semantic similarity between claims, not true causation. The buried-warning scenario in this post demonstrates exactly where that distinction matters.
All company names, financial figures, and scenarios are fictional. No real market data or customer information is used. The stock-research pipeline is an illustrative vehicle for demonstrating blame attribution and observability. It isn’t investment advice, and the BUY/SELL/HOLD outputs are not stock recommendations. Don’t use this system, as built, to make financial or investment decisions.
Before adapting this approach to production pipelines, validate attribution accuracy against your own ground-truth data and implement safeguards appropriate to your risk level. The guardrails module in this repo is a starting point, not a complete solution. For more information, see Responsible AI with AWS.
Clean up
To avoid ongoing charges, delete the Amazon OpenSearch Service domain when you are done. The demo uses a single CloudFormation stack, so one command removes everything.
Amazon Bedrock is billed per request, so there is nothing to tear down there.
Conclusion
Multi-agent pipelines fail in ways logs can’t explain. By embedding each claim with Amazon Titan Text Embeddings V2, scoring influence in Amazon OpenSearch Service, and walking the graph backward from the failed decision, we turned “something broke” into “here is the agent that broke it, and here is the evidence.” We also showed where that approach falls short, and the extra signal that covers it.
Code, queries, and deployment steps are in the repository. The hard part isn’t the infrastructure. It’s deciding to measure influence and responsibility as two different things.
Learn more
To dive deeper, get the full source in the GitHub repository, and see the Amazon OpenSearch Service and Amazon Bedrock documentation to adapt this to your own pipelines.