AWS Business Intelligence Blog
Create centralized monitoring for Amazon Quick Suite administration
As your Amazon Quick Suite environment grows, so does the complexity of managing it. As a Quick Suite administrator, you are responsible for controlling access, tracking adoption, monitoring performance, managing cost and ensuring security compliance. However, the data you need is scattered across AWS CloudTrail logs, Amazon CloudWatch metrics, and various Quick Suite interfaces that are difficult to navigate and analyze efficiently.
While the AWS Management Console for Amazon Quick Suite provides basic usage metrics, you’re missing the complete picture. You need a solution that unifies the administrative metrics into a single view and that you can use to share insights with your broader team, not just admins.
This post shows you how to build a comprehensive monitoring framework that gives you visibility into your Quick Suite environment through unified dashboards, automated data collection, and a chat agent. We walk you through the architecture needed to extract, model, and expose this data, and provide you with:
- A ready-to-use dashboard to visualize key metrics
- Sample datasets covering Quick Suite metadata, cost, usage, and performance monitoring
- Example natural language questions you can ask the chat agent
After implementing this solution, you will be able to quickly find critical information such as:
- Who has access to the marketing dataset
- Which dashboards were viewed the most last month
- What objects a specific user created in the last 7 days
- Which groups have the most users
- Which datasets are used across multiple dashboards
- Which folders have the most objects in them
- How many documents there are in your Q index
Built-in usage metrics in the Quick Suite console
Before diving into the custom monitoring solutions, let’s explore what Quick Suite already provides out of the box.
Quick Suite provides built-in usage metrics that give administrators a clear view of how users engage with the platform. These metrics cover chat interactions, space usage, flow executions, action invocations, automations, and custom agent activity. To access them, go to the Quick Suite console, open the application bar, choose your profile icon, select Manage Quick Suite, and navigate to Quick Suite Usage Metrics under the Analytics section. Here, you can explore active users across daily, weekly, and monthly timeframes, understand feature adoption, and gain visibility into asset usage and performance trends.
The sample usage metrics of the admin page are shown in the following figure:
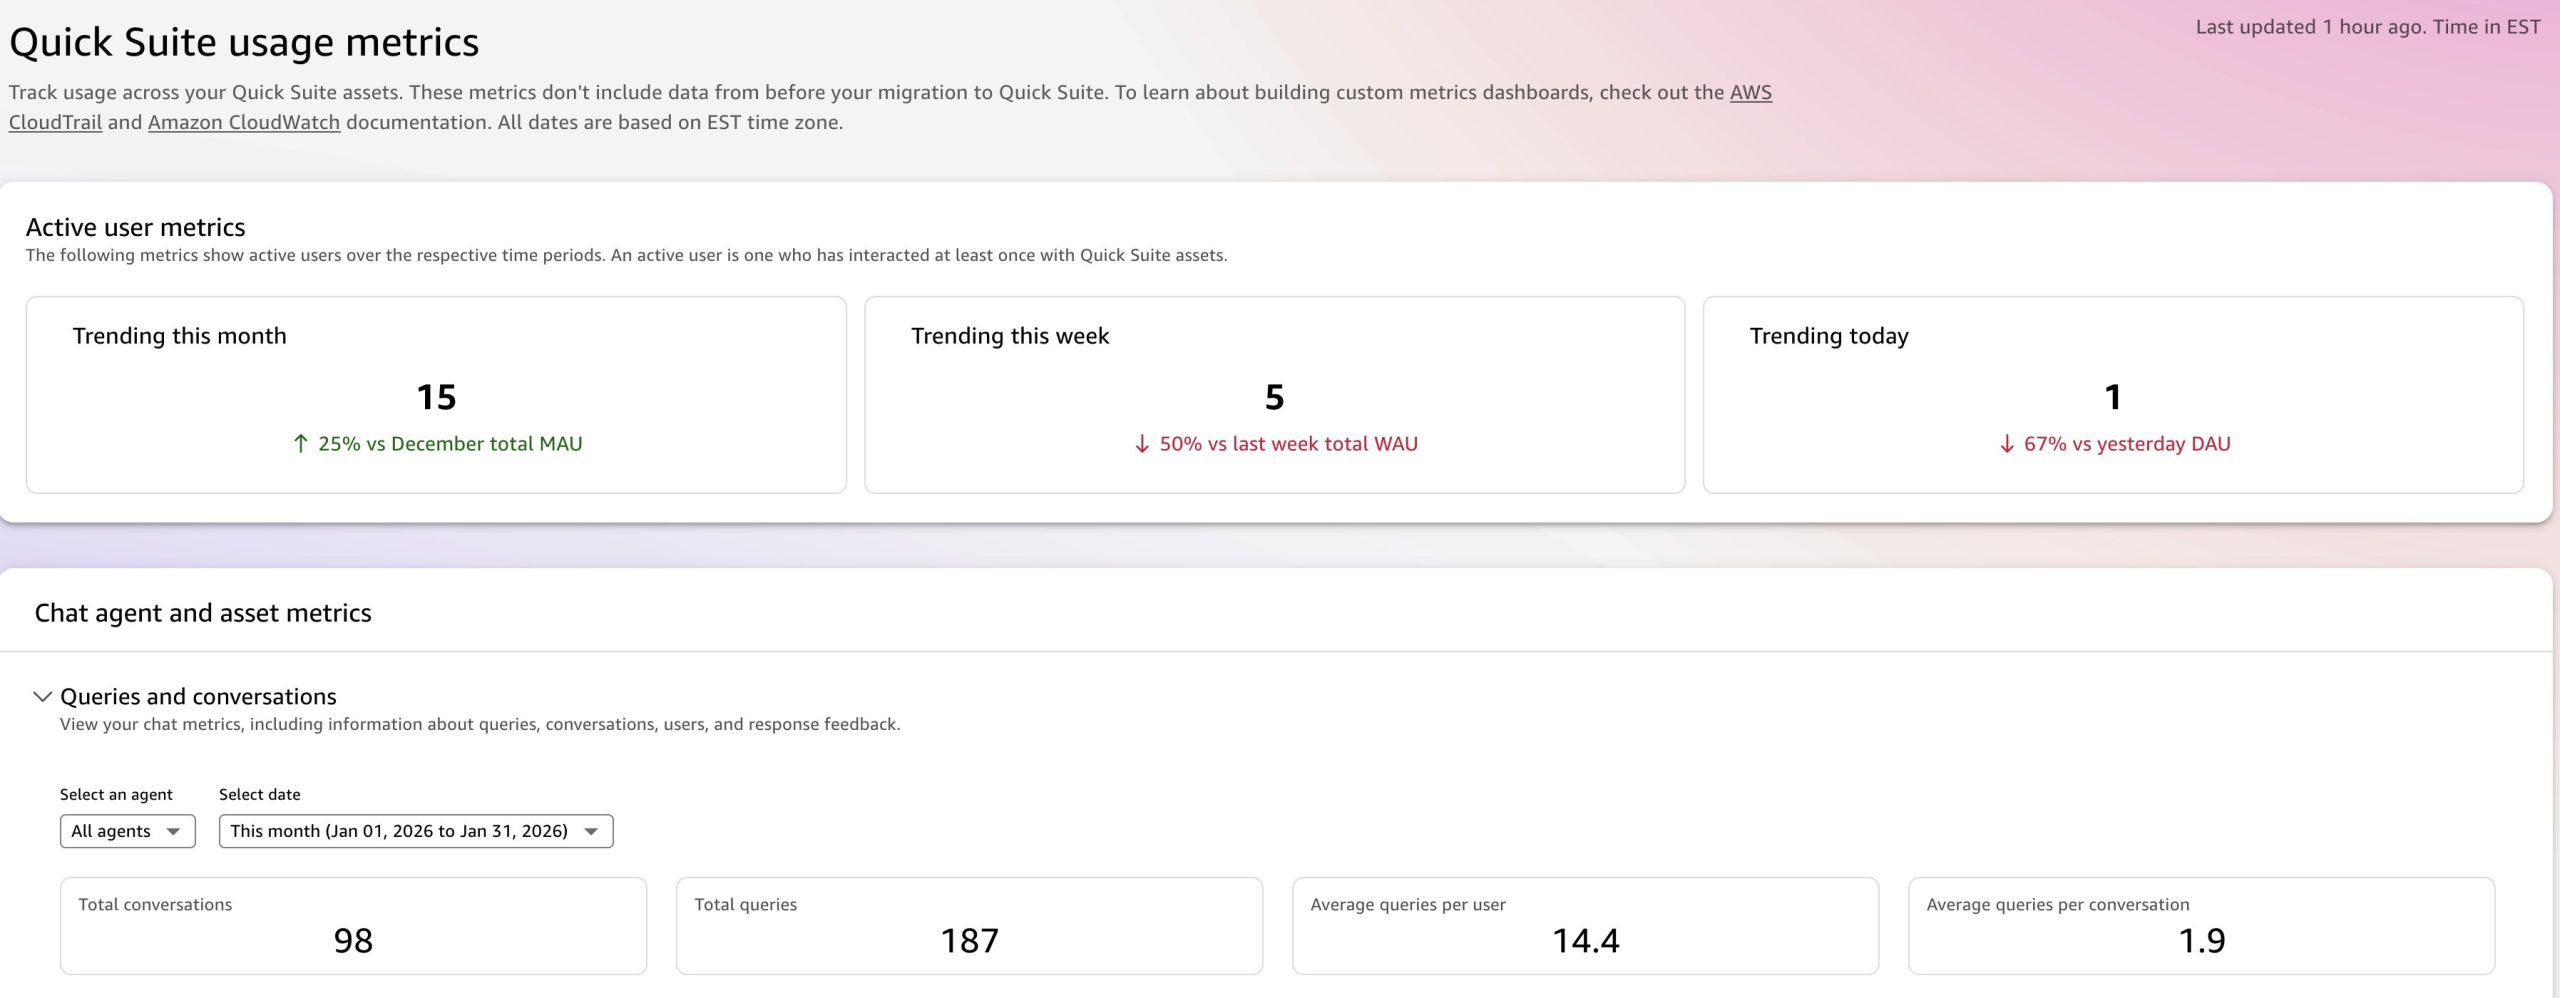
While these built-in metrics are valuable for day-to-day monitoring, they’re only accessible to administrators and don’t integrate cost data, CloudTrail audit logs, or CloudWatch performance metrics. For organizations seeking deeper insights or the ability to share monitoring data with non-admin users, the custom solution below provides a more comprehensive view.
Architecture overview
The solution uses a serverless architecture to automatically collect, model, and visualize Quick Suite administrative data.
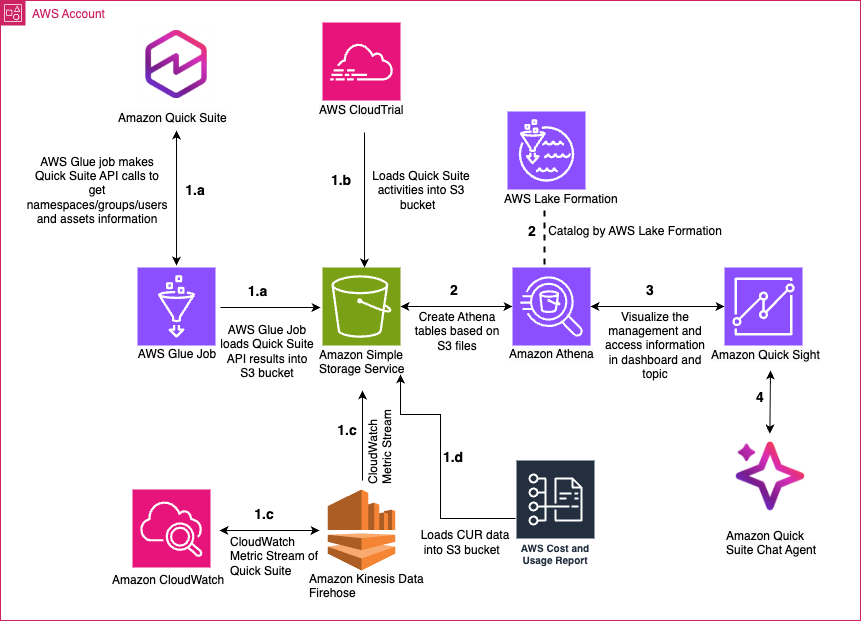
Let’s examine each stage, as shown in the preceding figure:
1. Data collection
- Metadata: AWS Glue jobs run daily, calling Quick Suite APIs (
list-dashboards,describe-dataset, and so on) to extract asset details, permissions, namespace, group, user information and resolve object lineage (such as, which dashboard uses which dataset), and save them to Amazon Simple Storage Service (Amazon S3). - Usage: AWS CloudTrail captures audit logs (
GetDashboardEmbedUrl,QueryDatabase, and so on) and stores them in an Amazon S3. - Monitoring: Amazon Data Firehose streams CloudWatch metrics (SPICE capacity, dashboard loading time, index document size) and vended logs (chat history, chat feedback, and agent hour) to Amazon S3 in near real-time.
- Cost: The solution ingests the AWS Cost and Usage Report (CUR) data from Amazon S3 and creates a dataset for cost analysis.
2. Data storage and modeling
Raw data is stored in Amazon S3 and cataloged with AWS Lake Formation, then modeled in Amazon Athena tables and views. Optionally, this data can be enriched with employee information for HR systems or other organizational insights.
Quick Sight Dataset and Dashboard
Build Quick Sight datasets from Athena tables and views, then create a dashboard showing insights including usage patterns, cost analysis, asset lineage, permissions, and performance metrics for comprehensive Quick Suite monitoring and governance.
Amazon Quick Suite chat agent and Q topic
Create an Amazon Q topic from the datasets with business-friendly synonyms and default visuals. With the topic configured, users can ask natural language questions like “Who viewed the Sales Dashboard last week?”, “Which datasets are in this folder?”, or “Which analyses were created last month?” through the Quick Suite Q&A or chat interface.
For more information about Quick Suite related CloudTrail logging, see Tracking non-API events by using CloudTrail logs.
Prerequisites
Before implementing this solution, ensure you have the following:
- An AWS account with administrative access
- Amazon Identity and Access Management (IAM) permissions to create and manage AWS resources using CloudFormation.
- Deploy AWS CUR using AWS Data Exports (both legacy and standard formats are supported)
- Enable resource IDs for detailed cost attribution.
- Create a job to export the CUR files to Amazon S3
- Set up an AWS Glue crawler to catalog the CUR data in the AWS Glue Data Catalog as a table (this table will be used by the solution)
- Access to the following AWS services:
- Basic Python programming skills
- Basic SQL querying skills
CloudFormation template for data collection
This CloudFormation template creates a complete observability platform for Quick Suite environments by deploying the Quick Suite monitoring and analytics infrastructure, automating the collection of asset data, user activity, and performance metrics for centralized oversight and insights.
Use the Launch Stack button to implement this solution and automatically set up the data pipeline in your AWS account.
![]()
Resources created
The template will create the following resources.
- IAM role:
QuickSuiteAdmin
Execution role with permissions for Glue, Quick Sight, Amazon S3, CloudWatch, and Firehose.
- S3 storage:
admin-suite-{AccountId}
An S3 bucket is used for central storage of the collected data with private access controls.
- Five scheduled AWS Glue ETL jobs
There are five extract, transform, and load (ETL) jobs, shown in the following table. The five jobs are automatically executed once daily, spread between 2:00 AM and 3:05 AM.
| Job | Purpose |
admin_suite_user_info_access_manage |
Collects user access and permissions data |
admin_suite_dataset |
Extracts dataset metadata and properties |
admin_suite_folder |
Gathers folder structure and asset organization |
admin_suite_q |
Collects Quick Sight Q (NLP) metadata |
admin_suite_datasource |
Harvests data source configurations |
- Five Data Firehose streams
Five Data Firehose streams are used to provide real-time delivery of CloudWatch metrics to Amazon S3:
-
-
- Dataset ingestion metrics
- Dashboard performance metrics
- SPICE capacity metrics
- Q index metrics
- Action invocation metrics
-
- Five CloudWatch metrics streams
Five continuous CloudWatch metrics streams of Quick Suite operational metrics including ingestion latency, dashboard load times, SPICE usage, and Q performance. The data collection scope includes:
-
-
- Asset management, such as datasets, dashboards, themes, Q topics, folders, and chats
- User access, such as permissions, group memberships, and object activity
- Performance metrics, including dashboard and visual load times, error counts, and SPICE and Q index capacity utilization
- Usage analytics, including dashboard views, action invocations, and ingestion statistics.
-
After the CloudFormation stack is deployed:
- In the AWS Glue console, manually run the five Glue jobs to quickly generate the datasets instead of waiting for the next scheduled run.
- After the jobs complete, verify that the data is available in the
admin-suite-[AWS-account-ID]S3 bucket. - Check the CloudWatch metric stream status to confirm that data points are being delivered to the same S3 bucket.
- If the data is present in the S3 bucket and metrics are flowing, proceed with deploying the remaining modules of the Quick Admin Suite.
Enable CloudTrail logging
Create a CloudTrail log if you don’t already have one and note the name of the S3 bucket used to store the log files for future use.
CloudFormation template for data modeling
After deploying the initial CloudFormation stack that configures the AWS Glue jobs and CloudWatch metrics, the next step is to create the data model for querying the Quick Suite administrative data. Use the Launch Stack button to deploy the CloudFormation template that sets up the Athena schema, AWS Glue tables, and database structure to establish the analytics foundation.
![]()
The following table summarizes the keys and values you use when creating the Athena tables with the CloudFormation stack:
| Key | Value | Description |
CloudtrailLocation |
Example: cloudtrail-awslogs-[aws-account-id]-do-not-delete/AWSLogs/[aws-account-id]/CloudTrail/ |
The Amazon S3 location of the CloudTrail log ending with CloudTrail/ |
StartDateParameter |
Example: 2023/02/01 |
The date for the first log CloudTrail delivered to that location, in YYYY/MM/DD format |
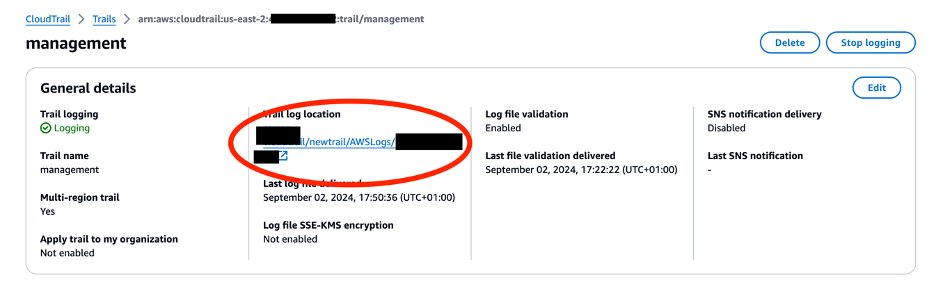
To retrieve the parameters needed to create your Athena tables, complete the following steps:
- Find the location of your CloudTrail logs.
- Go to the CloudTrail management console and choose Trails in the navigation pane.
- You can find the location of your CloudTrail logs in the CloudTrail management console.
- Find date of the first log file delivered by CloudTrail in the S3 management console:
- Go to the Amazon S3 console and choose Buckets in the navigation pane.
- Get the year (for example, 2024 in the screenshot below), month (for example, 01 in the screenshot below), and day (for example, 01 in the screenshot below).
- The date 2024/01/01 (YYYY/MM/DD format) will be the
StartDateParameterfor the data modeling CloudFormation template above.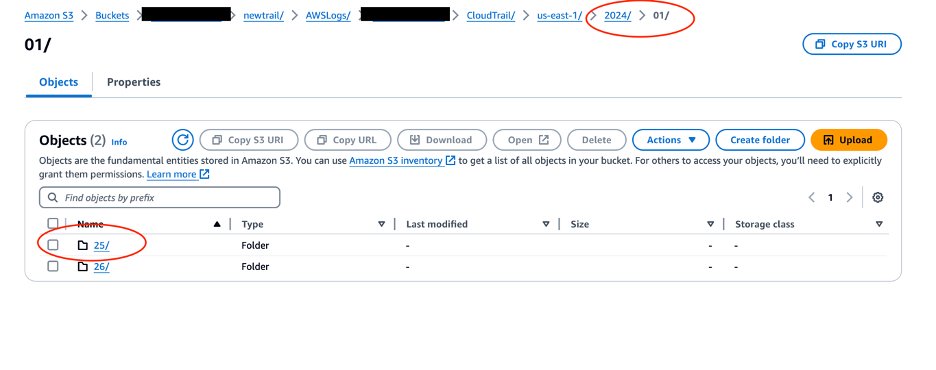
Resources created
The template creates the following key resources:
- AWS Glue database:
admin-console-2025
A central database for the Quick Suite analytics tables
- 17 AWS Glue tables
After the CloudFormation stack is deployed, open the Athena query editor to verify that the initial tables have been created.
| Table | Content |
| Quick Suite asset tables: | |
group_membership |
User groups and role assignments |
object_access |
Asset permissions and access controls |
folder_assets |
Folder membership relationships |
folder_lk |
Folder permissions lookup |
folder_path |
Folder hierarchy and paths |
data_dict |
Dataset column metadata dictionary |
datasets_info |
Dataset lineage and relationships |
q_topic_info |
Quick Suite Q topics metadata |
q_object_access |
Q topic permissions |
datasets_properties |
Dataset ingestion and SPICE properties |
datasource_property |
Data source to dataset mappings |
| CloudTrail table: | |
cloudtrail_logs_pp |
CloudTrail audit logs with partition projection |
| CloudWatch metrics tables (with partition projection): | |
cw_qs_dash_visual |
Dashboard visual metrics |
cw_qs_ds |
Dataset metrics |
cw_qs_spice |
SPICE capacity metrics |
cw_qs_qindex |
Q index metrics |
cw_qs_qaction |
Q action metrics |
CloudFormation template for Athena views
This CloudFormation template creates analytical views and named queries, transforming raw monitoring data into ready-to-use analytics for Quick Suite governance, usage tracking, and cost analysis. Use the Launch Stack button to create the Athena views.
![]()
After the CloudFormation stack deployment is complete, use the CloudFormation console to navigate to the stack’s Resources tab. You will see nine Athena named queries listed there. Keep this tab open and launch the Athena console in a new window. Navigate to Saved queries and use the physical IDs from the CloudFormation Resources tab to locate the correct queries. Open and run each of the nine queries to create your views.
Resources created
This template creates the following resources:
- Two CloudTrail analysis views
- A view of Quick Sight create, update, and delete operations from the last 40 days:
quicksight_crud_events_view - A view of database query events with extracted metadata (datasource, query, and dataset IDs):
quicksight_querydb_events_view
- A view of Quick Sight create, update, and delete operations from the last 40 days:
- Cost analysis view:
qs_usage_cur_vw
Quick Sight usage and cost breakdown from AWS Cost and Usage Reports (AWS CUR). It categorizes usage types: Users (enterprise and standard), reader, SPICE, Alerts, Q, paginated reporting, and monthly aggregation with unblended and blended costs.
- Four CloudWatch metrics pivot views
- Dataset ingestion metrics (error count, invocation count, latency, row count):
cw_qs_ds_pivot - Dashboard performance (view count, load times, error count by visual):
cw_qs_dash_visual_pivot - SPICE capacity utilization (limit vs consumed in MB):
cw_qs_spice_pivot - Q index metrics (document count, text size by instance):
cw_qs_qindex_pivot
- Dataset ingestion metrics (error count, invocation count, latency, row count):
- A combined data view:
qs_ds_info_combined_view
Unified dataset properties with lineage information by joining dataset properties with data source metadata
Analytics capabilities enabled
The following table lists the analytics capabilities that are enabled by this template.
| Category | Key insights and metrics |
| Governance and compliance |
|
| Performance monitoring |
|
| Cost optimization |
|
| Operational insights |
|
This template transforms complex raw data into queryable business views, so that administrators can build comprehensive Quick Suite dashboards for monitoring, governance, and optimization without writing complex SQL.
Additional CloudFormation template for chat history and chat feedback
This CloudFormation template creates data pipeline and Athena tables for Quick Suite chat history and chat answer feedback. Use the Launch Stack button to set up CloudWatch vended logs delivery for Quick Suite chat and feedback logs to Amazon S3 for analytics.
![]()
Resources created
The following table shows the resources created by this stack.
| Resource type | Resource name | Resource usage and notes |
| Glue tables | ||
qs_chat_log |
Chat interaction logs with user messages, system responses, attachments. s3://admin-suite-{account}/monitoring/quicksight/cw-vended-log/chat-log/ |
|
qs_feedback_log |
User feedback logs with ratings, thumbs up/down, feedback reasons. s3://admin-suite-{account}/monitoring/quicksight/cw-vended-log/feedback-log/ |
|
| CloudWatch log groups | ||
qs-chat-log-group |
30-day retention | |
qs-feedback-log-group |
30-day retention | |
| Vended log delivery pipeline | ||
DeliverySource |
Quick Suite account as log source | |
DeliveryDestination |
S3 bucket paths for each log type |
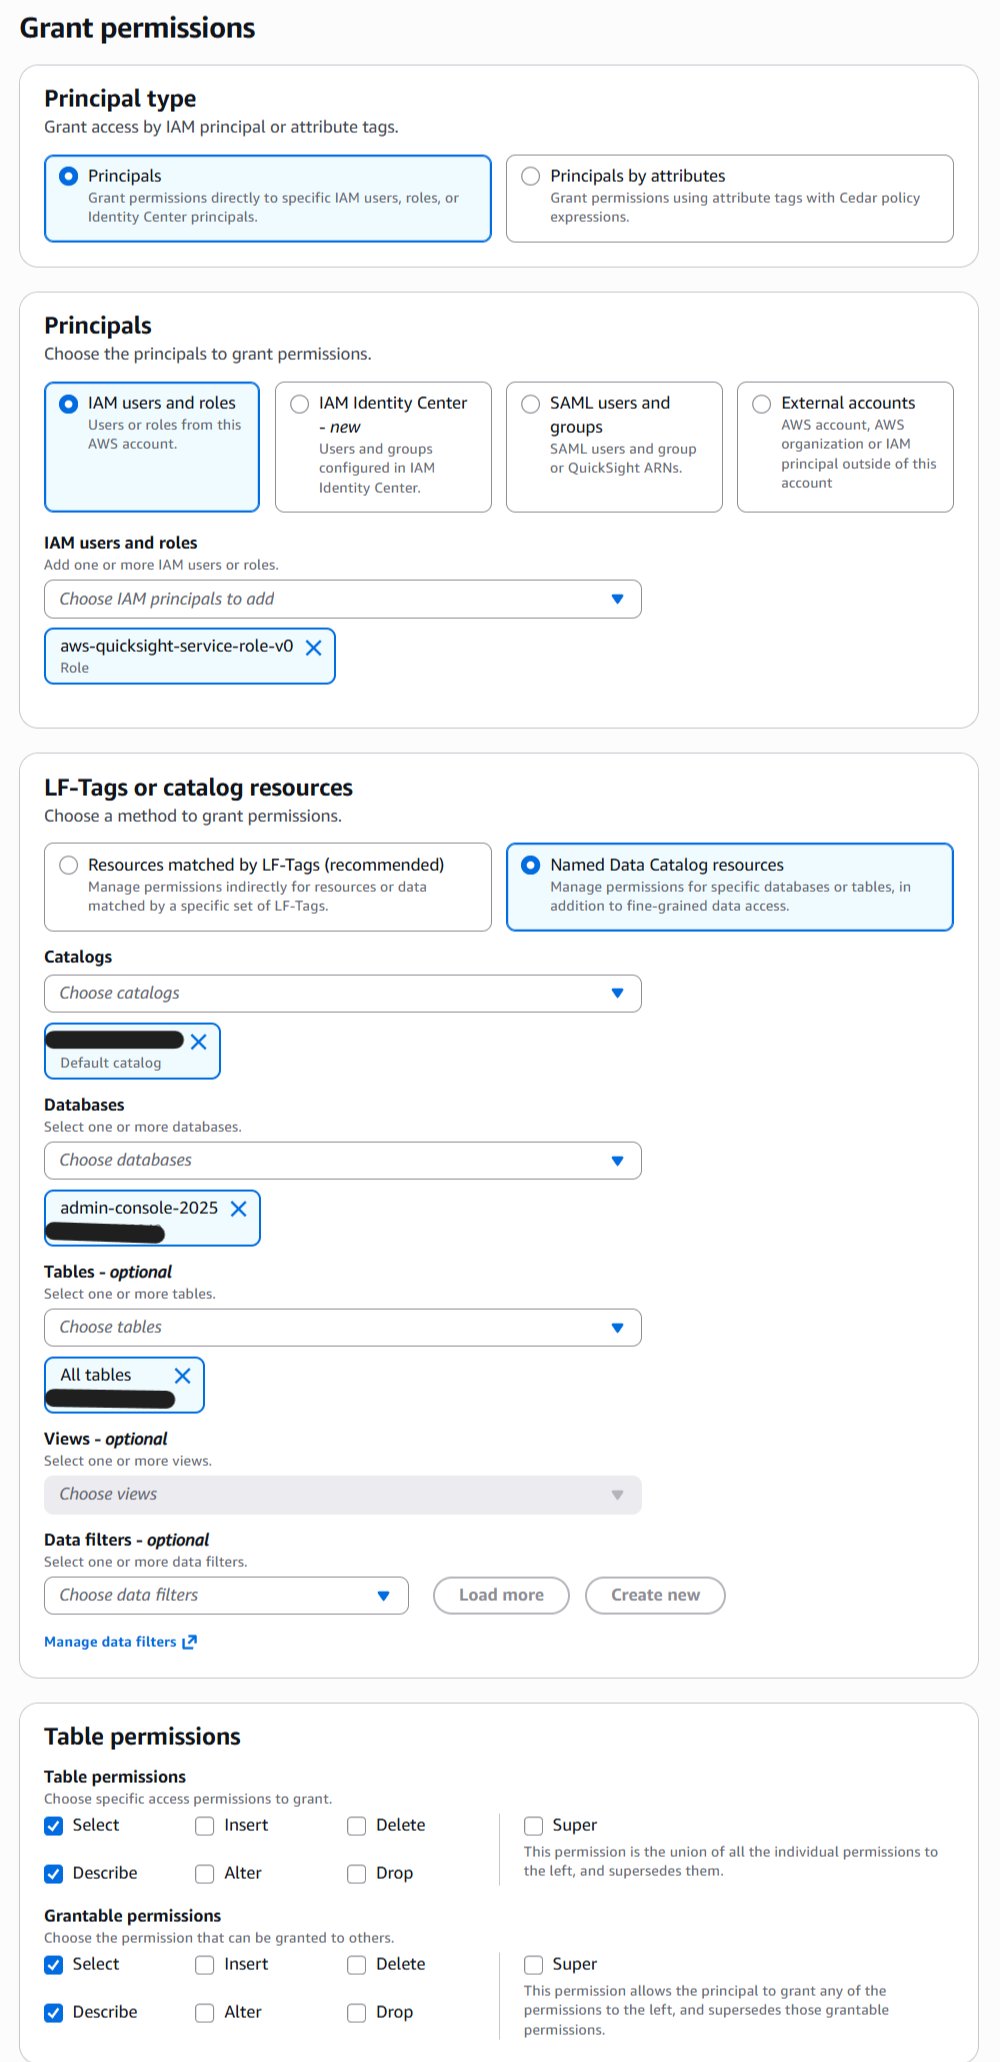
When the template is complete, go to the Lake Formation console to grant the database and table access to the Quick Sight service role.
- Go to Lake Formation console.
- Choose Admin-Console-2025 database.
- Choose Tables – optional and select All Tables.
- Grant Select and Describe permissions to the Quick Sight Service Role and the role named
QuickSuiteAdmin, which was created in the first CloudFormation template of this blog post.
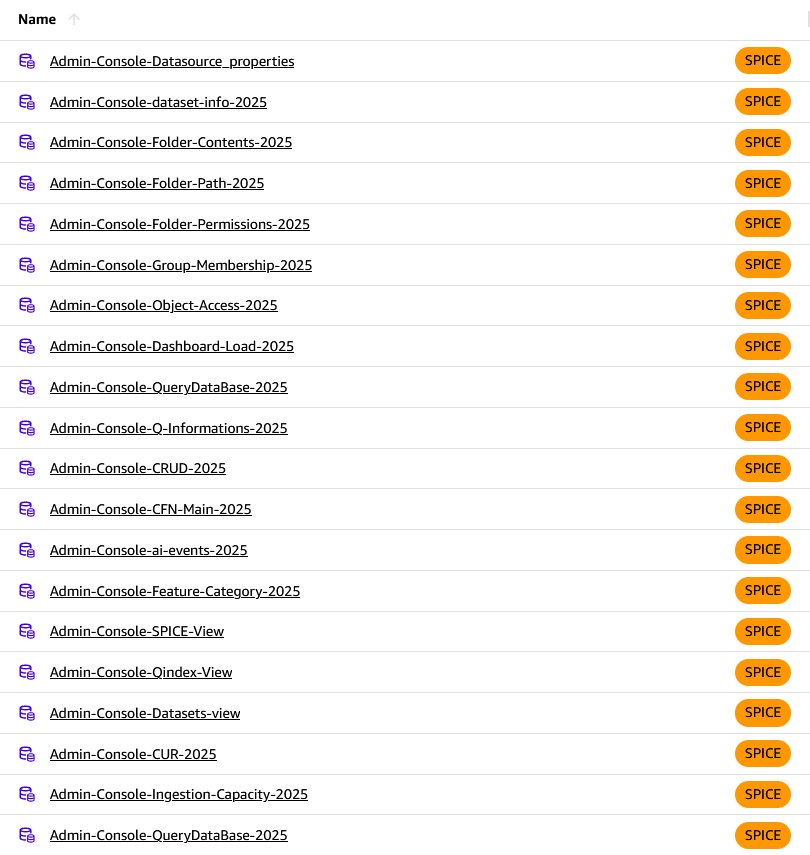
Sample datasets and dashboard walkthrough
When you launch this stack, it creates the Athena data source, builds the required Quick Sight datasets (19), and creates an analysis that’s ready to publish, no manual wiring needed. After the stack completes, you’ll be able to explore visuals for usage and adoption, lineage mapping, and other administrative metrics. Use the Launch Stack button to deploy the template to your account, then follow the walkthrough to understand each dataset and how the analysis fits together.
![]()
The following image is an overview of each dataset—what it contains, why it matters, and how you can use it in day-to-day work.
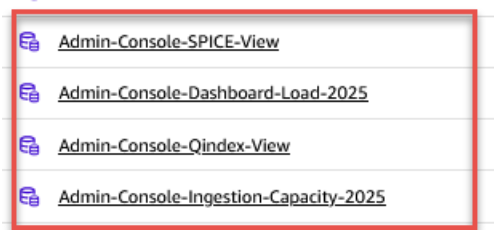
The Admin-Console-SPICE-View, Dashboard-load, Qindex-View, and Ingestion-capacity datasets are created as direct query datasets to reduce the CloudFormation stack creation time. Change them to SPICE after creation to avoid query timeouts.
These datasets, shown in the following table, provide comprehensive visibility into your Quick Suite environment, covering user management, security, performance monitoring, cost analysis, and feature utilization across all aspects of your Quick Suite deployment.
| Dataset name | Athena tables and views | Dataset purpose |
Admin-Console-CFN-Main-2025 |
cloudtrail_logs_pp
group_membership
object_access |
Dashboard usage analytics combining CloudTrail events with user group memberships and object access permissions. Tracks the last 99 days of GetDashboard events for user adoption analysis, license optimization, and identifying inactive users. |
Admin-Console-ai-events-2025 |
cloudtrail_logs_pp |
AI and automation feature usage tracking from CloudTrail logs (last 40 days). Captures events related to flow, research, document processing, agents, chat, knowledge base, workflow, space, and automation features to measure AI feature adoption and ROI. |
Admin-Console-Feature-Category-2025 |
cloudtrail_logs_pp |
Categorized view of AI feature usage that automatically groups CloudTrail events into logical categories (flow, research, knowledge base, agent, action, space, automation, chat, and workflow). Provides executive-level insights into AI feature utilization patterns. |
Admin-Console-Datasource_properties |
datasource_property |
Comprehensive data source inventory containing AWS Region, datasource names, IDs, dataset relationships, datasource types (AThena, S3, and file type), and timestamps. Essential for data governance, connection management, and troubleshooting. |
Admin-Console-dataset-info-2025 |
datasets_info, data_dict |
Complete dataset catalog combining basic dataset metadata with detailed data dictionary information. Master reference for data lineage, impact analysis, and comprehensive dataset management including SQL queries and column-level metadata. |
Admin-Console-Folder-Contents-2025 |
folder_assets, object_access, folder_path |
Detailed folder organization showing content (member IDs) in each folder with complete access control information and folder paths. Reveals content organization strategy and helps identify orphaned content. |
Admin-Console-Folder-Path-2025 |
folder_assets, folder_lk, folder_path |
Folder structure hierarchy mapping showing the complete organizational tree with folder IDs, Regions, account IDs, names, and paths. Helps visualize content architecture and plan folder restructuring initiatives. |
Admin-Console-Folder-Permissions-2025 |
folder_lk |
Granular folder-level security matrix showing account IDs, Regions, object types, folder names, principal types (user or group), principal names, and detailed action permissions. Critical for security audits and compliance reporting. |
Admin-Console-Group-Membership-2025 |
group_membership |
Complete user directory showing account IDs, namespaces, group assignments, user names, email addresses, roles (ADMIN, AUTHOR, READER, AUTHOR_PRO, READER_PRO), identity types, and user Amazon Resource Names (ARNs). Fundamental for user management and license tracking. |
Admin-Console-Object-Access-2025 |
object_access, group_membership |
Comprehensive security matrix combining individual object permissions with group memberships. Definitively answers who can access what and how, essential for security audits and access troubleshooting. |
Admin-Console-Dashboard-Load-2025 |
cw-qs-dash-visual-pivot, datasets_info |
Performance monitoring dataset tracking dashboard and visual load times with dashboard name mapping. Helps identify performance bottlenecks and prioritize dashboard performance improvements based on actual usage patterns. |
Admin-Console-QueryDataBase-2025 |
quicksight_querydb_events |
Detailed database query activity logs with flattened user identity and resource information. Essential for query performance analysis, understanding data access patterns, and database optimization efforts. |
Admin-Console-Q-Informations-2025 |
q_object_access, q_topic_info |
Amazon Q integration analytics combining Q topic access permissions with topic configuration details. Measures Q adoption effectiveness and tracks natural language query usage. |
Admin-Console-CRUD-2025 |
quicksight_crud_events |
Comprehensive audit trail of all create, read, update, and delete operations with flattened user identity and resource information. Critical for compliance, security monitoring, change management, and maintaining complete audit history. |
Admin-Console-SPICE-View |
cw_qs_spice_pivot |
SPICE capacity monitoring showing capacity limits and consumption in megabytes over time. Essential for capacity planning, cost optimization, and supporting optimal SPICE performance. |
Admin-Console-Qindex-View |
cw_qs_qindex_pivot |
Amazon Q indexing system metrics tracking Q index document counts and extracted text sizes. Monitors the health and performance of the Amazon Q natural language processing system. |
Admin-Console-Datasets-view |
qs_ds_info_combined |
Consolidated dataset information combining region, dataset details, import modes, SPICE capacity usage, ingestion statistics, refresh information, principal permissions, and data source mappings. Used for dataset governance and optimization. |
Admin-Console-CUR-2025 |
qs_usage_cur_vw |
Financial analytics from AWS Cost and Usage Reports showing detailed QuickSight billing including usage types, product groups (User Subscription, Reporting, Amazon Q), pricing units, and costs. Essential for cost management and ROI analysis. |
Admin-Console-Ingestion-Capacity-2025 |
cw-qs-ds-pivot, data_dict, cw_qs_spice_pivot |
Data processing analytics combining dataset ingestion metrics with SPICE capacity information and dataset names. Optimizes refresh schedules, identifies data processing bottlenecks, and ensures reliable data availability. |
Admin-Console-QueryDataBase-2025 |
quicksight_querydb_events, datasource_property |
Advanced database query analytics with enhanced data source mapping and database type information. Provides deeper insights into query patterns and data source performance characteristics. |
Admin-Console-qs-action-info-2025 |
cw-qs-action-pivot |
Quick Sight action and interaction metrics tracking timestamps, account IDs, Regions, action connector IDs and types (such as EXTERNAL_SEARCH), action IDs, invocation error codes, error counts, and invocation counts. This dataset tracks user interactions with Quick Sight actions and connectors, measuring feature utilization, identifying popular actions, and monitoring action performance and error rates for optimization purposes. |
Key dashboard sheets to explore
We recommend reviewing each tab of the analysis at least once. Each tab surfaces different aspects of your Quick Suite environment, and you will find a lot of useful details and insights there. If you want to see how these pieces come together, you can also browse an admin console demonstration.
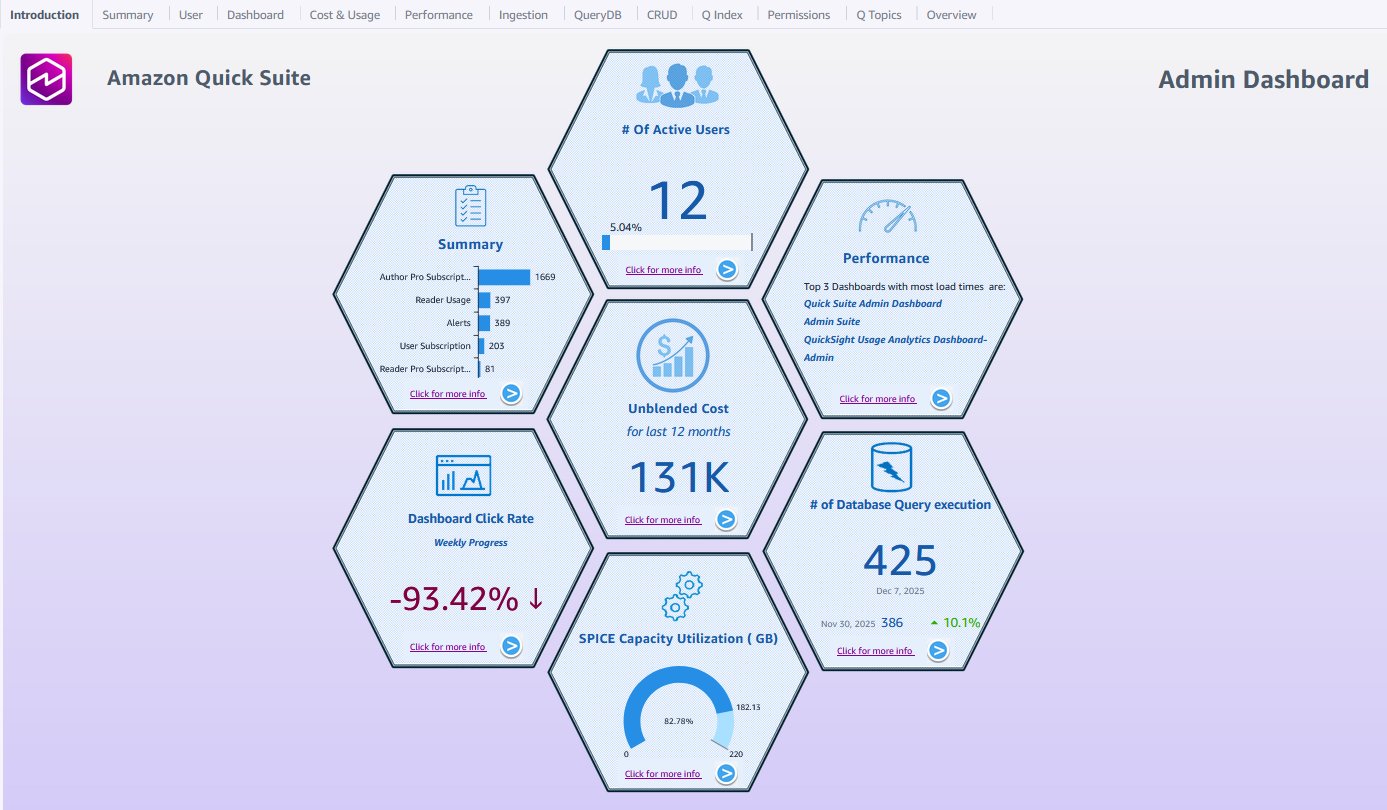
Introduction: The introduction sheet, shown in the following screenshot, is your launch pad, displaying a key metrics overview and providing navigation guidance to detailed analysis sheets for key focus areas of Quick Suite administration. The landing page gives you immediate visibility into system health with high-level KPIs while directing you to the specific areas that need attention.
Summary: The Summary sheet, shown in the following screenshot, aggregates critical metrics from across your Quick Suite environment into key visualizations that tell the story of platform health, user engagement, and business value. Use it for Quick Suite briefings to stakeholders who need the big picture without diving into operational details. It provides high-level insights such as active user counts, dashboard utilization rates, and high-level adoption metrics of recently introduced agentic AI features.
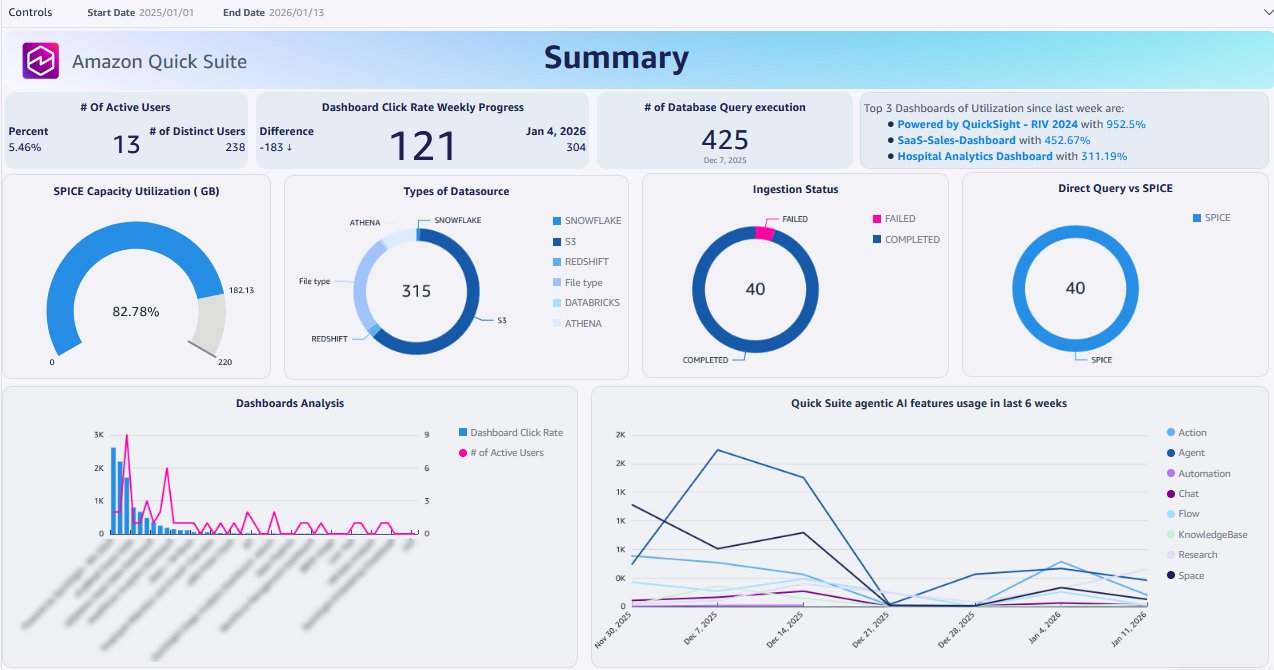
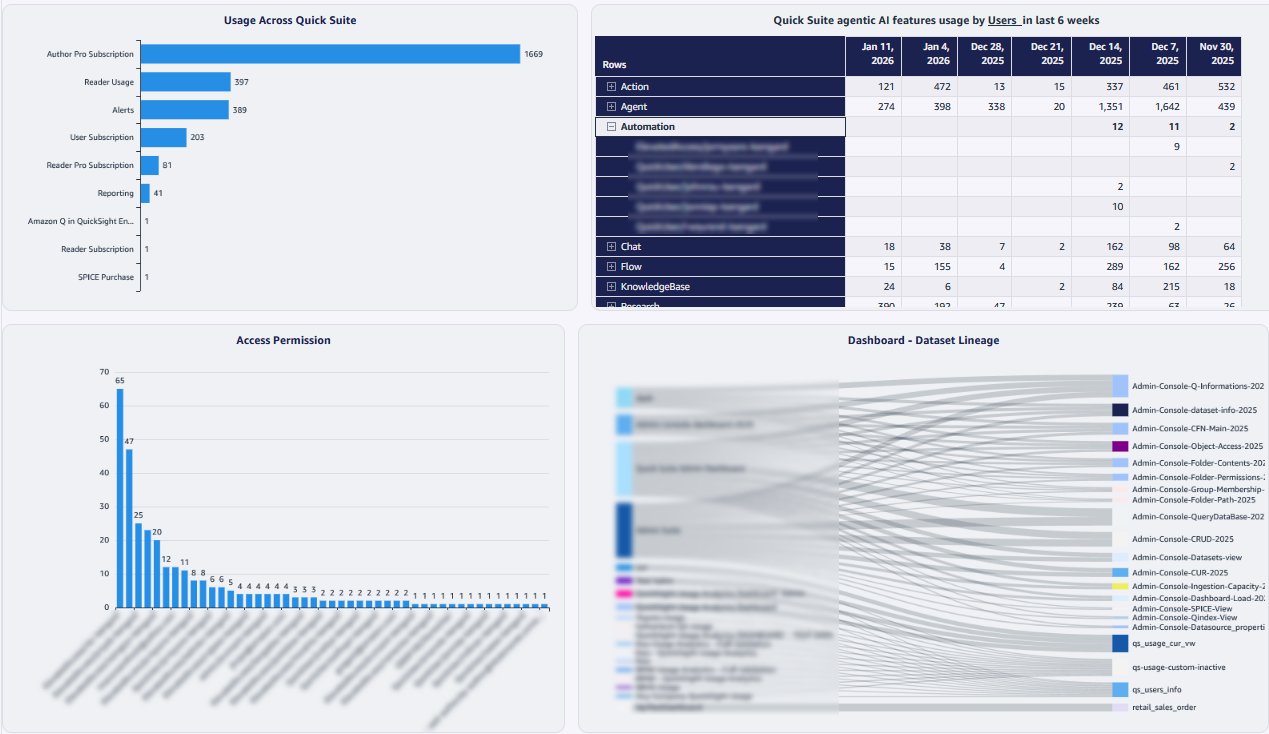
You can further understand roles usages across your environment, adoption of agentic AI features at the user level, and user permission statistics.
User Activity: User activity analysis, shown in the following screenshot, shows engagement patterns, sign in frequency, utilization rates, and inactive user identification to support license optimization.
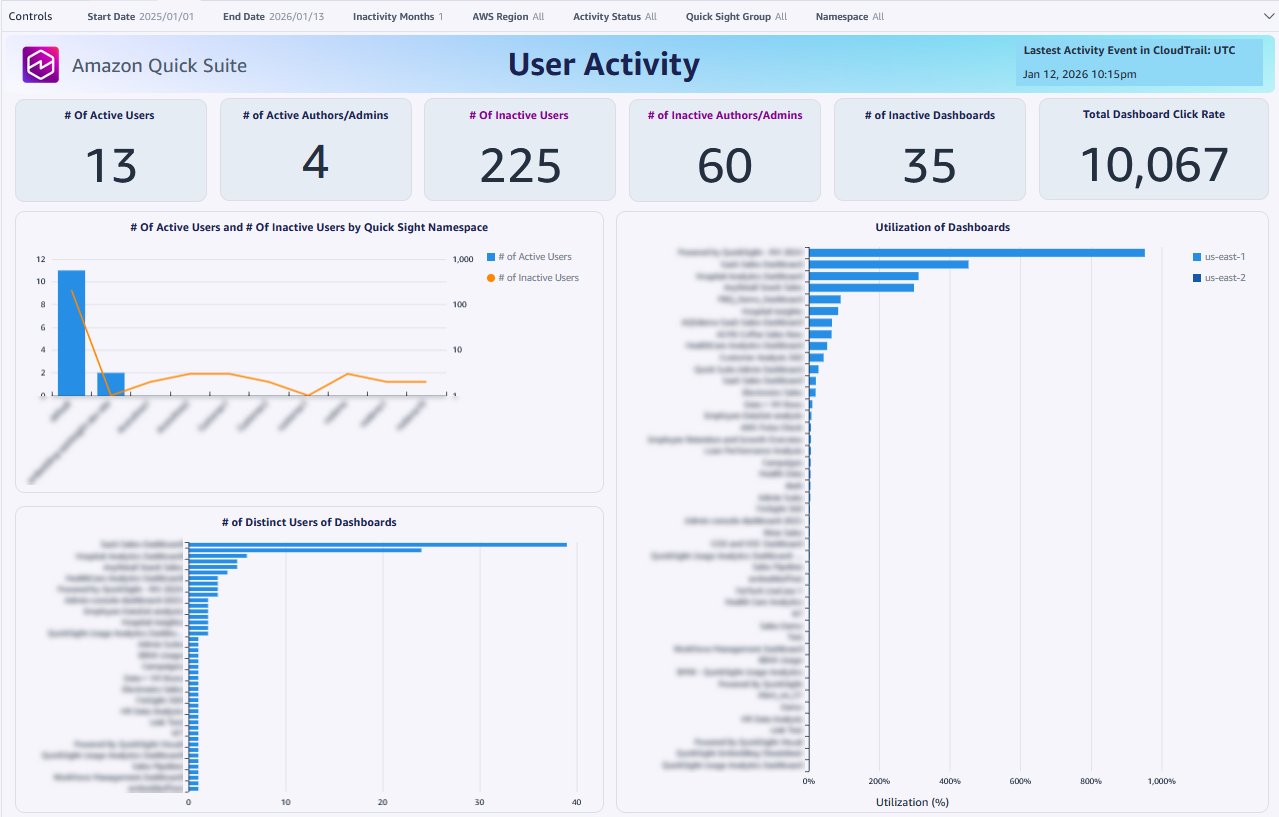
As shown in the following screenshot, the User Activity sheet also shows user-by-user adoption metrics including active status, group memberships, email addresses, days since last sign-in, and total access counts, making it straightforward to identify inactive accounts for remediation and teams that might need to be enabled. You can use this analysis to help optimize license costs by identifying unused accounts across the namespace, plan training programs based on engagement patterns, and ensure proper user lifecycle management within your organization.
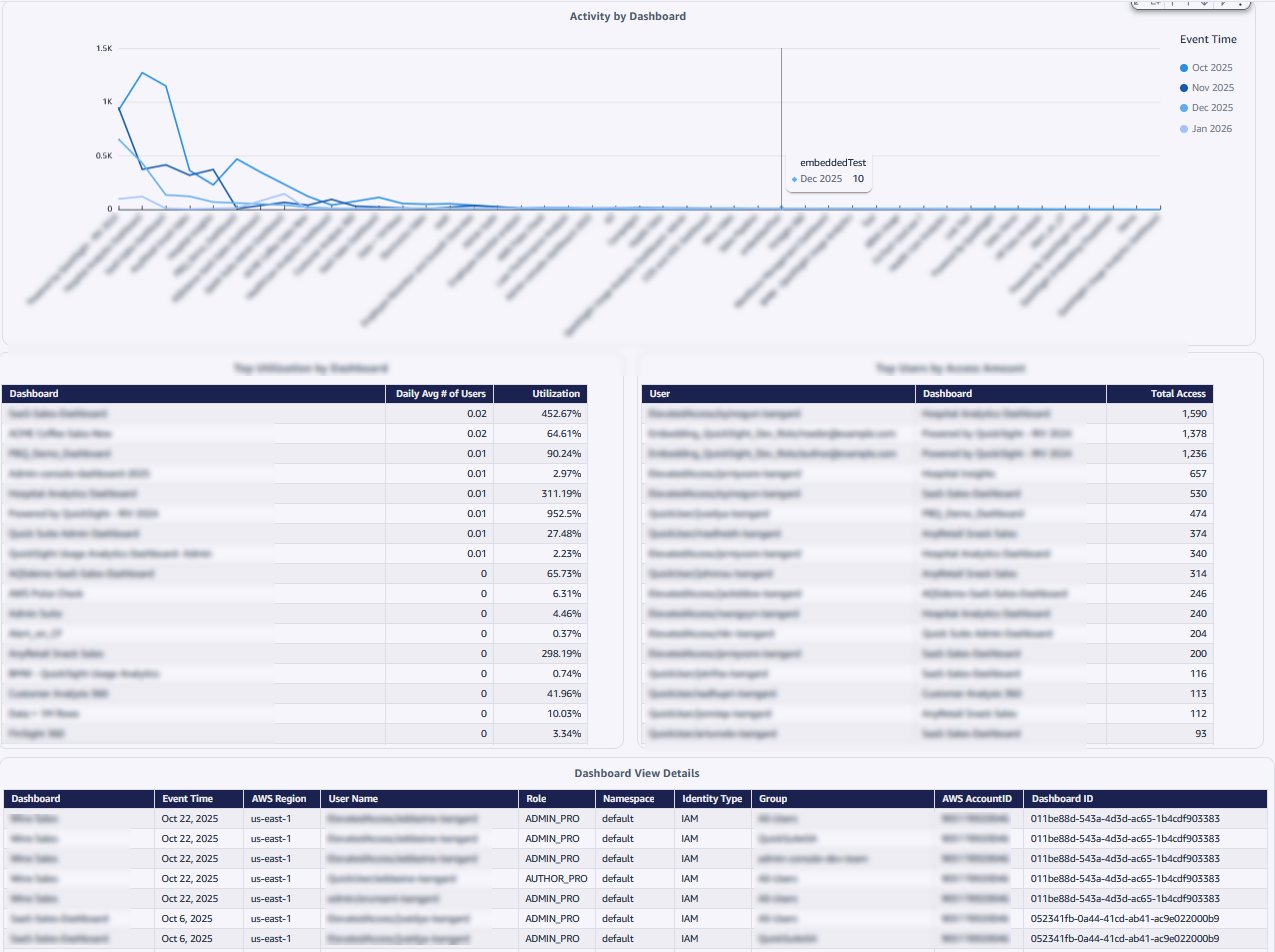
Dashboard Usage: This sheet, shown in the following screenshot, displays performance analytics here including access patterns, popularity metrics, and usage statistics to optimize content strategy and user experience. You will find visuals showing top dashboards by utilization, most active users by access frequency, and dashboard ownership details that help you decide what content to promote, retire, or optimize.
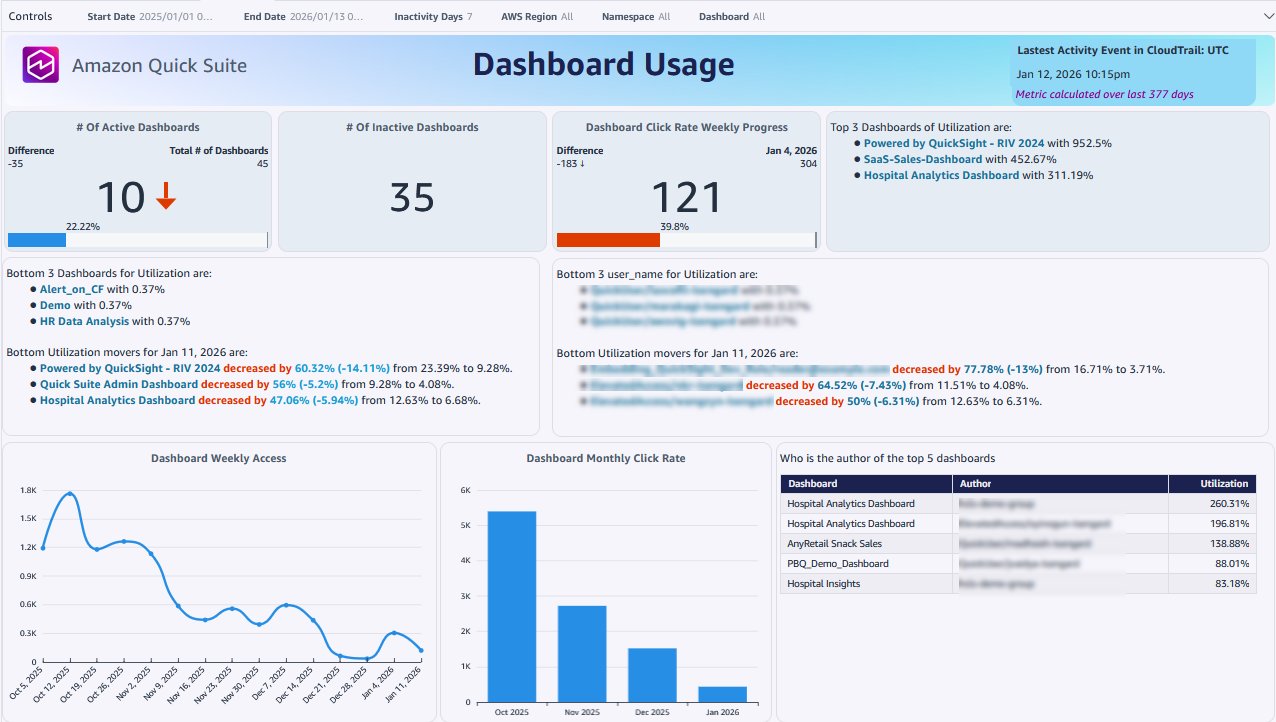
This dashboard, shown in the following screenshot, provides insight into which dashboards drive the most value based on selected time frame and show content consumption patterns that inform your content governance and optimization strategies. It provides dataset and data source usage details across dashboards, which can be key to impact analysis for some data sources.
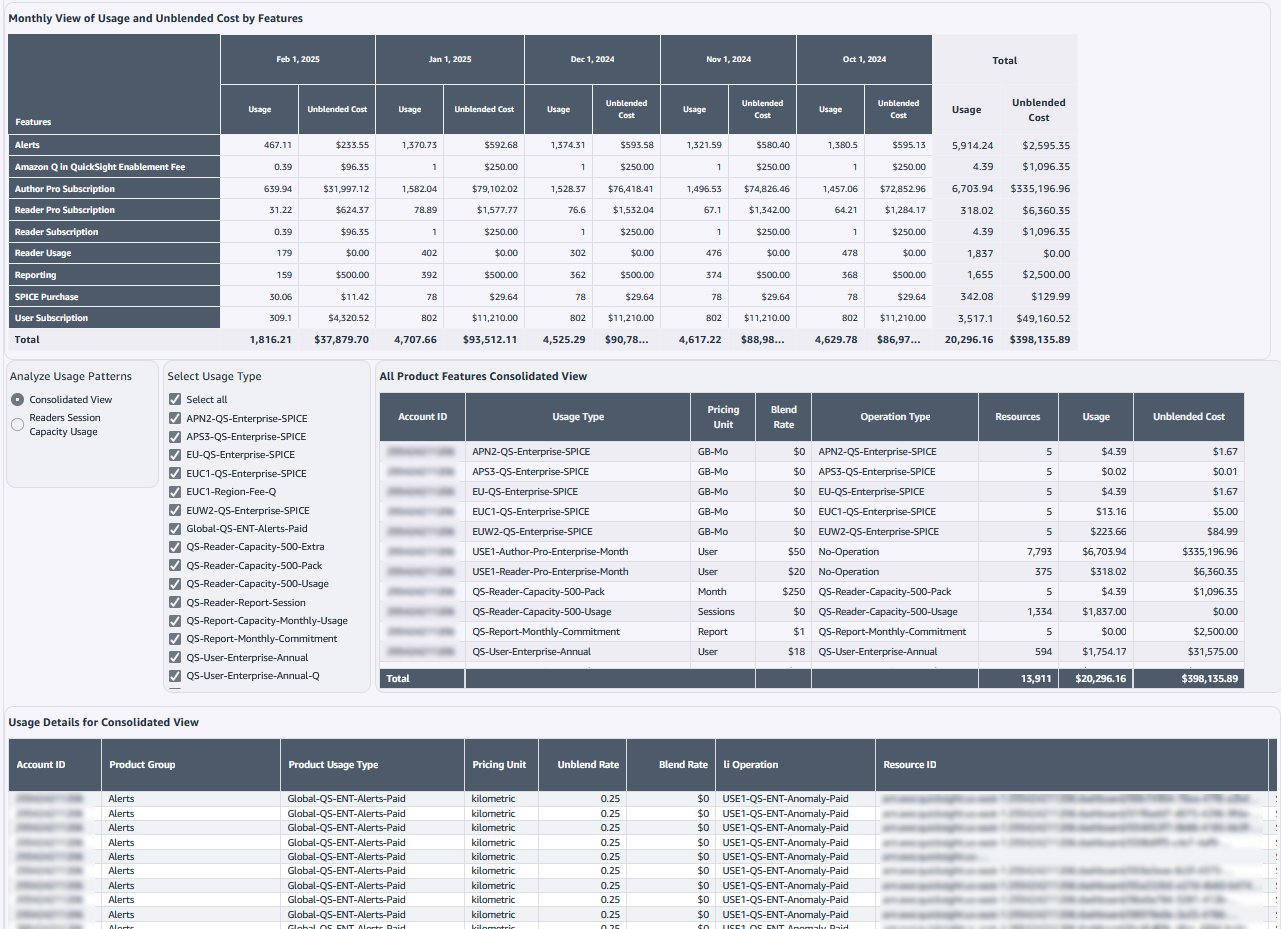
Cost and Usage Metrics: The Cost and Usage Metrics sheet, shown in the following screenshot, provides financial tracking from AWS billing data including Quick Suite subscription costs, feature charges, SPICE usage fees, and detailed usage patterns for budget planning and cost optimization.
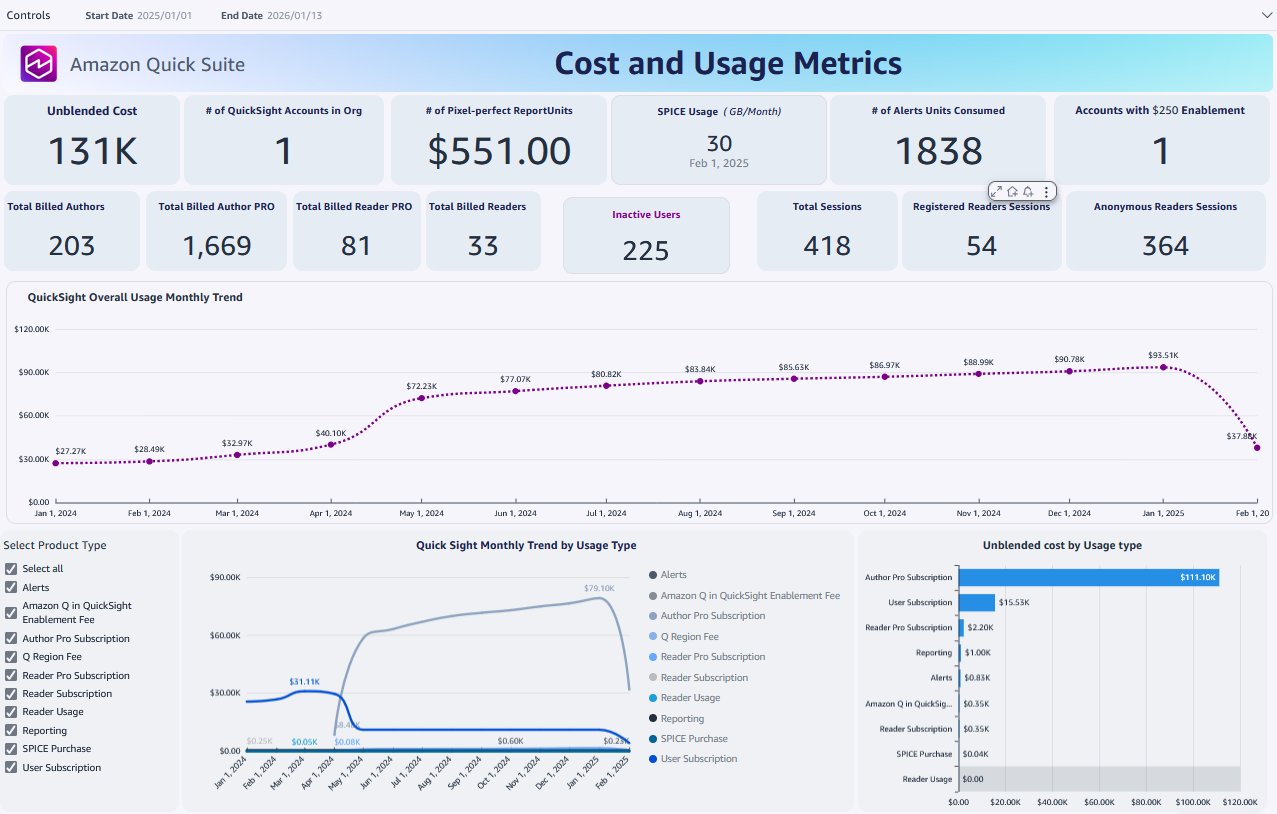
This sheet breaks down costs by user types, feature utilization, and time periods, as shown in the following screenshot. You can use the information to understand where your Quick Suite and especially BI (Quick Sight) investment is going and identify opportunities for cost savings. You can track subscription trends, forecast future costs based on usage patterns, and make data-driven decisions about license types and feature adoption to optimize your total cost of ownership.
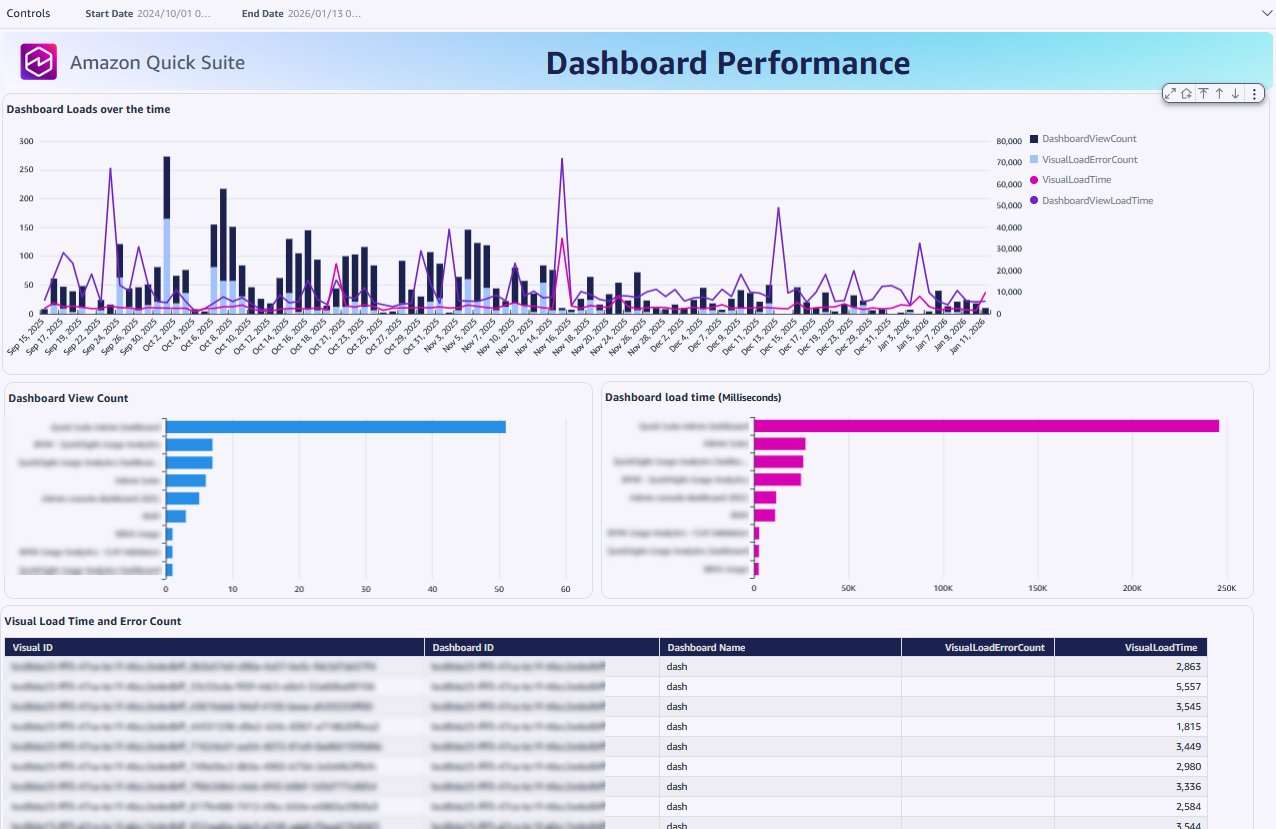
Dashboard Performance: This sheet, shown in the following screenshot, offers system performance monitoring with SPICE capacity utilization, dashboard load times, visual rendering performance, and system health indicators to maintain optimal Quick Suite operations. It helps you identify performance bottlenecks before they impact users, optimize SPICE usage for cost and speed, and ensure your dashboards meet performance SLAs. You will see metrics on dashboard and visual load times, capacity consumption trends, and system resource utilization that enable proactive performance management and capacity planning.
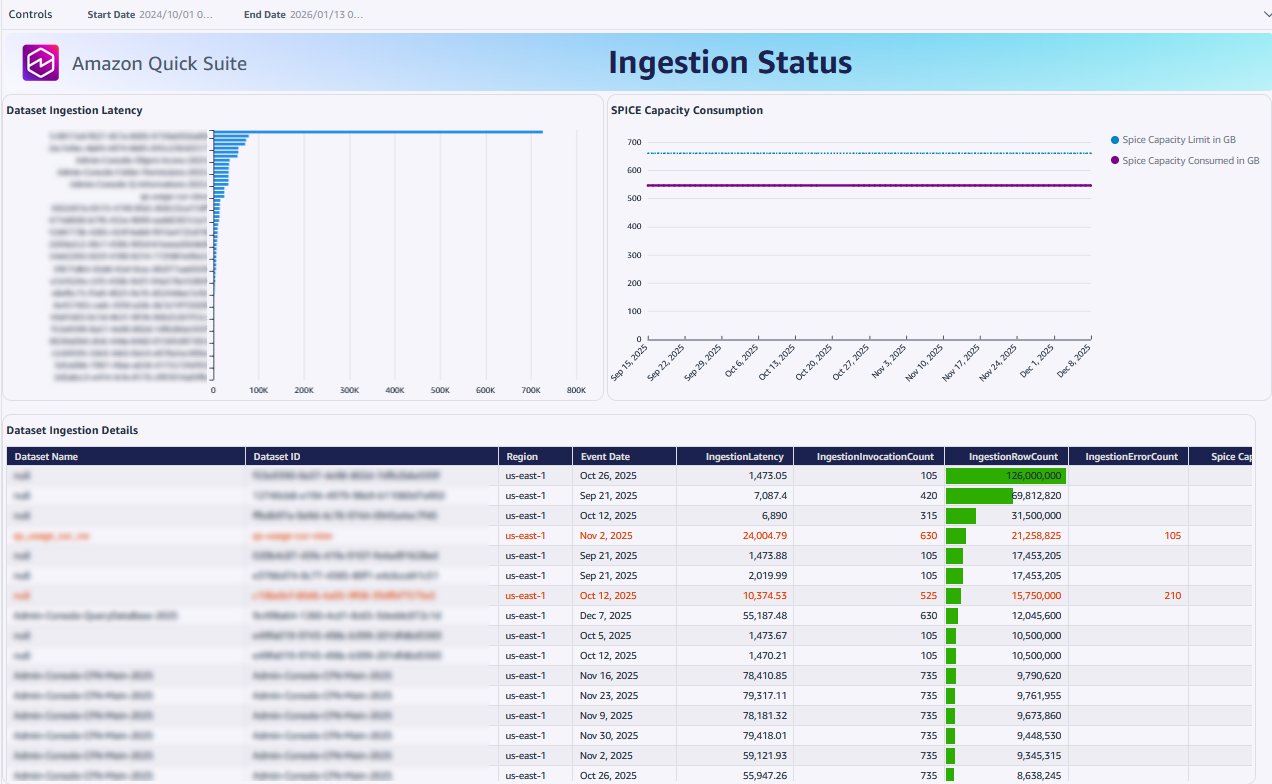
Ingestion Status: This sheet, shown in the following screenshot, tracks data ingestion analytics including dataset refresh performance, SPICE capacity consumption, and ingestion success rates. It shows you how your data ingestion tasks are performing, identifies datasets that might need refresh schedule optimization, and helps you manage SPICE capacity efficiently.
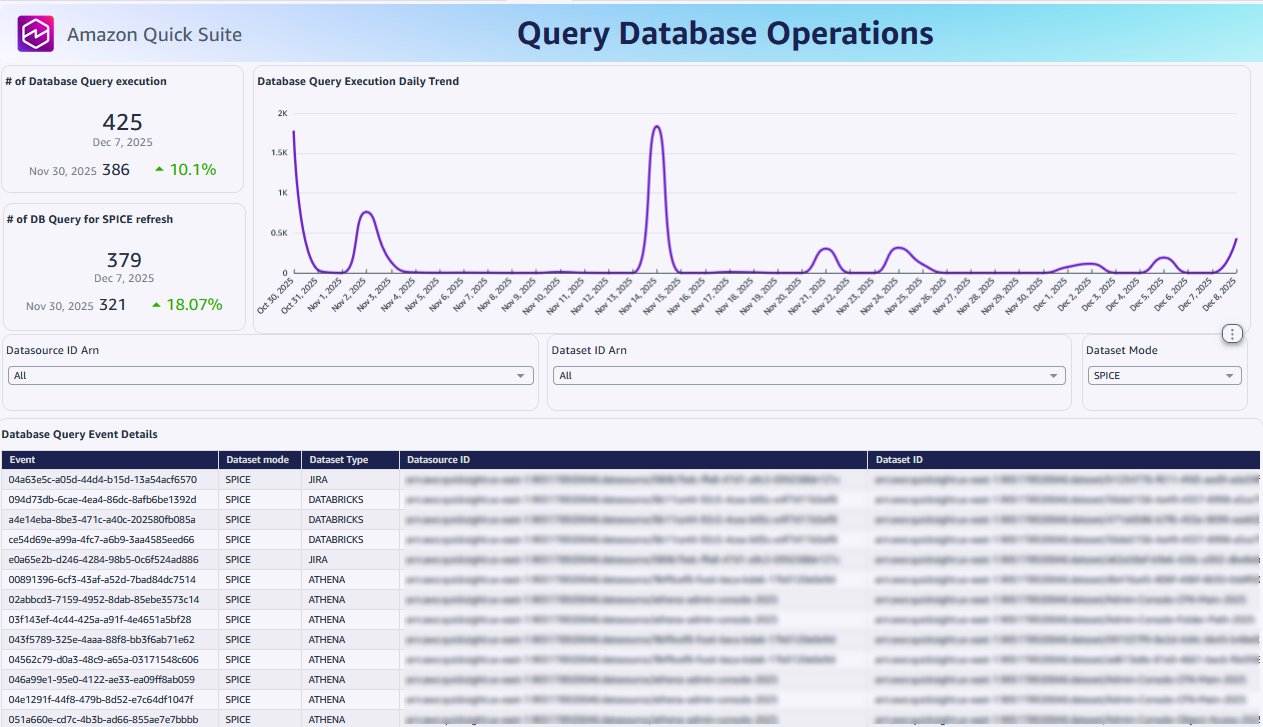
Query Database Operations: The Query Databae Operations sheet, shown in the following screenshot, provides database query performance analysis showing query execution patterns by data source. This analysis identifies frequently accessed data sources and shows query trends by dataset mode.
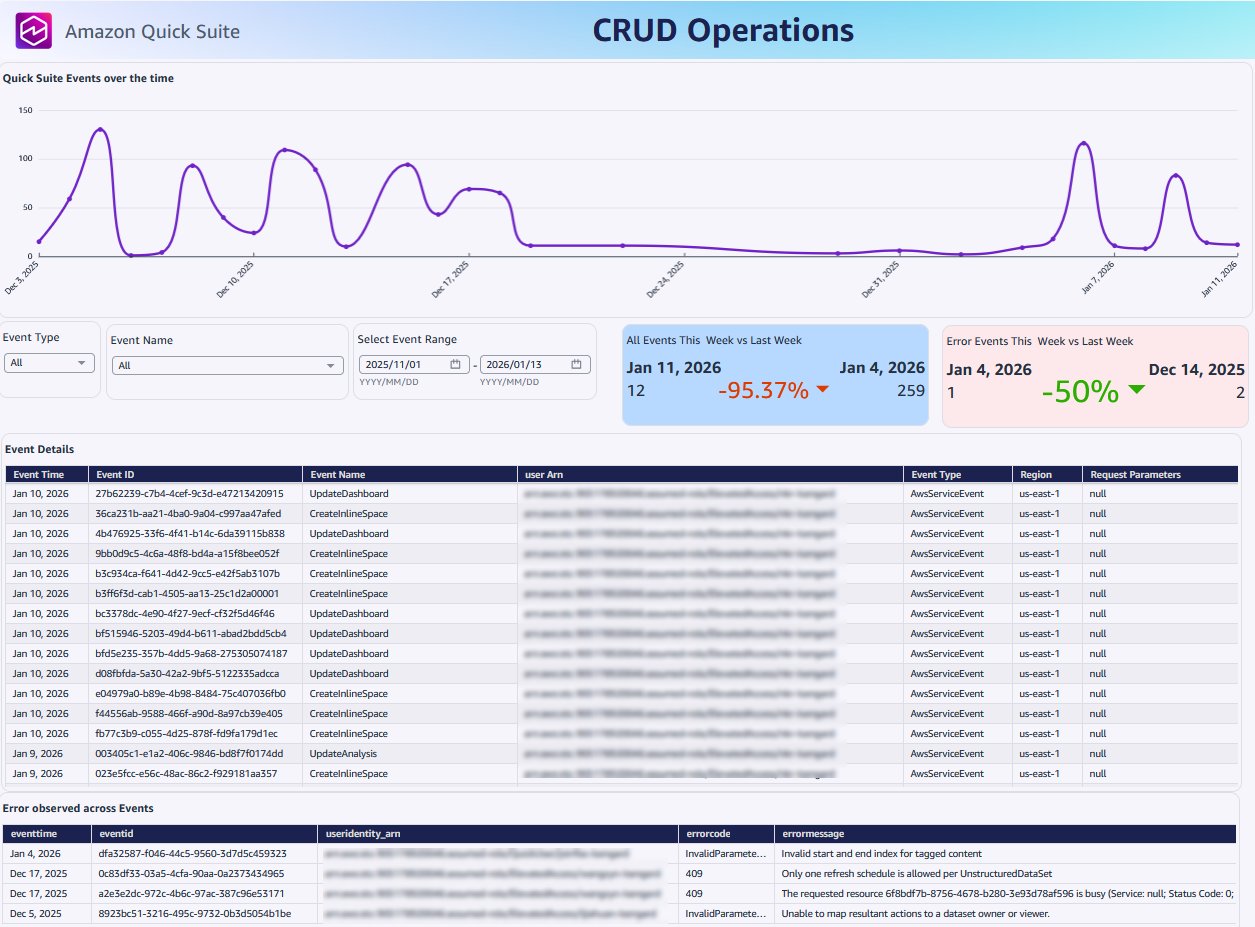
CRUD Operations: The CRUD sheet, shown in the following screenshot, maintains a comprehensive audit trail of create, read, update, delete (CRUD) operations on Quick Suite objects for compliance monitoring, change tracking, and security auditing across your environment. This sheet provides complete visibility into who’s making what changes and when. Information on this sheet includes user context, timestamps, and detailed operation information and can be essential for governance and monitoring.
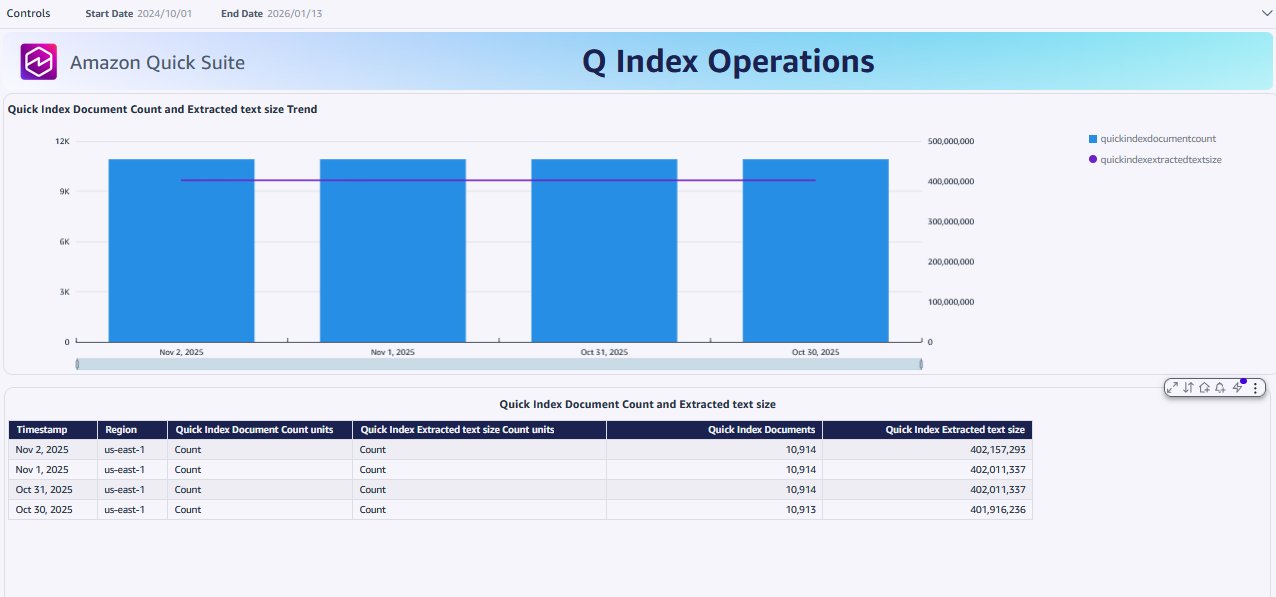
Q Index Operations: This sheet, shown in the following screenshot, shows Amazon Q indexing system health metrics tracking document counts, text processing, and natural language query infrastructure performance.
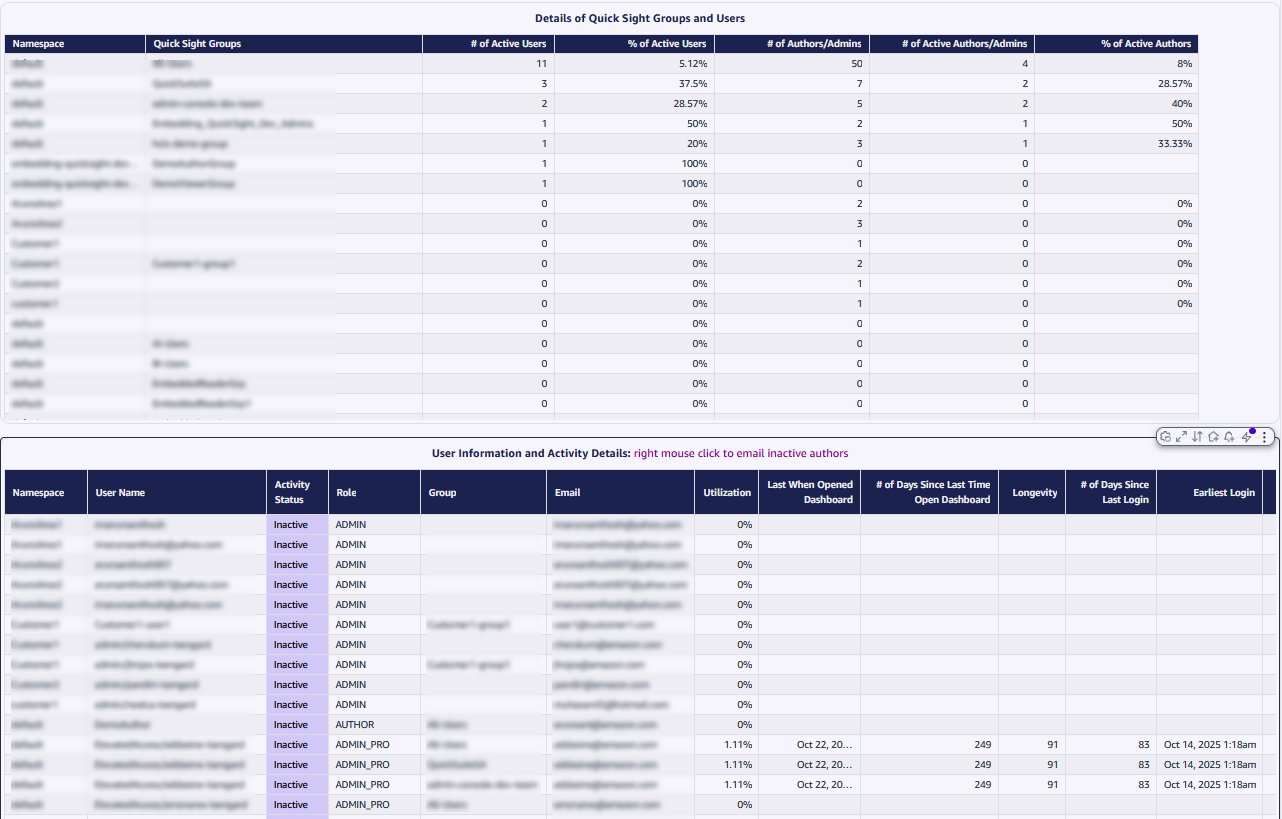
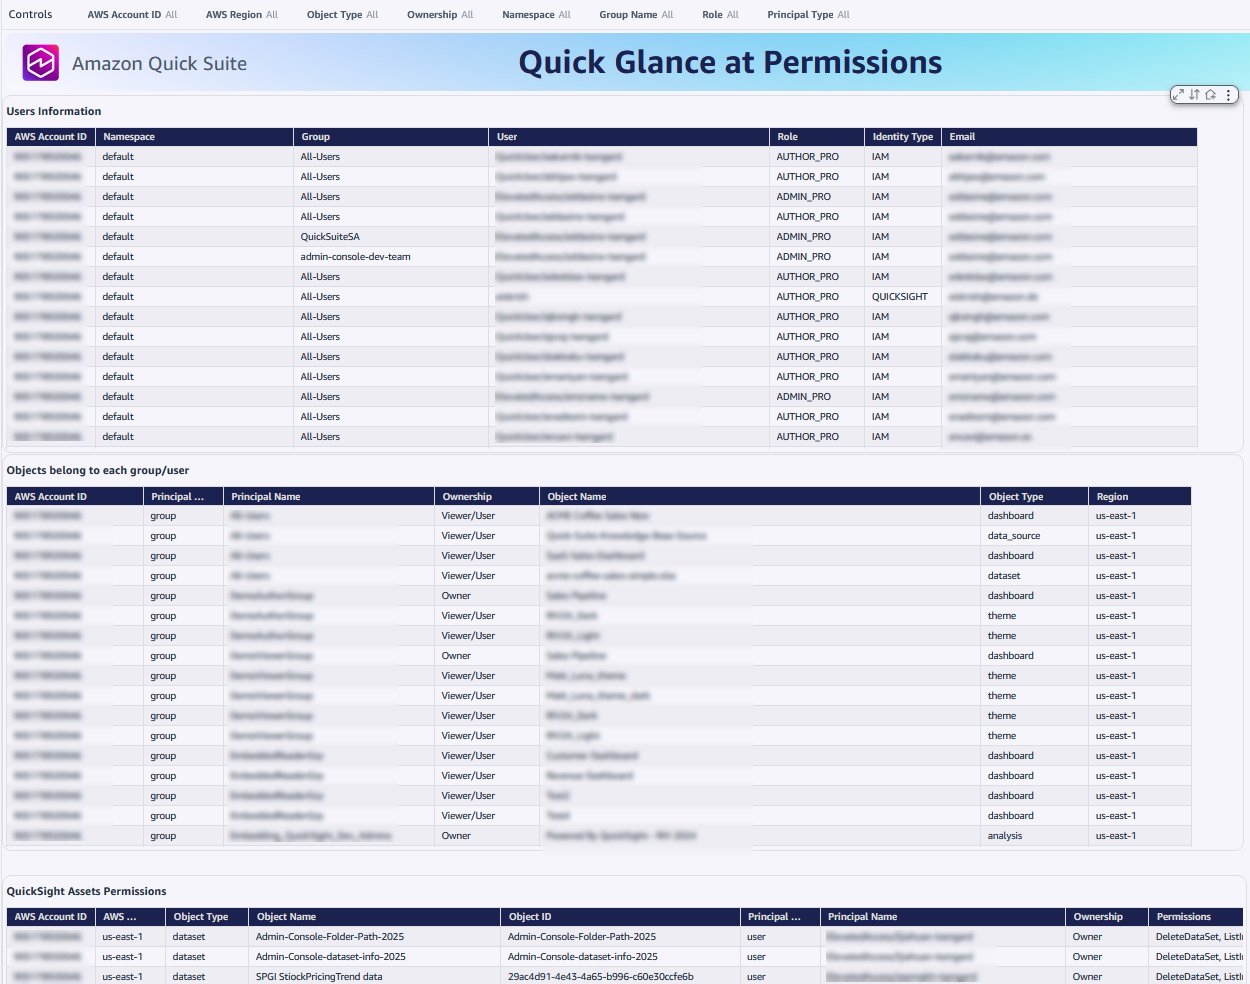
Quick Glance at Permissions: The Permissions sheet, shown in the following screenshot, provides a comprehensive security and access control matrix showing user permissions, object access rights, group memberships, and detailed authorization information for governance. It can answer some of your critical questions like “who has access to what content and how?” by combining individual permissions with group memberships to show the complete access picture in your account.
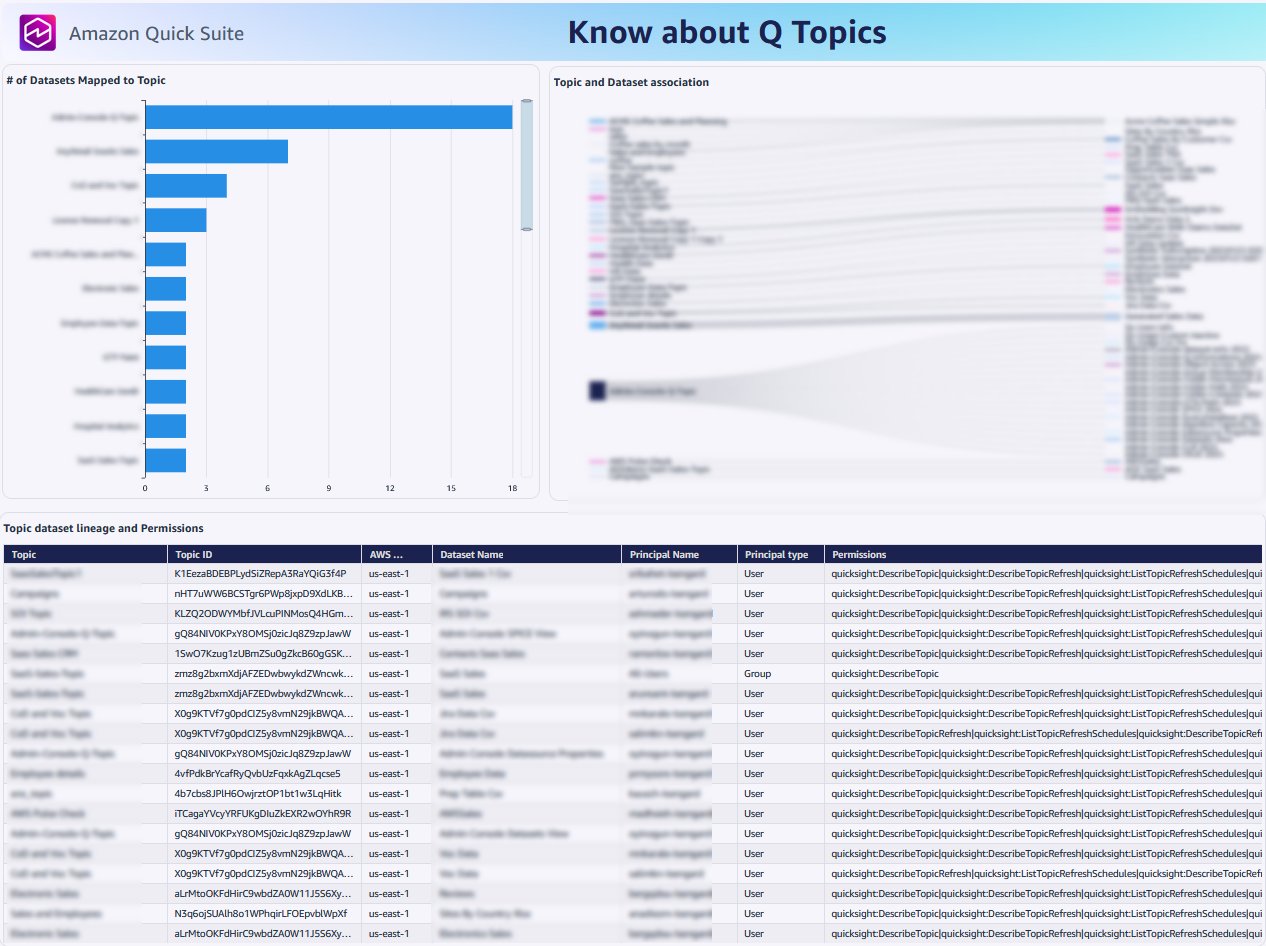
Know about Q Topics: The Q Topics sheet, shown in the following screenshot, manages Amazon Q topic configurations showing topic setups, dataset associations, and natural language query mappings. This analysis helps you understand how users interact with Q and which topics are most successful, You can track topic usage patterns, monitor Q adoption metrics, and ensure your semantic layer is properly configured to deliver accurate responses to user questions using topics.
Overview: This sheet serves as reference guide and documentation center for the Quick Suite Admin Dashboard. It provides detailed explanations of dashboard controls and selectors, comprehensive terminology definitions for key metrics like utilization and longevity, and complete user role descriptions including author compared to reader permissions and pricing. The sheet includes the complete Quick Suite Dataset Quick Reference catalog with descriptions of the datasets used throughout the dashboard, which you can use to understand exactly what data powers each analysis. Additionally, it provides valuable external resources including step-by-step implementation guidance, CloudFormation templates, and links to the Quick Suite community for ongoing support.
Q topic setup
With Amazon Q in Quick Suite, users can use generative BI to ask natural language questions about their data without writing code or building models. For complex or multiple datasets, Q topics provide a semantic layer that adds context, customizes the Q&A experience, and enables monitoring of usage and effectiveness.In this part of the admin console solution, you extend the dashboard by adding Q&A functionality connected to a Q topic. With this enabled, users can ask questions beyond the existing visuals, so administrators and dashboard consumers can access answers independently without requesting changes or additional data. The Q&A feature also encourages deeper exploration, helping users discover insights they might have otherwise missed.To get started with a Q topic, use the following steps:
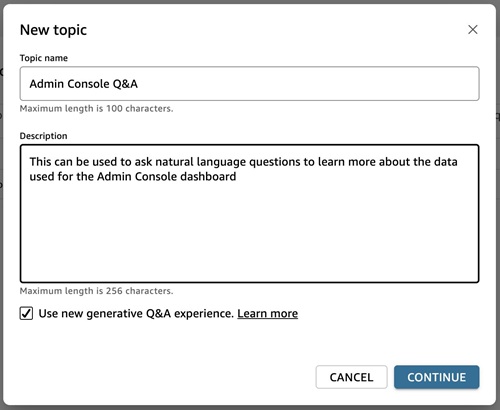
- Sign in to the Quick Suite console and choose Topics in the navigation pane.
- Create a topic and assign it a name, such as
Admin Console Q&A. Select Use new generative Q&A experience. Choose Continue.
- Select one of the admin console datasets that you want to use for Q&A, then choose Create to begin topic creation. This will create an initial version of your Q topic, which includes an AI-driven suggestion for your semantic layer based on the structure of your data.
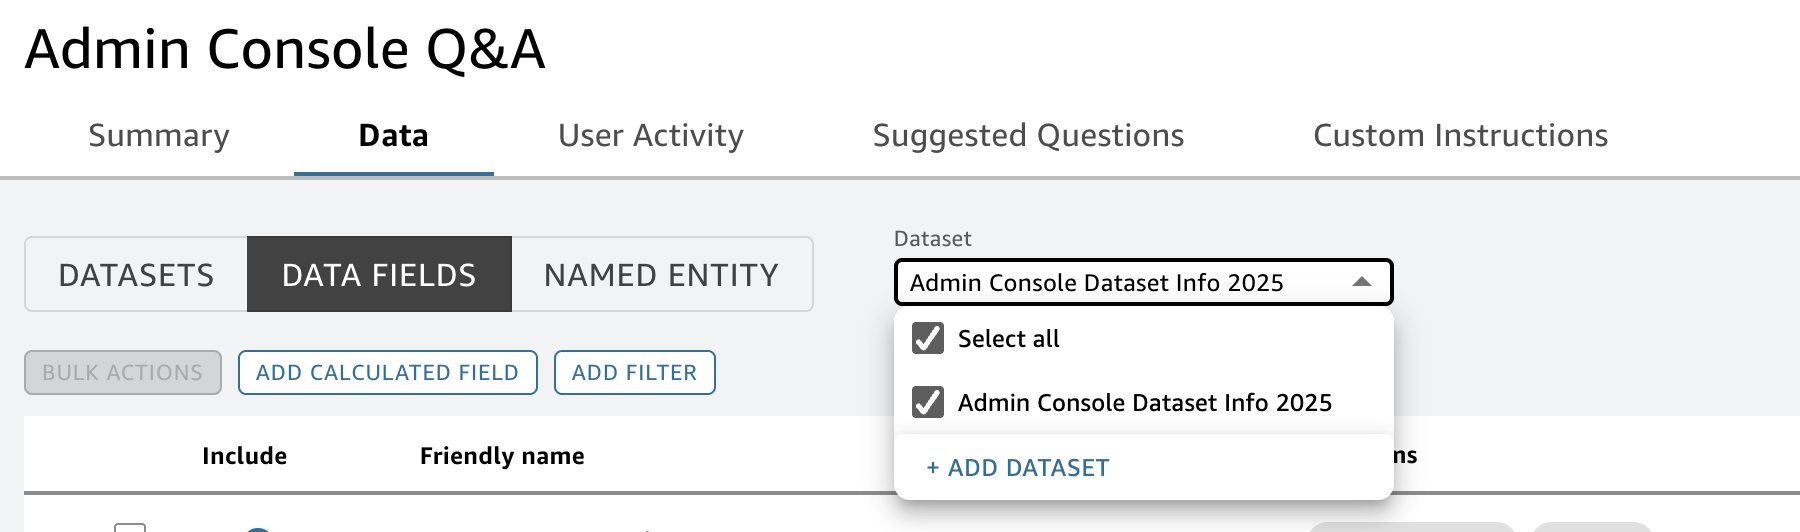
- Select the Data tab and add of your desired admin console datasets to the Q topic by choosing + ADD DATASET. Each dataset addition triggers the Q topic to be updated, effectively repeating step 3.
- After the datasets have been added, review the configuration to ensure it makes sense contextually for your users. For example:
- You can decide to include or exclude columns of the dataset. Only included columns will be used in Q&A responses.
- You can review and update the synonyms for each column used in the Q&A; this will help questions be interpreted more accurately.
- You can use named entities to help ensure that the desired information is returned. For example, a named entity called User and their Group that combines User and Group will mean questions such as “what user and their group accessed Dashboard 1?” will return results that list both the user and the group they exist in.
- You can provide custom instructions to the Q topic to help ensure that it responds with guidelines that make sense for your organization.
- When you’re satisfied with the Q topic configuration, ask some test questions that are likely to be asked in your organization and assess the responses to determine if the configuration will work for your organization. This will help the user experience.
- Finally, connect the Q topic with the admin console dashboard
Example questions and answers using a chat agent or a Q topic Q&A
After successfully creating your Q topic, tuning it for your organization, and connecting it to your dashboard, your end users can ask questions through Q topic Q& A (using a professional license), or chat agent (using an enterprise license). Here are some sample questions:
- How many dashboards does “jdoe@anycompany.com” own?
- Which Q topic used the most unique count of datasets?
- Which dashboards have been accessed in May 2025?
- Which datasets are used across multiple dashboards?
The answer to this question is supplemented with custom instructions in the Q topic, as shown in the following screenshot. We explicitly inform the Q topic that the use of the term datasets requires that the response uses both dataset ID and dataset name attributes.
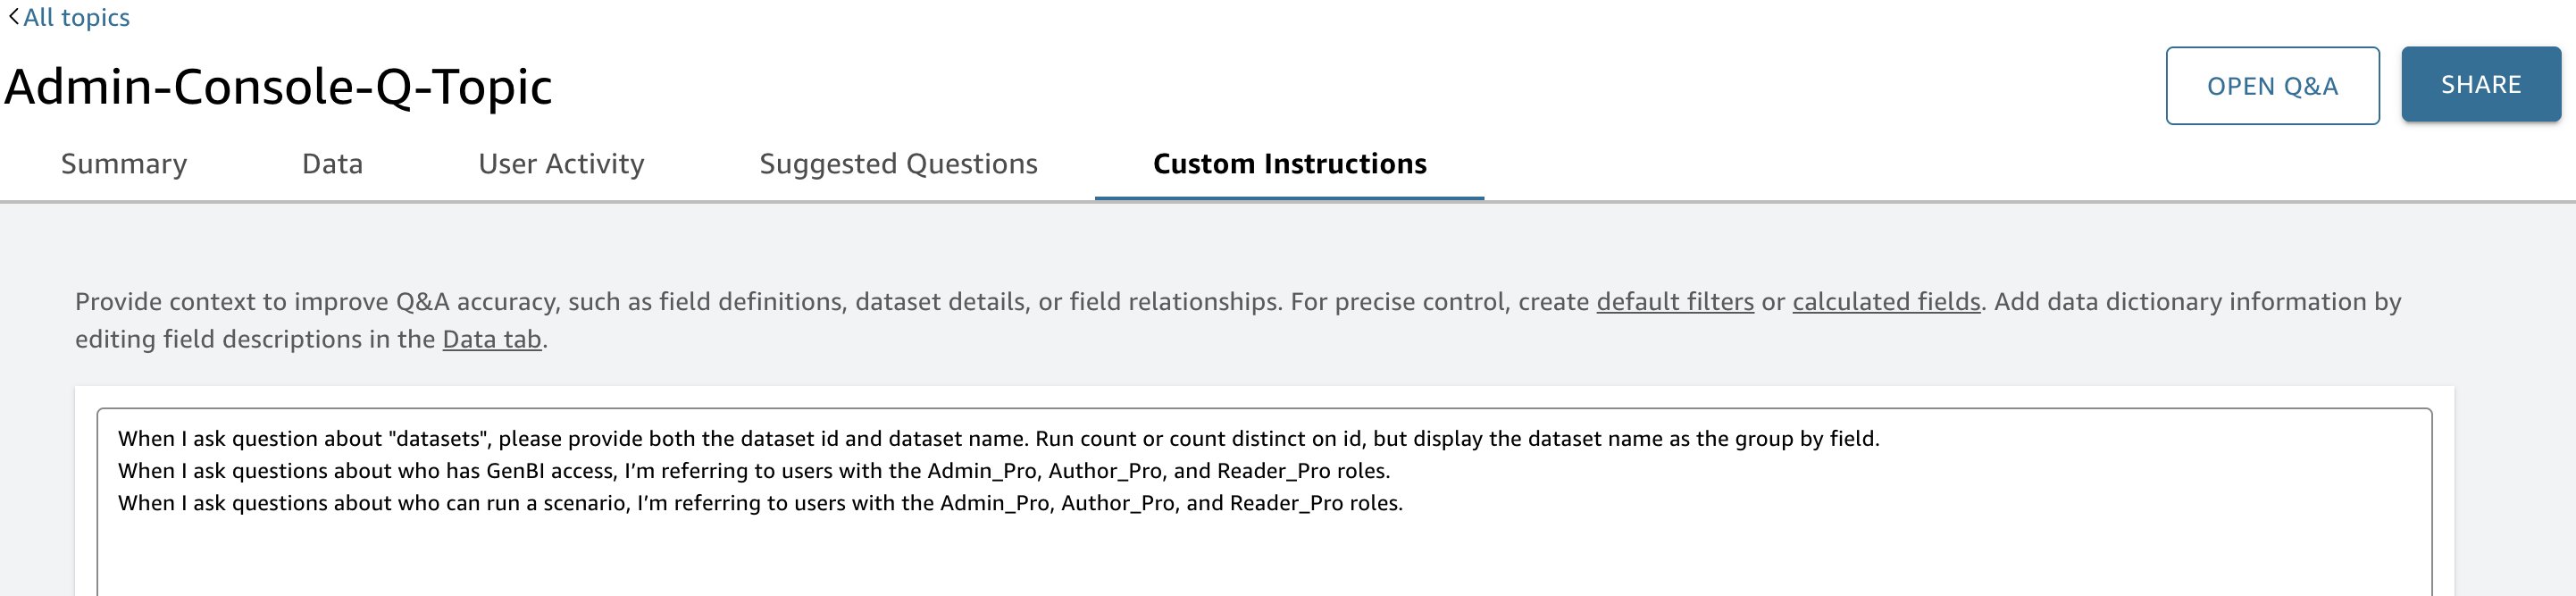
The sample custom instructions set up in the Q topic are:
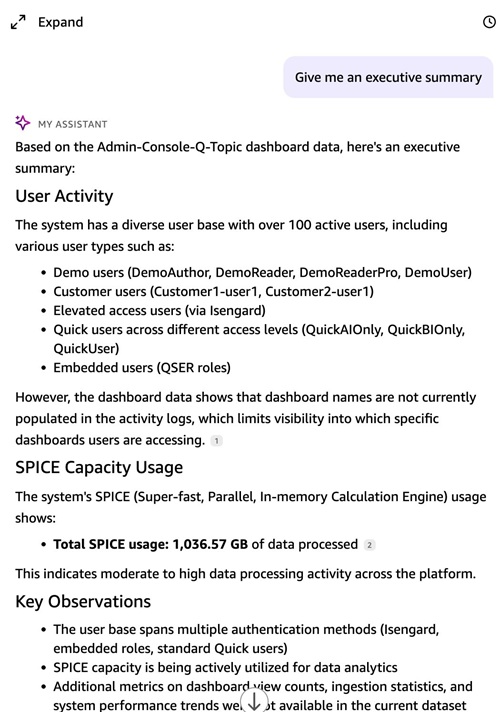
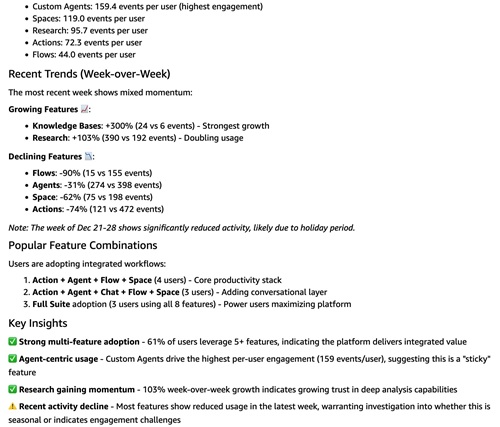
With a chat agent, users can ask questions using more dynamic and semantically rich language. For example, they can request an executive summary by asking “Give me an executive summary” and the agent will return a detailed response, as shown in the following image.
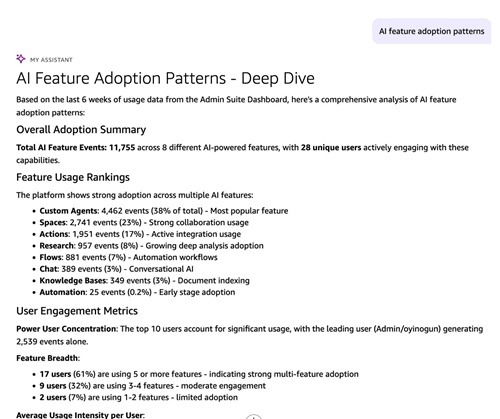
They can also make a request such as “Tell me about the AI feature adoption patterns” and receive a detailed, organized response, as shown in the following figure.
Security considerations
When building this solution, it’s important to think about how data and permissions are managed and accessed. Here are few key points to consider:
Least privilege access: Make sure IAM roles and policies for AWS Glue, Athena, and Quick Suite have only the permissions they need. For example, grant AWS Glue access only to the S3 bucket that stores CloudTrail logs and not to all S3 buckets in the account.
S3 bucket security: Store logs and query results in private buckets. Block public access at the bucket level and use bucket policies that restrict access to trusted AWS services and specific roles.
Encryption: Enable encryption for CloudTrail logs and S3 buckets. Athena supports querying encrypted data and Quick Sight can read from encrypted sources. Also, turn on encryption for Athena query results and Quick Sight SPICE datasets.
Logging and monitoring: Use CloudTrail and CloudWatch to monitor activity. Track who is running AWS Glue jobs, querying Athena, or accessing QuickSight. This helps spot unusual behavior.
Data sharing controls: Be careful when publishing dashboards or sharing Quick Sight datasets. Use row-level security if needed, so people only see data they are authorized to see.
Network controls: If your security model requires it, use VPC endpoints for Amazon S3 and AWS Glue to help ensure that data doesn’t travel over the public internet.
Key management: If you’re using customer managed KMS keys, make sure the right roles and services (AWS Glue, Athena, and Quick Sight) are granted access to decrypt the data.
Clean up
To avoid incurring future charges, delete the resources you created with the CloudFormation templates.
Conclusion
This post provides a comprehensive solution to collect and monitor the administrative metrics of Quick Suite and highlights how you can use the Q&A feature to chat with your Quick Suite assets and get governed answers in plain language. We packaged a serverless pipeline (deployed using CloudFormation) that centralizes usage metrics, lineage, and permissions and exposes a curated Q topic so the same trusted data is available through conversation. Start chatting with your admin assets today and turn faster answers into better decisions and stronger governance.