AWS Compute Blog
Customize Amazon API Gateway destinations for execution logs
Amazon API Gateway execution logs help you trace request processing step by step through your REST API stages. They capture authorization results, integration latency, mapping template output, and error details that are otherwise invisible at the API surface. When a production request fails in a way the access log cannot explain, the execution log is usually where you find the explanation.
Until now, execution logs had two constraints. Every log event was truncated at 1 KB, so a request carrying a moderately sized JSON body would exceed that limit and the remainder was dropped. Logs could only go to the auto-managed log group that API Gateway creates for you (API-Gateway-Execution-Logs_{rest-api-id}/{stage_name}).
With Amazon CloudWatch Logs delivery for REST API execution logs, you can now route execution logs to Amazon CloudWatch Logs, Amazon Simple Storage Service (Amazon S3), or Amazon Data Firehose. Log events can be up to 1 MB per entry, and you benefit from vended logs pricing.
In this post, you learn how CloudWatch Logs delivery works with API Gateway execution logs, how to configure it, and what patterns work best for common observability scenarios.
Understanding API Gateway execution logs
API Gateway produces two categories of logs: access logs and execution logs. Access logs record a summary line per request, similar to an HTTP server access log. You configure the format and destination yourself.
Execution logs are different. They capture the internal processing of each request as it moves through the API Gateway pipeline: authorizer evaluation, request validation, integration dispatch, response mapping, and error handling. These logs exist so you can answer questions such as “why did my authorizer reject this token?” or “what did the mapping template produce before it reached my backend integration?”
API Gateway manages execution log creation automatically. When you set loggingLevel to INFO or ERROR in your stage’s method settings, the service writes execution log events to a CloudWatch Logs log group it manages on your behalf. You do not choose the log group name or configure retention directly on it.
The auto-managed model works for many customers but may create friction for teams with specific observability requirements. Compliance frameworks that require logs in S3 with a particular prefix structure need an extra subscription filter and delivery mechanism. Sending execution logs into a security information and event management (SIEM) tool through a Firehose stream requires a forwarding layer.
Configurable log delivery with CloudWatch Logs
CloudWatch Logs delivery separates log routing from log content. Two concepts control the behavior:
DeliverySource is scoped to your API Gateway stage ARN. It defines where logs go. You create a delivery source, then attach one or more delivery destinations (CloudWatch Logs log group, S3 bucket, or Firehose stream).
MethodSettings controls what gets logged. The loggingLevel setting (INFO, ERROR, or OFF) and dataTraceEnabled flag still determine which log events API Gateway produces. These settings work the same way regardless of whether you use the auto-managed log group or CloudWatch Logs delivery.
When you create a delivery using the CloudWatch Logs APIs, CloudWatch Logs activates your log delivery on your API Gateway stage. When you delete the delivery, CloudWatch Logs disables it accordingly. You do not need to flip any flags on the API Gateway side, and the execution logs automatically resume flowing to the auto-managed log group.
Your existing method settings keep their meaning. The loggingLevel and dataTraceEnabled values continue to control log content. If loggingLevel is already INFO or ERROR, creating a delivery redirects those logs to your chosen destination with no further configuration.
The following diagram shows how the pieces fit together.
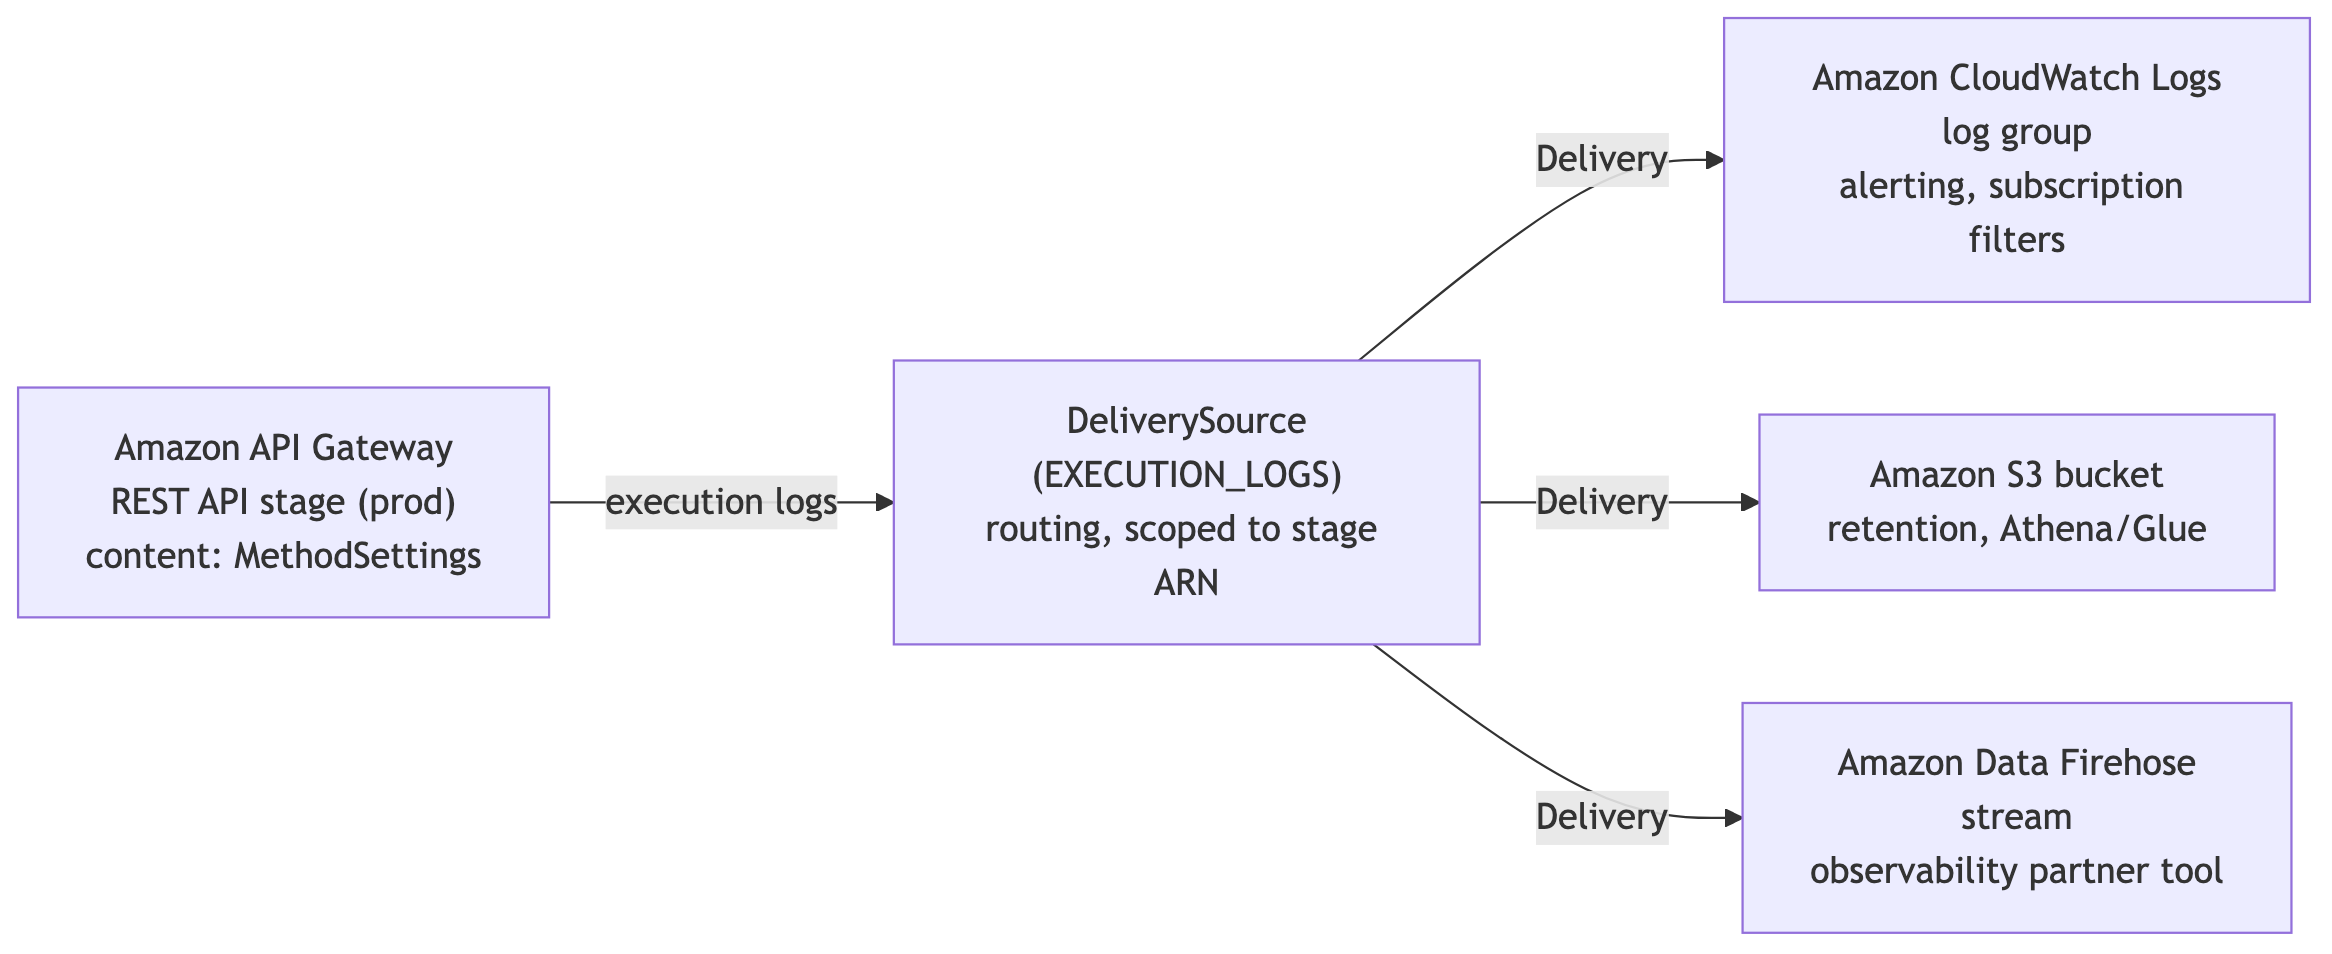
Figure 1 — A single delivery source scoped to an API Gateway stage feeds one or more deliveries, each of which writes to a delivery destination backed by CloudWatch Logs, Amazon S3, or Amazon Data Firehose
The following table summarizes what changes when log delivery is active.
| Aspect | Standard execution logging | Log delivery |
| Destination | Auto-managed CloudWatch Logs log group | CloudWatch Logs, Amazon S3, or Firehose |
| Multi-destination | No | Yes |
| Pricing | Standard CloudWatch Logs ingestion | Vended logs pricing |
| Log event size | Truncated at 1 KB | Up to 1 MB |
| Setup | Set loggingLevel in MethodSettings |
Create delivery through CloudWatch Logs APIs |
| Teardown | Set loggingLevel to OFF |
Delete delivery |
What stays the same
Only execution log routing changes. Access logs continue to flow through accessLogSettings to whatever log group you configure, and unrelated stage features such as AWS X-Ray tracing, detailed CloudWatch metrics, throttling, and caching behave exactly as they did before.
Configuration and integration options
Before you create a delivery, confirm the following requirements:
- The API Gateway REST API is deployed to a stage.
loggingLevelis set toINFOorERRORin MethodSettings.- The account-level CloudWatch Logs IAM role is configured. For setup steps, see Set up CloudWatch logging for REST APIs in API Gateway.
- For cross-account delivery, the destination has an appropriate resource policy attached through
PutDeliveryDestinationPolicy.
Sending logs to a custom CloudWatch Logs log group
The most common starting point is redirecting execution logs to a log group you own. You get direct control over retention policies, metric filters, and subscription filters. The following steps use the AWS Command Line Interface (AWS CLI) with the fictitious REST API ID abc123, stage prod, Region us-east-1, and account 111122223333.
- Create a delivery source referencing your stage ARN. The log type for REST API execution logs is
EXECUTION_LOGS: - Create a delivery destination pointing to your custom (existing) log group, then create the delivery that connects them:
- Verify that the delivery is active by listing deliveries for the source:
The response includes the delivery ID, source, and destination ARN after delivery is established. Execution logs flow to /my-api/execution-logs instead of the auto-managed group.
Note: Log delivery adds structured fields (resource_arn, event_timestamp, api_id, stage, resource_path, http_method, and payload) to each event, so a new delivery emits more than your previous logs. To keep the traditional execution log format with nothing extra, set output format and record fields while creating delivery destination and creating delivery:
Routing logs to Amazon S3
S3 works well for long-term retention at lower cost, or for feeding logs into analytics tools such as Amazon Athena. The bucket must be in the same region as your API. Create a delivery destination pointing to your bucket:
Then create a delivery using the same source name. CloudWatch Logs delivers the events to your bucket, where you can query them with Athena or catalog them with AWS Glue.
Streaming to Amazon Data Firehose
For real-time analytics pipelines or third-party SIEM integration, Firehose delivery sends execution log events directly to your stream. The setup is identical: create a delivery destination with your Firehose stream ARN, then create a delivery. With direct Firehose delivery, you no longer need to maintain CloudWatch Logs subscription filters and AWS Lambda forwarders to route execution logs to external analytics systems.
Multi-destination delivery and per-destination shaping
A single delivery source supports multiple destinations. You can route the same execution logs to CloudWatch Logs for real-time alerting, S3 for long-term compliance retention, and Firehose for your SIEM, all from one stage. Create additional deliveries using the same delivery source with different destination ARNs.
Each destination receives identical log events. To shape what reaches each destination, apply a CloudWatch Logs subscription filter on the CloudWatch Logs destination. For example, you can forward only ERROR-level events to a Lambda function that pushes alerts to a SIEM, while the same delivery source writes the full event stream to S3 for compliance.
Management console experience
You can also add a log delivery destination in the management console after you enable logging for the stage.
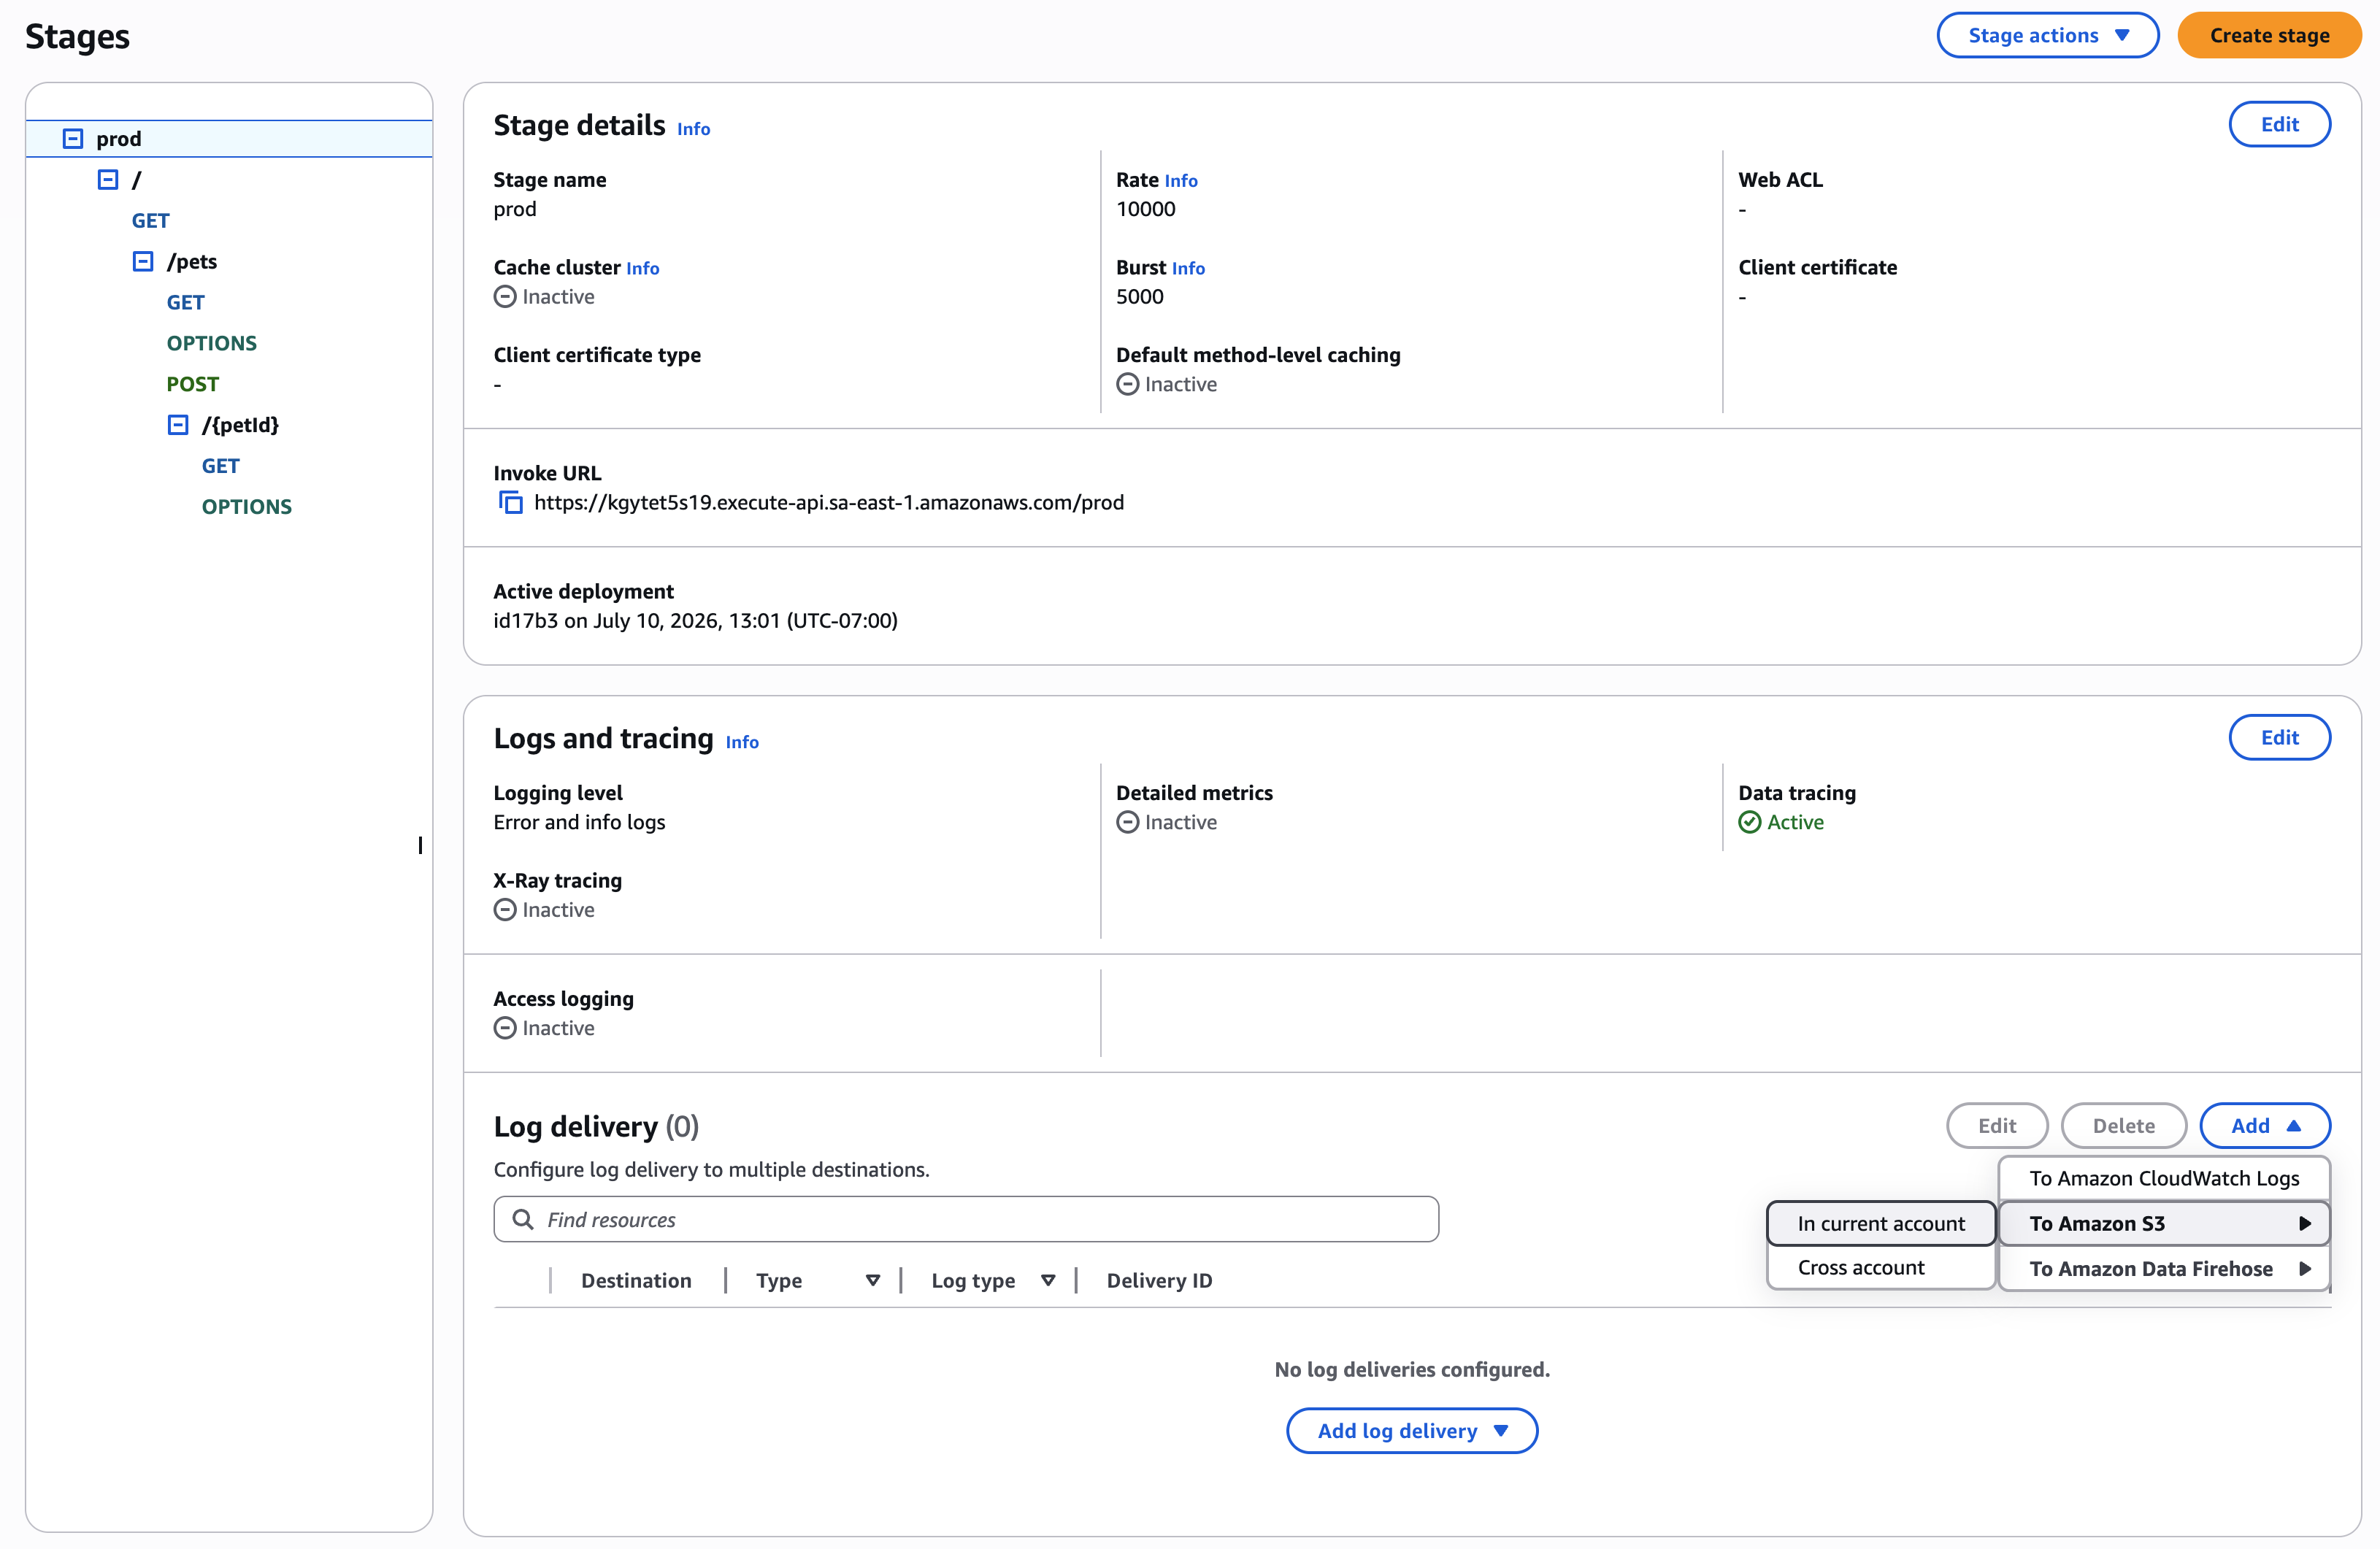
You can specify multiple destinations, both in the current or in a different account:
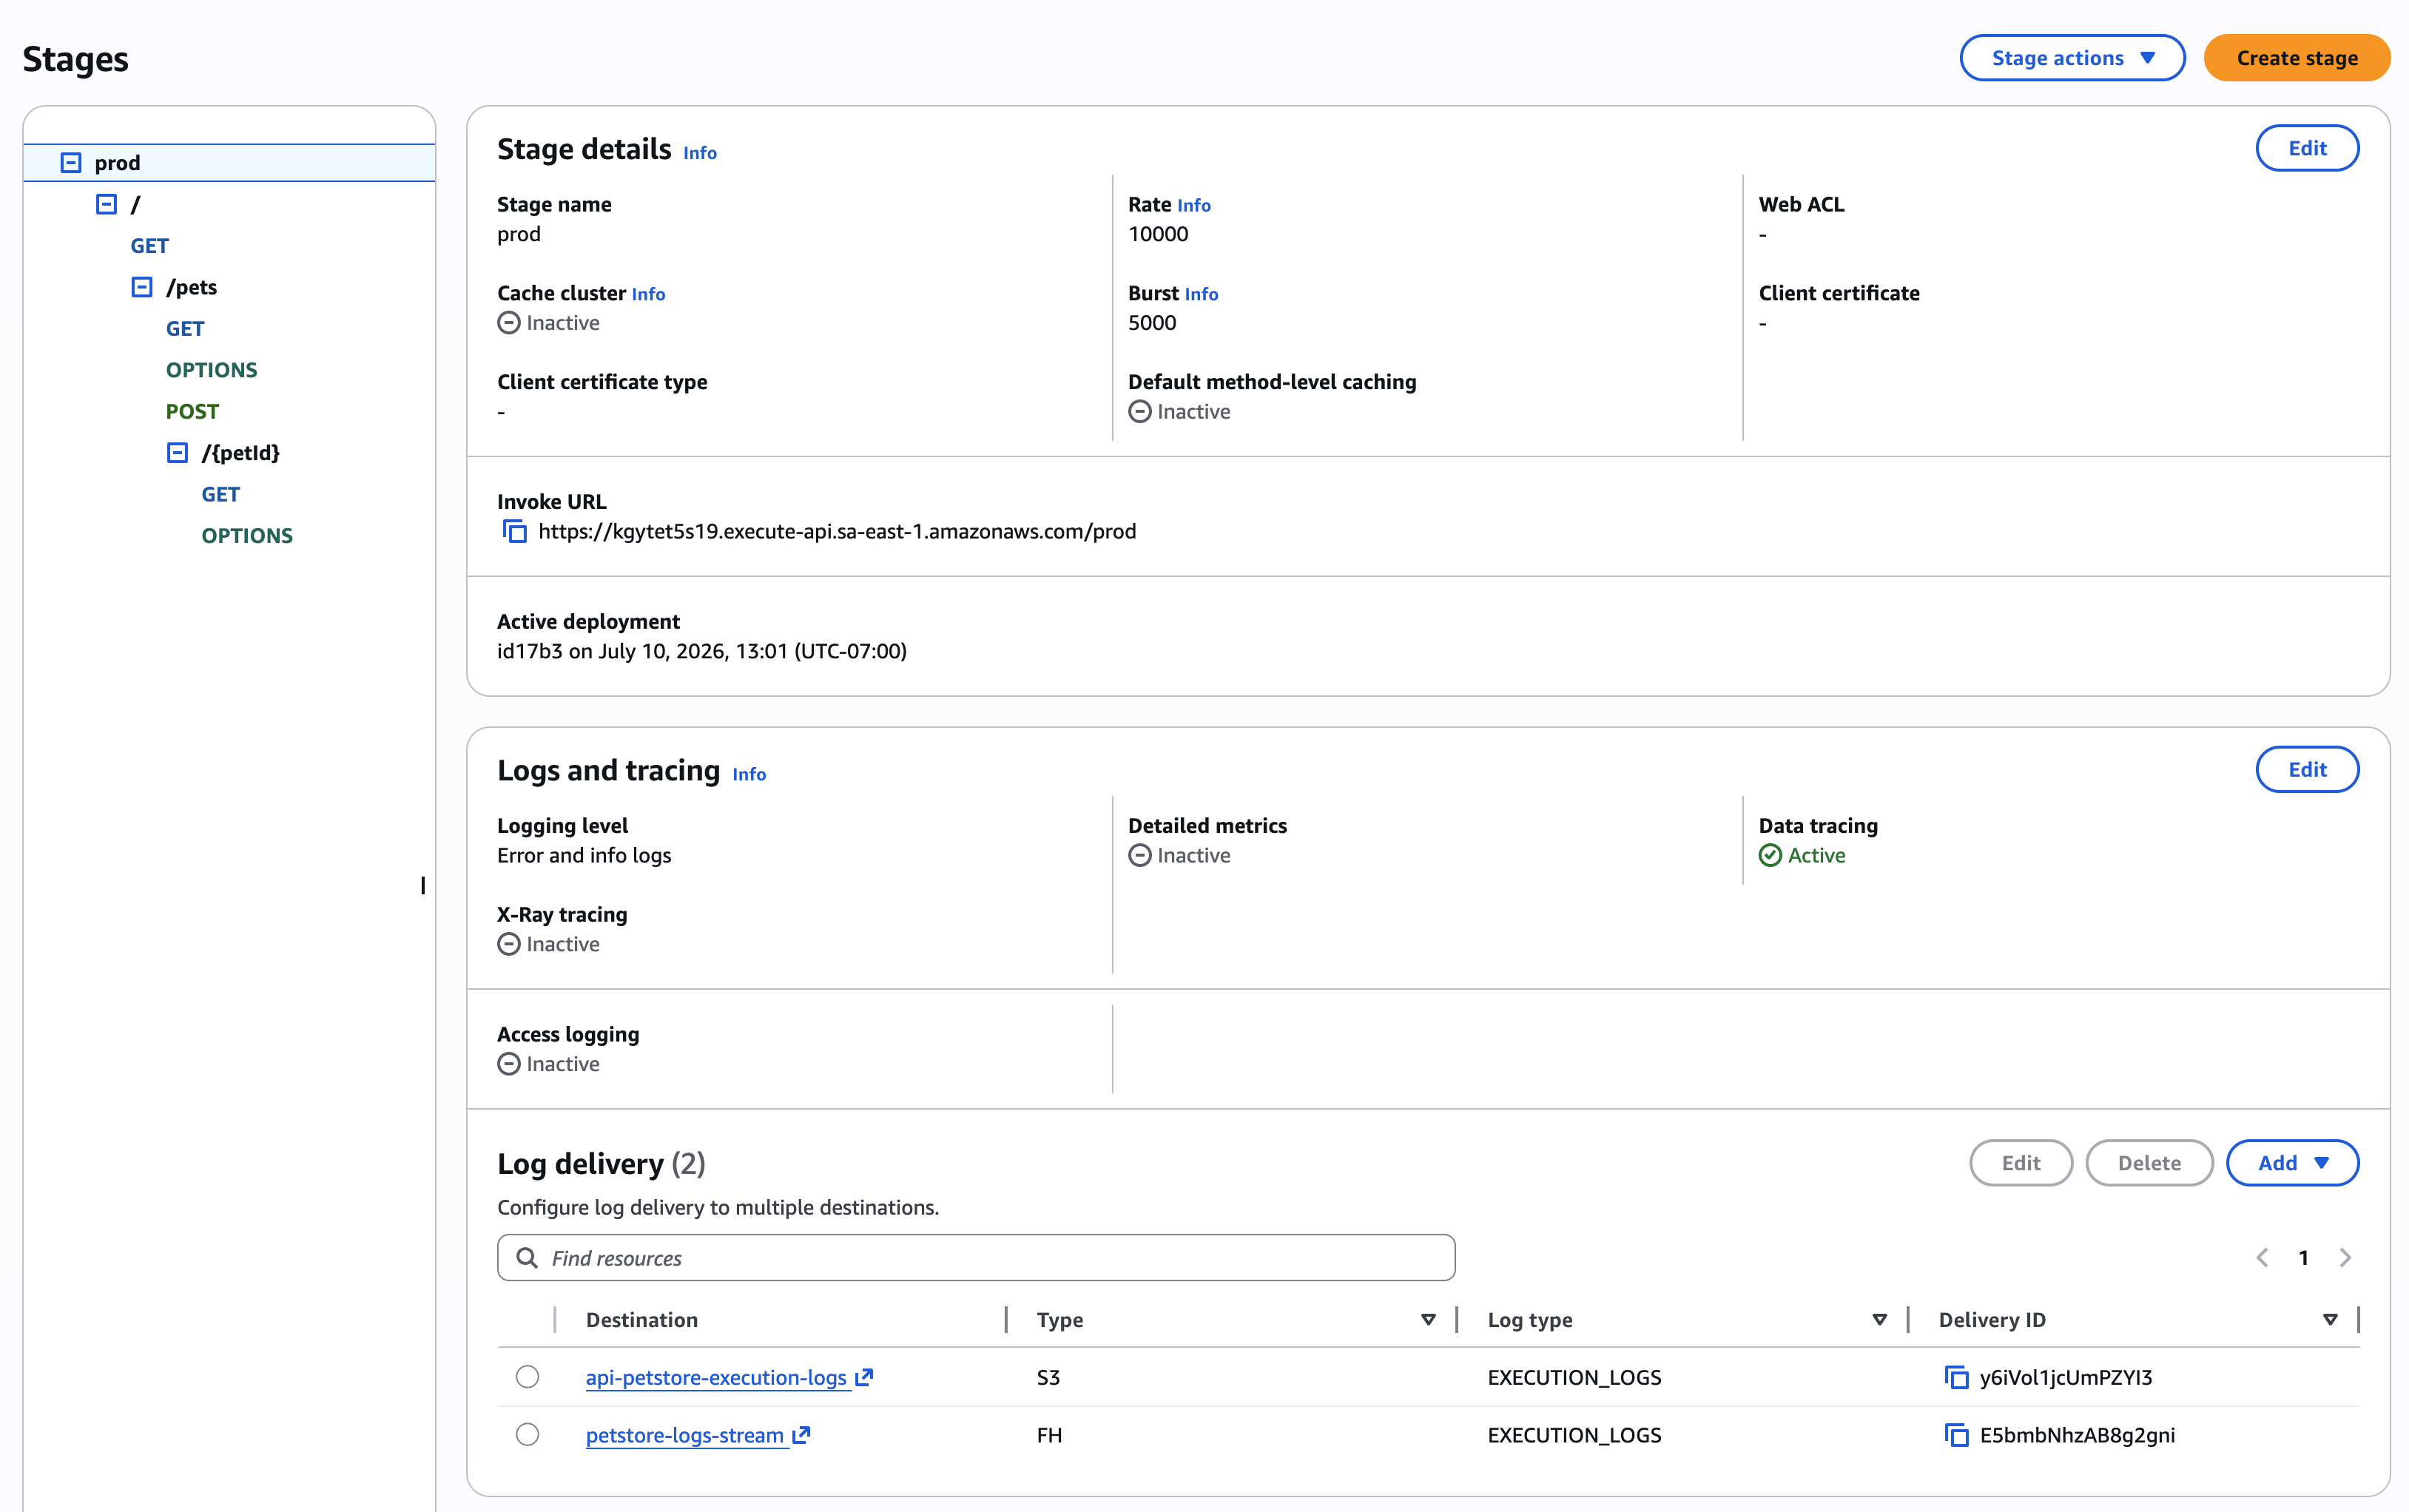
Keeping existing monitoring intact
If you have dashboards or alarms on the auto-managed log group, use that same log group as one of your delivery destinations. Your existing monitoring keeps working, and you gain the ability to send logs to additional destinations such as S3 or Firehose in parallel.
Best practices
Update dashboards and alarms before enabling log delivery. When you activate log delivery, the auto-managed log group stops receiving logs. Any CloudWatch alarms, dashboards, or Contributor Insights rules pointing to API-Gateway-Execution-Logs_{rest-api-id}/{stage_name} stop working. Migrate these references to your new log group before creating the delivery.
Keep loggingLevel at INFO or ERROR. Log delivery controls routing, not content. If loggingLevel is OFF, no execution log events are produced regardless of whether a delivery exists. Verify your method settings before troubleshooting missing logs.
Treat the 1 MB log event capacity as a security decision, not only a debugging convenience. With dataTraceEnabled set to true, execution logs include complete request and response payloads up to 1 MB. Those payloads might contain personally identifiable information (PII) or other sensitive data. Confirm your log destinations have appropriate access controls, encryption, and retention policies. Mask or filter sensitive fields in mapping templates upstream of logging and enable data tracing selectively per method or only in non-production stages.
Start with a single destination, then expand. Validate that your log group or bucket receives events correctly before adding Firehose or additional destinations.
Log delivery is best-effort. In rare cases, some log events might not be delivered. For audit-critical workloads, build retention and reconciliation that account for occasional missing events rather than treating execution logs as the system of record.
Cleaning up
To avoid ongoing charges from the resources you created while following this post, delete the delivery and then remove the destinations and any example S3 bucket or Data Firehose delivery stream you no longer need. Deleting the delivery returns the stage to standard auto-managed logging.
When the delivery is deleted, CloudWatch Logs disables log delivery on the API Gateway stage automatically. The delivery source and delivery destination remain as independent objects. Delete them with delete-delivery-source and delete-delivery-destination if you do not plan to reuse them.
Conclusion
CloudWatch Logs delivery for API Gateway REST API execution logs helps address the 1 KB event truncation and single managed destination constraints. You can now route full execution logs to CloudWatch Logs, Amazon S3, or Amazon Data Firehose, use multiple destinations from a single stage, and pay vended logs pricing.
The feature works alongside existing method settings. No changes to your current logging configuration are required beyond creating the delivery itself.
To get started, refer to Route execution logs with Amazon CloudWatch Logs delivery in the API Gateway documentation. For more about CloudWatch Logs delivery configuration, see Enable logging from AWS services. For pricing details, review the Amazon CloudWatch pricing page. Try it on a test stage and share your experience in the comments.