AWS Compute Blog
Designing for failure: Building resilient systems on AWS
In cloud computing, failure in distributed systems isn’t a matter of if, but when. Modern applications span servers, Availability Zones, and Regions. Each component represents a potential point of failure. Resilient applications engineer fault tolerance into their architecture, building systems that self-recover and maintain availability. This post is written for engineers and architects who run distributed data systems such as Apache Cassandra, Apache Kafka, or HDFS on Amazon Elastic Compute Cloud (Amazon EC2) and want to build resilience against hardware failure.
We were working with a customer during one such incident and wanted to share the example. The customer runs a web application that uses Cassandra as its data store, handling both read-heavy and write-heavy workloads at a scale of millions of queries per day.
The 2 AM wake-up call nobody wants
Consider a platform that monitors millions of enterprise network devices across hospitals, universities, and airports worldwide. It detects problems before IT teams even notice them. For that platform, a 2 AM page is more than inconvenient. When your value proposition is catching failures before anyone else does, being caught off-guard by your own infrastructure failure is existential.
The engineering team was deep in quarterly planning when their monitoring dashboard lit up. Three Cassandra nodes had gone dark simultaneously. This was not a graceful shutdown or a rolling restart. It was a hard failure with no warning.
Their architecture is typical of high-scale telemetry platforms. Kafka-powered microservices ingest device telemetry, Apache Flink handles real-time anomaly detection, and Apache Airflow orchestrates batch analytics and firmware updates. All of these rely on Apache Cassandra as the distributed database backbone. The database stores billions of daily writes and handles millions of queries per day.
What actually happened
Three i4i.4xlarge instances running Cassandra nodes failed simultaneously in the SFO region. Investigation revealed that all three instances were colocated on the same physical host. That host suffered a hardware failure, taking all three instances offline at once.
Engineers spent ninety minutes digging through system logs trying to determine the root cause. The root cause was architectural. The deployment lacked Partition Placement Groups, creating a single point of failure where logical replication was undermined by physical collocation.
The good news: Cassandra maintained service availability with no data loss thanks to its replication factor. The bad news: for over an hour, the system ran on a thin safety margin. One more node failure in the same replication group would have caused data unavailability for a subset of queries. That is real customer impact for a platform that promises always-on monitoring.
This is the insidious nature of correlated failures. Individual node failures are expected and designed for. That is the whole point of replication. But when your replicas share physical infrastructure, replication becomes a paper guarantee. You have three copies of the data, but they all live on the same machine.
Making matters worse, their monitoring tools completely missed the initial failure. System status checks correctly flagged the host-level problem. But without Amazon CloudWatch alarms configured to act on those checks, detection was entirely reactive. The team found out because other things started behaving oddly, not because an alarm told them three nodes were down.
Hardware fails. You can’t fix it with a patch or configuration change. The real questions are how fast you detect it, how well your system handles it, and whether failures are correlated.
How the team responded and what they changed
The operations team manually replaced two failed instances with new ones on healthy hardware and restarted the third for log collection. Once replacement instances came online, new Cassandra nodes automatically rejoined their clusters and streamed data from surviving replicas. This process took several hours depending on data volume. Only after full synchronization did the clusters return to full redundancy.
The team recognized that this ninety-minute manual scramble wouldn’t scale. Similar problems had happened before, and each time they followed the same reactive pattern: page, investigate, manually replace, wait for streaming, breathe. Here’s what they implemented to break that cycle, and what you should implement too.
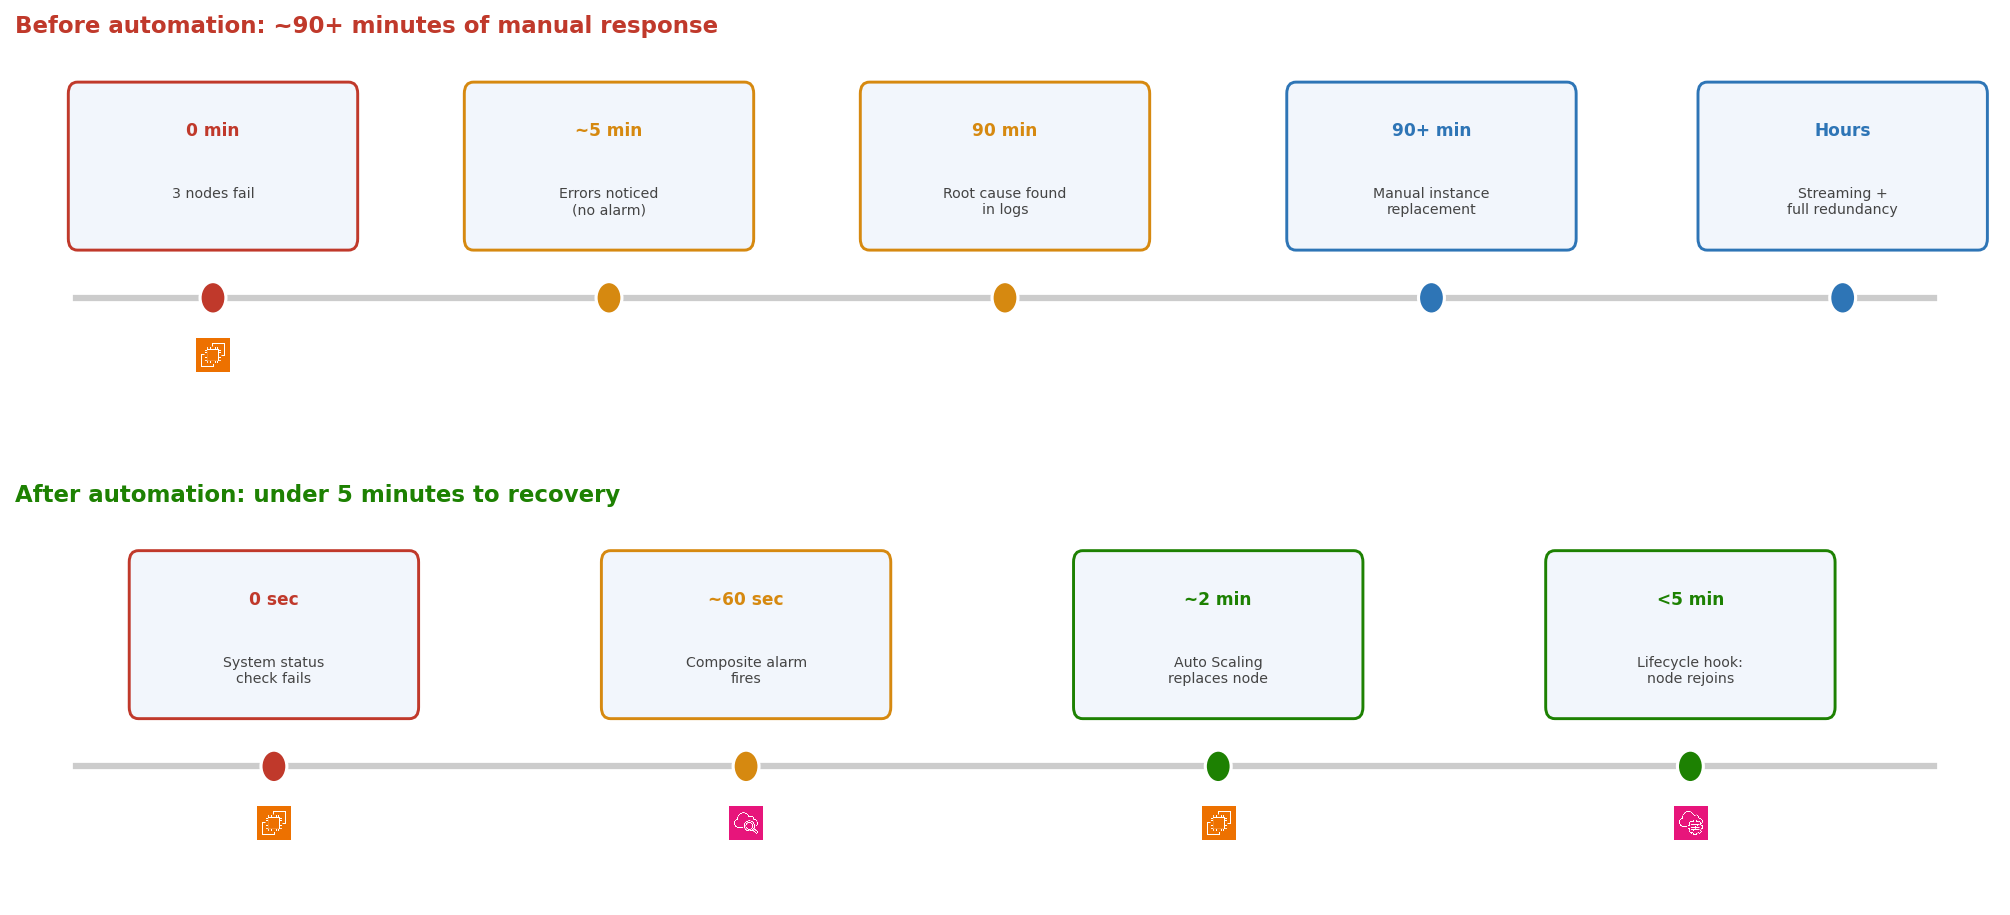
Figure 1: The same failure handled two ways. Manual response took over 90 minutes plus hours of streaming. The automated path completes recovery in under 5 minutes.
1. Use Partition Placement Groups to isolate failure domains
The three crashed servers shared a physical machine because no one told AWS otherwise. Without placement group constraints, instances are placed based on available capacity. That can mean multiple instances land on the same host. For stateless web servers, this rarely matters. For distributed databases whose entire resilience model depends on replicas being independent, it’s a silent architecture bug waiting to become a 2 AM incident.
Partition Placement Groups fix this by distributing instances across separate hardware racks. Each partition maps to a distinct set of physical infrastructure, with separate power and separate network switches. When one rack fails, it affects only the instances in that partition.
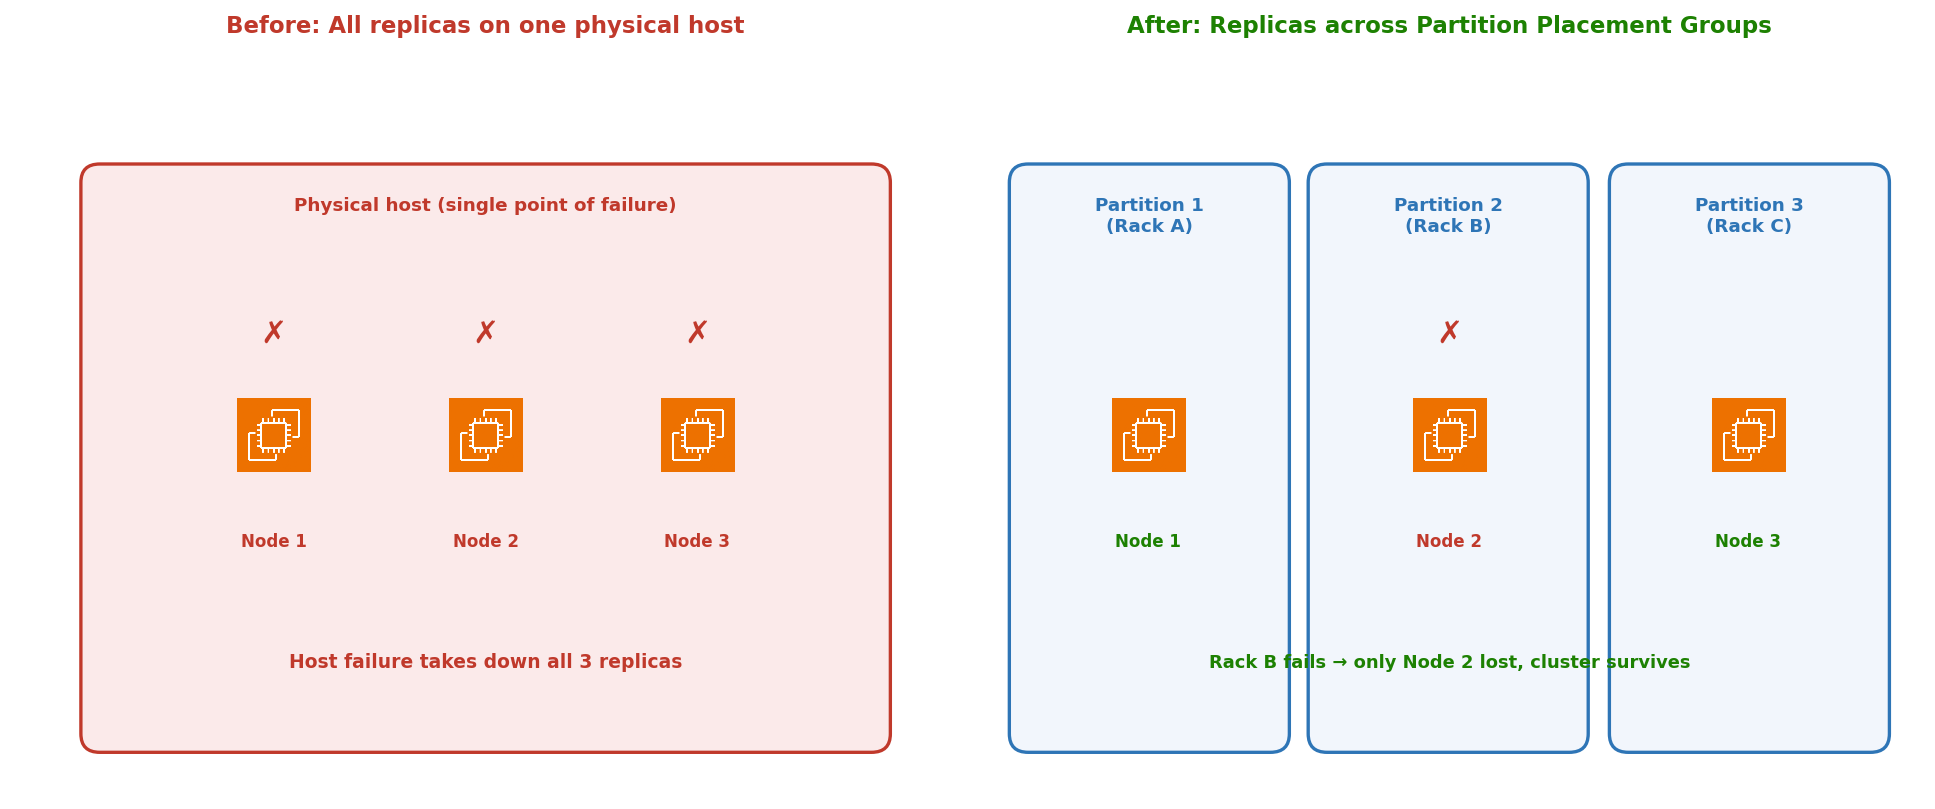
Figure 2: Distributing Cassandra replicas across Partition Placement Group partitions so a single rack failure affects only one node.
You can create up to seven partitions per Availability Zone, with as many instances as needed in each. By mapping Cassandra replicas to separate partitions, a single hardware failure takes down one node instead of three. This applies to any distributed system that maintains replicas, such as Kafka, HDFS, or Cassandra.
Key insight: Align your Partition Placement Group partitions with your application’s replication topology. If Cassandra uses a replication factor of 3, place each replica in a different partition. This means the physical isolation boundary matches the logical replication boundary.
CLI example:
Partition Placement Groups (up to 7 partitions per AZ, unlimited instances per partition) are designed for large distributed workloads. Spread Placement Groups (max 7 instances per AZ, each on a separate rack) suit small critical clusters. For a Cassandra deployment at scale, Partition is the right choice. Learn more in the Amazon EC2 placement groups documentation.
2. Monitor system status checks and use composite alarms
The Cassandra team’s monitoring blind spot came down to a distinction many teams overlook. AWS runs two health checks on every instance: instance status checks (your guest OS and software) and system status checks (the physical hardware underneath). When a system status check fails, the problem is below your control. This includes a host crash, a power failure, or network loss at the rack level. No amount of SSH-ing will help, because the box is unreachable.
The Cassandra team had no Amazon CloudWatch alarms configured on either check type. That meant the only signal was cascading application errors noticed by engineers who happened to be awake. Set these up on day one, before your first production deployment.
To avoid false alarms during normal reboots, where metrics may briefly go missing, combine system status checks with application-level health monitoring using composite alarms. When both fail together, you know there’s a real problem. See the CloudWatch composite alarms documentation for setup details.
3. Automate instance recovery and replacement
The Cassandra team’s ninety-minute recovery wasn’t slow because the engineers were incompetent. It was slow because humans were in the loop. Waking up, assessing, deciding, acting, and verifying: each step adds minutes that compound under pressure. Auto Scaling groups remove the human from the critical path.
Place your Cassandra nodes in an Auto Scaling group. Auto Scaling continuously runs health checks on every instance, and when it marks an instance unhealthy, it terminates it and launches a replacement on different physical hardware, automatically placed within your Partition Placement Group. Under normal conditions, an instance whose system status checks fail is replaced within a few minutes.
The gap to close is detection, not replacement. Rather than waiting for Auto Scaling to reach its own conclusion, have the composite alarm from the previous section explicitly tell Auto Scaling the instance is unhealthy by calling the SetInstanceHealth API. As soon as your combined signal (system status check plus application-level check) confirms a real failure, mark the instance unhealthy and let Auto Scaling replace it immediately. This sidesteps any ambiguity in detection and starts recovery in seconds rather than minutes.
For stateless services, this is enough. For stateful systems like Cassandra, you need an additional step. Lifecycle hooks pause new instances before they join the cluster. A raw Amazon EC2 instance isn’t a functioning Cassandra node. It needs to join the ring, stream data from peers, and verify consistency before serving traffic. Read more in the Amazon EC2 Auto Scaling lifecycle hooks documentation.
In this customer’s case, automating these steps cut recovery time from ninety minutes of manual intervention to under five minutes of automated recovery.
A note on stateful recovery: automated replacement only handles the infrastructure layer. For Cassandra specifically, the new node still needs to stream data from peers before it’s fully operational. The key improvement isn’t eliminating that streaming time. It’s eliminating the human response time before streaming even begins.
4. Build automated incident response with AWS Systems Manager
When servers fail, you face competing priorities. You need to replace them fast to restore capacity, and you need to preserve logs for root cause analysis. These goals conflict when done manually. The Cassandra team restarted one failed node solely to collect diagnostic data before replacing it, adding time to an already long recovery.
AWS Systems Manager runbooks automate this tradeoff away. Build a workflow that runs these steps in sequence:
- Isolate the failed instance by detaching it from the load balancer target group.
- Create an Amazon EBS snapshot and capture available logs to Amazon S3.
- Terminate the instance so that Auto Scaling can replace it.
- Notify the on-call channel with the instance ID, failure type, and Amazon S3 log location.
A subtle but important detail: when the instance’s lifecycle is managed by an Auto Scaling group, let the group replace it. Terminating the instance directly only delays recovery, because the group first has to notice the instance is gone before it launches a replacement. Instead, call the TerminateInstanceInAutoScalingGroup API. This tells EC2 Auto Scaling to terminate the unhealthy instance and immediately launch a replacement in one coordinated action. Trigger this runbook automatically with Amazon EventBridge rules that match Amazon EC2 state-change events. The result is that forensic data is preserved, replacement happens in parallel, and the on-call engineer gets a notification after the system has already healed, rather than a page asking them to start fixing it.
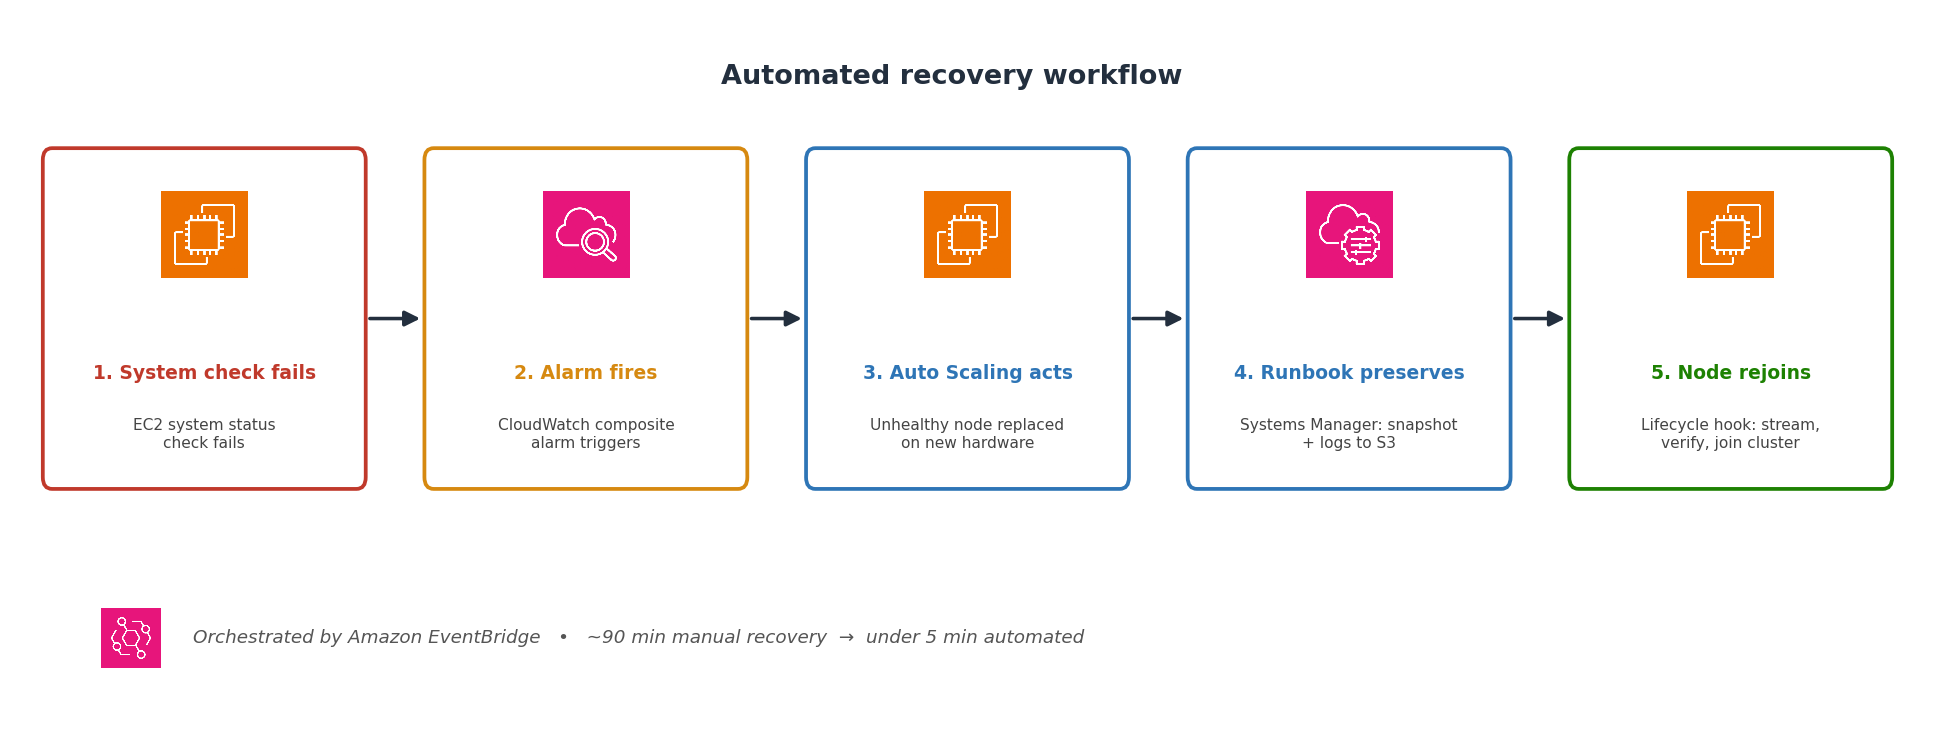
Figure 3: The automated recovery workflow, from hardware failure detection through node rejoin, orchestrated by Amazon EventBridge, Auto Scaling, and AWS Systems Manager.
5. Invest in observability before you need it
After resolving the Cassandra incident, the team asked a harder question: what else is silently failing? They ran a broader health assessment, and the answer was sobering. Unstable Redis connections were dropping under load. Amazon EBS volumes were running with elevated latency. Application Load Balancer health check intervals were misconfigured. Secondary databases were approaching connection pool exhaustion. Any of these could cause the next outage, and none of them had triggered a single alert.
This is the pattern. Teams invest in monitoring for the system that recently broke while the next failure quietly builds elsewhere. The better approach is treating observability as infrastructure. Deploy it everywhere from day one, not bolted on after the post-mortem.
Deploy the CloudWatch agent for system-level and application-level metrics. Use Amazon CloudWatch Synthetics canaries to continuously test critical user paths such as login, data ingestion, and dashboard rendering. Set up distributed tracing with AWS X-Ray to identify latency bottlenecks across your microservice mesh. The goal isn’t only knowing that services are running. It’s continuously confirming they’re working correctly from the customer’s perspective.
The Cassandra team built what they call their “resilience dashboard.” It’s a single view surfacing Partition Placement Group distribution, replica lag, system status check state, and Auto Scaling group health. When the next incident happens, they won’t be scrambling to figure out what’s broken. They’ll open one dashboard and know immediately whether their defenses are holding.
Placement groups: Quick reference
The team’s outage involved Partition Placement Groups, but Amazon EC2 offers three placement group types. Choosing the wrong one is a common mistake, so here’s how they compare:
| Type | Max instances | Isolation level | Best for |
| Partition | Unlimited (up to 7 partitions per AZ) | Separate racks per partition | Large distributed databases (Cassandra, Kafka, HDFS) |
| Spread | 7 per AZ | Each instance on a separate rack | Small critical clusters needing maximum isolation |
| Cluster | Unlimited | Same rack (co-located) | HPC, ML training, low-latency workloads |
If the Cassandra team had used Spread Placement Groups instead, they would have hit the 7-instance-per-AZ ceiling almost immediately at their scale. Partition Placement Groups gave them isolation and room to grow. For the highest-criticality deployments, combine placement groups with multiple Availability Zones. You get separate racks and separate data centers, protecting against both rack-level failures and zone-wide events like power grid outages.
The bigger picture: Resilience is a practice
Building resilient systems isn’t a one-time project. It’s a practice that evolves with your architecture. Start by assessing your workloads with the AWS Well-Architected Tool to identify single points of failure you might not see day-to-day. Define Service Level Objectives, so your team agrees on what “good enough” looks like. Not every service needs 99.99% availability, but you need to know which ones do.
Then layer your defenses. Placement groups prevent correlated hardware failures, composite alarms detect problems within minutes, and automated recovery fixes common issues without waking anyone up.
Test regularly. Run disaster recovery drills quarterly. Don’t rely only on tabletop exercises. Run actual failovers in pre-production environments. Use AWS Fault Injection Service to simulate hardware failures and zone outages in a controlled way. Hold blameless post-mortems after every incident to understand what broke, why it wasn’t caught earlier, and what you’ll change.
After this incident, the team deployed Partition Placement Groups, configured composite alarms, and automated their response process. The next time hardware fails, and it will, it won’t cause the same damage.
Consider adopting Chaos Engineering as a discipline. The principles of Chaos Engineering encourage teams to proactively inject failures into production-like environments to uncover weaknesses before they cause real outages. AWS Fault Injection Service makes it straightforward to run these experiments safely, with guardrails that automatically stop experiments if impact exceeds defined thresholds.
For related guidance, see the AWS Well-Architected Framework Reliability Pillar and the Amazon EC2 Auto Scaling User Guide. A sample Systems Manager runbook and AWS CloudFormation template for the automated recovery workflow described in this post is available in the AWS Samples GitHub repository.
If you’ve implemented similar resilience patterns or have questions about placement groups and automated recovery, share your experience in the comments.
Related posts
- Building for resilience: How Amazon EC2 Spread Placement Groups reduce correlated failures
- Automating Amazon EC2 instance remediation with AWS Systems Manager and Amazon CloudWatch
- Best practices for handling Amazon EC2 Spot Instance interruptions
- AWS Architecture Blog: Resilience
- Introducing the next generation of AWS Resilience Hub for generative AI-based SRE resilience journey
- AWS Management & Tools Blog: AWS Resilience Hub
Key takeaways
| Challenge | Solution |
| Multiple instances on same physical host | Partition Placement Groups |
| No health notification for sudden failures | Amazon CloudWatch alarms on system status checks |
| Missing metrics during host reboots | Composite alarms with application-level health checks |
| Manual, slow incident response | Automated recovery with Auto Scaling and lifecycle hooks |
| Delayed root cause identification | Systematic triage starting at the infrastructure layer |
| Reduced redundancy after failure | Auto Scaling groups for automatic replacement |
| Recurring confidence erosion | Proactive architectural reviews and observability investment |
Amazon EC2 provides tools like placement groups, managed services with built-in high availability, and automation frameworks like AWS Systems Manager. Select the right ones for your workload and test them relentlessly. Failure is inevitable. Your readiness determines the outcome.