AWS Compute Blog
Operating Lambda: Using CloudWatch Logs Insights
In the Operating Lambda series, I cover important topics for developers, architects, and systems administrators who are managing AWS Lambda-based applications. This three-part series discusses monitoring and observability for Lambda-based applications and covers:
- Using Amazon CloudWatch, CloudWatch Logs Insights, and AWS X-Ray to apply monitoring
across services. - How existing monitoring concepts apply to Lambda-based applications.
- Troubleshooting application issues in an example walkthrough.
This post explains how to use CloudWatch Logs Insights in your serverless applications.
Searching across logs with CloudWatch Logs Insights
A single Lambda function can often generate large numbers of log streams, especially if the function scales up. It can be time-consuming to find specific information if you need to search across many log groups. To help with this, the CloudWatch Logs Insights feature provides an interface that can make it easier to search and aggregate data across thousands of individual log files.
With CloudWatch Logs Insights, you can search and analyze log data using a specialized query syntax. It performs queries over multiple log groups and provides powerful filtering using glob and regular expressions pattern matching.
Additionally, you can use Lambda Insights, which adds more metrics, including memory, network, and CPU usage. To use Lambda Insights, you must enable this feature on a Lambda function. From the console, in the Monitoring tools section of the Configuration page, choose Edit. Under CloudWatch Lambda Insights, choose Enhanced monitoring and then choose Save. If you are using the AWS Serverless Application Model (AWS SAM) to deploy applications, you must include a layer in the template to activate the service:
Resources:
  MyFunction:
    Type: AWS::Serverless::Function
    Properties:
      Layers:
        - !Sub "arn:aws:lambda:${AWS::Region}:580247275435:layer:LambdaInsightsExtension:14"
      Policies:
        - CloudWatchLambdaInsightsExecutionRolePolicy
The latest available versions of the Lambda Insights extension are published in the documentation. CloudWatch Logs Insights are useful for monitoring metrics emitted by your custom code and for standard logs emitted from the Lambda service.
Parsing logs and structured logging
Many developers use unstructured logging in their Lambda functions by using commands such as Python’s print function. This creates human-readable output that can be difficult to interpret and analyze programmatically. Values may appear in these logs arbitrarily and the format may change over time.
In the example, a function generates an unstructured log line with an embedded value. Over multiple invocations, this appears as follows in CloudWatch Logs:

You can use the parse command in CloudWatch Logs Insights to extract data from a log field for further processing, by using either a glob or regular expression. In the example, the following query extracts the UploadedBytes value and then uses this to create minimum, maximum and average statistics:
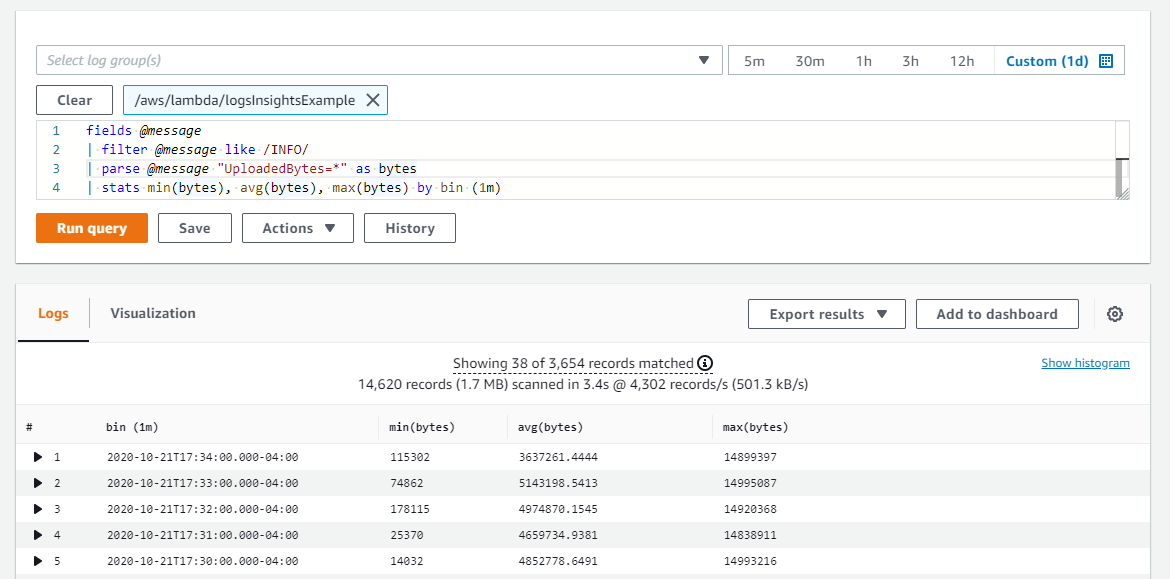
While this approach is useful for handling logs from existing systems that may be difficult to change, it can be time-consuming and awkward to build custom parsing filters for each type of unstructured log file. To apply monitoring to production systems, it’s generally easier to implement structured logging throughout your applications. You can achieve this in Python with libraries like structlog, and most other runtimes have similar structured logging libraries or tools available. You can also use AWS client libraries to generate embedded metric format logs.
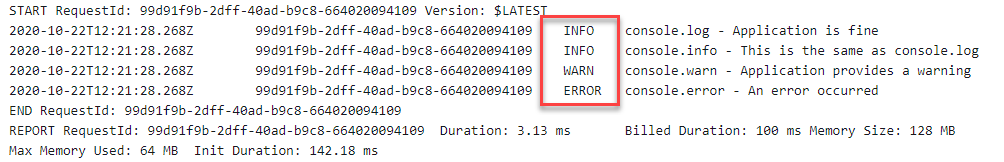
Using log levels is an important first step in generating filter-friendly logs files that separate informational messages from warnings or errors. The next example shows the effect of providing log levels in Node.js with this code:
exports.handler = async (event) => {
    console.log("console.log - Application is fine")
    console.info("console.info - This is the same as console.log")
    console.warn("console.warn - Application provides a warning")
    console.error("console.error - An error occurred")
}
The CloudWatch log file contains a separate field specifying the log level:
A CloudWatch Logs Insights query can then filter on log level, making it simpler to generate queries based only on errors, for example:
fields @timestamp, @message
| filter @message like /ERROR/
| sort @timestamp desc
JSON is commonly used to provide structure for application logs. In the logsInsightsJSON example, the logs have been converted to JSON to output three distinct values. The output now looks like:

The CloudWatch Logs Insights feature automatically discovers values in JSON output and parses the messages as fields, without the need for custom glob or regular expression. By using the JSON-structured logs, the following query finds invocations where the uploaded file was larger than 1 MB, the upload time was more than 1 second, and the invocation was not a cold start:

The discovered fields in JSON are automatically populated on the Fields drawer on the right side. Standard fields emitted by the Lambda service are prefixed with ‘@’ and you can query on these fields in the same way. Lambda logs always include the fields @timestamp, @logStream, @message, @requestId, @duration, @billedDuration, @type, @maxMemoryUsed, @memorySize. If X-Ray is enabled for a function, logs also include @xrayTraceId and @xraySegmentId.
Querying AWS-generated events
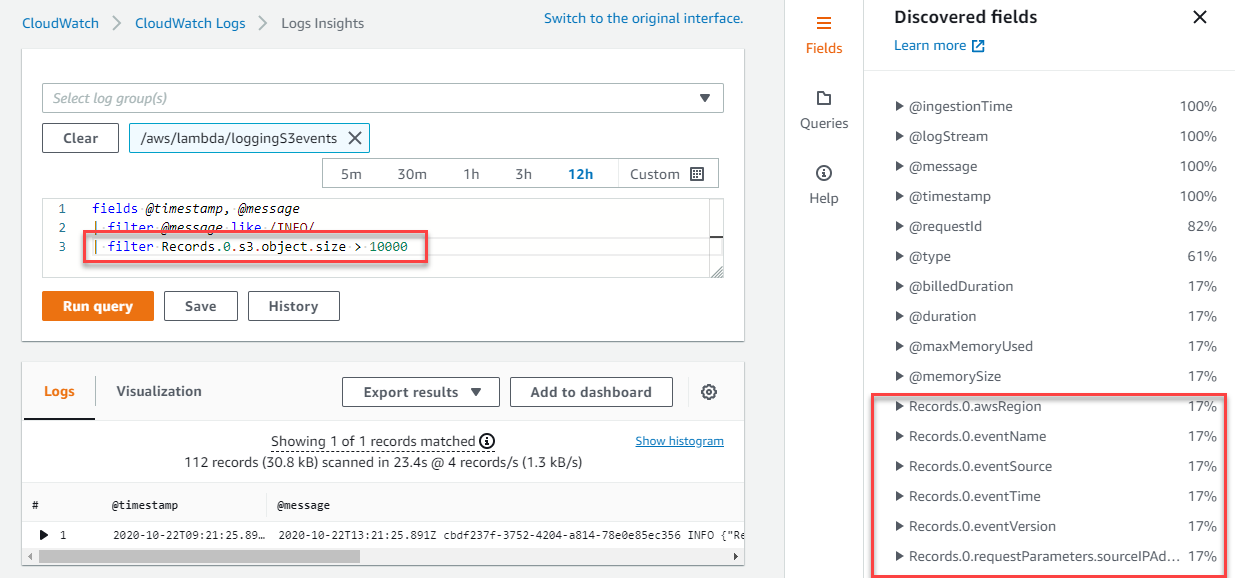
When Lambda is triggered by an AWS event source, such as Amazon S3, Amazon SQS, or Amazon EventBridge, the entire event is provided to the function as a JSON object. By logging out this event in the first line of the function, as shown in the loggingS3events example, you can then query on any of the nested fields using CloudWatch Logs Insights. Nested JSON is flattened using dot notation, enabling you to access any attribute within the JSON structure.
In the preceding example, the Insights feature identifies all of the fields in the JSON structure in the Discovered fields drawer, and the query uses the size field to find records where the uploaded S3 object was larger than 10,000 bytes:
Log visualization and dashboards
In the queries shown so far, you can export the results to markdown or CSV format. You can also create visualizations from queries, providing there is at least one aggregation function. The stats function allows you to define aggregations and grouping. Since Lambda functions always provide a timestamp, you can also produce time series charts, grouped into intervals using the bin function.
The previous logInsightsJSON example filtered on upload size and upload time and excluded first invocations. This resulted in a table of data. For monitoring a production system, it may be more useful to visualize minimum, maximum, and average file sizes to find outliers. To do this, apply the stats function with the required aggregates, and group on a time value such as every minute:
fields @message
| filter @message like /INFO/
| filter uploadedBytes > 1000000
| filter uploadTimeMS > 1000
| filter invocation != 1
| stats min(uploadedBytes), avg(uploadedBytes), max(uploadedBytes) by bin (1m)
After running the query, switch to the Visualization tab to see the results:

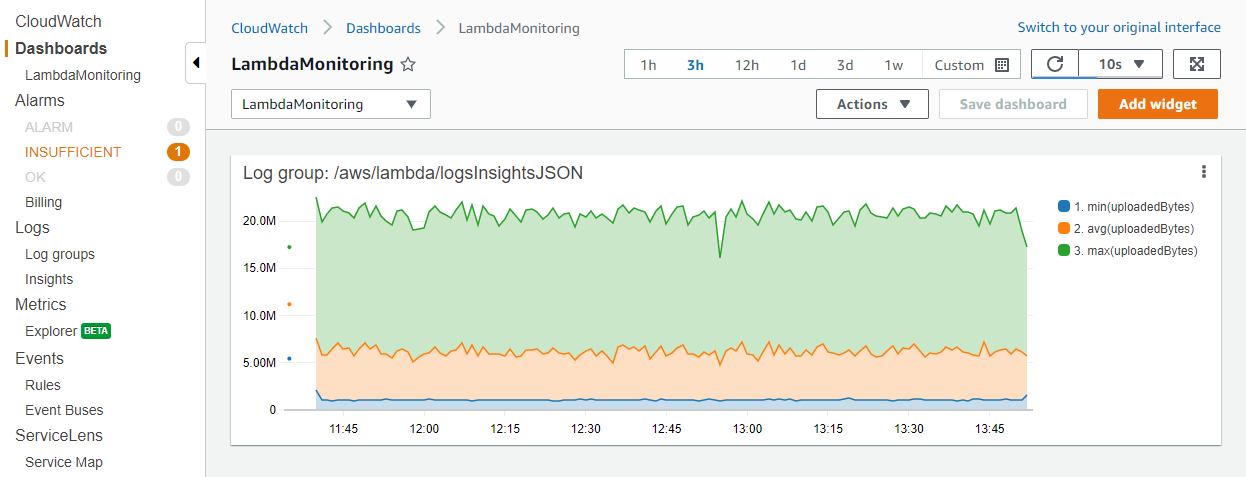
After you have finished building the visualization, you can optionally add the graph to a CloudWatch dashboard. To do this, choose Add to dashboard above the visualization. This adds the query as a widget and enables you to select automatic refresh intervals, making it easier to monitor the results continuously:
Useful CloudWatch Logs Insights queries
The following table shows example CloudWatch Logs Insights queries that can be useful for monitoring Lambda functions.
|
Description |
Example query syntax |
| The last 100 errors | fields Timestamp, LogLevel, Message
| filter LogLevel == "ERR"
| sort @timestamp desc
| limit 100 |
| The top 100 highest billed invocations | filter @type = "REPORT"
| fields @requestId, @billedDuration
| sort by @billedDuration desc
| limit 100 |
| Percentage of cold starts in total invocations | filter @type = "REPORT"
| stats sum(strcontains(@message, "Init Duration"))/count(*) * 100 as coldStartPct, avg(@duration)
by bin(5m) |
| Percentile report of Lambda duration | filter @type = "REPORT"
| stats
avg(@billedDuration) as Average,
percentile(@billedDuration, 99) as NinetyNinth,
percentile(@billedDuration, 95) as NinetyFifth,
percentile(@billedDuration, 90) as Ninetieth
by bin(30m) |
| Percentile report of Lambda memory usage | filter @type="REPORT"
| stats avg(@maxMemoryUsed/1024/1024) as mean_MemoryUsed,
min(@maxMemoryUsed/1024/1024) as min_MemoryUsed,
max(@maxMemoryUsed/1024/1024) as max_MemoryUsed,
percentile(@maxMemoryUsed/1024/1024, 95) as Percentile95 |
| Invocations using 100% of assigned memory | filter @type = "REPORT" and @maxMemoryUsed=@memorySize
| stats
count_distinct(@requestId)
by bin(30m) |
| Average memory used across invocations | avgMemoryUsedPERC,
avg(@billedDuration) as avgDurationMS
by bin(5m) |
| Visualization of memory statistics | filter @type = "REPORT"
| stats
max(@maxMemoryUsed / 1024 / 1024) as maxMemMB,
avg(@maxMemoryUsed / 1024 / 1024) as avgMemMB,
min(@maxMemoryUsed / 1024 / 1024) as minMemMB,
avg(@billedDuration) as avgDurationMS
by bin(30m) |
| Invocations where Lambda exited | filter @message like /Process exited/
| stats count() by bin(30m) |
| Invocations that timed out | filter @message like /Task timed out/
| stats count() by bin(30m) |
| Latency report | filter @type = "REPORT"
| stats avg(@duration), max(@duration), min(@duration)
by bin(5m) |
| Over-provisioned memory | filter @type = "REPORT"
| stats max(@memorySize / 1024 / 1024) as provisonedMemMB,
min(@maxMemoryUsed / 1024 / 1024) as smallestMemReqMB,
avg(@maxMemoryUsed / 1024 / 1024) as avgMemUsedMB,
max(@maxMemoryUsed / 1024 / 1024) as maxMemUsedMB,
provisonedMemMB - maxMemUsedMB as overProvisionedMB |
Conclusion
CloudWatch Logs Insights allows you to search and analyze log data to find the causes of issues and help validate fixes when they are deployed. This post shows how to enable the feature for a Lambda function and search across logs. It explains why structured logging can be helpful for parsing data in analysis.
I show how you can query logs from AWS services and create log visualizations and dashboards to help understand how a serverless application is performing. Finally, this post shows a variety of CloudWatch Logs Insights queries that can be useful for analyzing your Lambda-based applications.
Part 2 explains how monitoring concepts apply to Lambda-based applications, and how to use Amazon CloudWatch metrics.
For more serverless learning resources, visit Serverless Land.