AWS Compute Blog
Operating Lambda: Logging and custom metrics
In the Operating Lambda series, I cover important topics for developers, architects, and systems administrators who are managing AWS Lambda-based applications. This three-part series discusses common monitoring and observability topics for Lambda-based applications
Part 1 covers how to use CloudWatch Logs Insights in your serverless applications. This blog post explains how monitoring concepts apply to Lambda-based applications, and how to use Amazon CloudWatch metrics.
Monitoring concepts in Lambda-based applications
Understanding the state of a Lambda-based workload is important for ensuring the reliability and health of the application. Monitoring can provide the information you need to help your development and operations teams react to issues. It can help you understand a system’s state using a predefined set of metrics. Observability, on the other hand, uses instrumentation to help provide context and insights to aid monitoring. While monitoring can help you discover that there is an issue, observability can help you discover why.
The main concepts that apply to monitoring any distributed system also apply to Lambda-based applications. Observability relies on several key terms:
- Metrics: Numeric data measured at various time intervals (time series data) and service-level indicators (request rate, error rate, duration, CPU, etc.) The Lambda service automatically publishes a number of metrics for Lambda functions and you can create new metrics for your specific use-case. The process of exposing new metrics from your code is called instrumentation.
- Logs: Timestamped records of discrete events that happened within an application or system, such as a failure, an error, or a state transformation. In Lambda, the default logging service is Amazon CloudWatch. You can also use third-party logging systems, if preferred.
- Alerts: Monitoring systems observe metrics in relation to thresholds, and can provide alerts if metrics fall outside expected bounds or become anomalous. This enables operators to receive notifications instead of constantly monitoring the system. For Lambda, CloudWatch alarms are used for this purpose.
- Visualization: Converting metrics to a visual format that enables fast, intuitive interpretation of the performance. These can then be grouped in dashboards.
- Tracing: Following a single request end-to-end throughout a system composed of multiple microservices.
Application monitoring can also help you to detect performance problems, outages, and errors in your workloads. Since Lambda-based applications often combine multiple services, it’s important that you monitor each service endpoint. AWS provides integrated tools to allow you to view the performance, throughput, and errors of event sources for Lambda functions, together with the code in the functions.
Many existing application performance management (APM) concepts still apply in the monitoring and management of serverless applications to maintain an expected level of service. Broadly, there are two sets of performance metrics. First, end user experience metrics, which focus on load-based values such as average response time. The performance profile of applications can change under load and highlight issues that are not found during development. End-to-end response times for an end user action also provide a measurement for application performance.
Second, there are resource management metrics, which can highlight if systems are running close to resource limits. These can help ensure that a workload is making efficient use of the available resources. Unlike traditional server-based applications, instead of measuring if there are adequate compute resources available under peak load, typically you measure the concurrency of services and how closely your application is running within Service Quotas.
For monitoring and observing Lambda functions, the most important broad metrics are:
- Errors: whether errors are caused by logic or runtime errors in the code, or caused by interactions with the Lambda service or other services. These may also be caused by other factors such as lack of permissions or exceeding the assigned resources.
- Execution time: measuring average response times only provides a limited view of performance in distributed applications. It’s important to capture and monitor performance at percentile intervals (such as 95% and 99%) to measure the performance for the slowest 5% and 1% of requests.
- Throttling: serverless applications use scalable resources with Service Quotas to protect customers. Throttling may indicate that quotas are set incorrectly, there is an error in the application architecture, or traffic levels are beyond the expected limits.
Logging and metrics with Amazon CloudWatch
All Lambda functions are automatically integrated with CloudWatch. Lambda automatically records a variety of standard metrics that are always published to CloudWatch metrics. By default, all logging from Lambda function invocations is durably stored in a CloudWatch log stream. The Monitoring tab in the Lambda console provides a quick view into integrated CloudWatch metrics for a single function.
How CloudWatch structures logs
Lambda automatically streams details about each function invocation, along with logs and other output from your function’s code to CloudWatch Logs.
Log groups are a standard part of CloudWatch and used to organize all logging. Any log generated by a Lambda function uses the naming convention /aws/lambda/function-name. A log group is a logical collection of log streams, which can you explore in the CloudWatch console:
Each instance of a Lambda function has a dedicated log stream. If a function scales up, each concurrent instance has its own log stream. Each time an execution environment is reaped and a new environment is created in response to an invocation, this generates a new log stream. The naming convention for log streams is:
YYYY/MM//DD [Function version] [Execution environment GUID]
A single execution environment writes to the same log stream during its lifetime. The log stream contains messages from that execution environment and also any output from your Lambda function’s code. Every message is timestamped, including your custom logs, which means you do not need to output timestamps. Even if your function does not log any output from your code, there are three minimal log statements generated per invocation (START, END and REPORT):
These logs show:
- RequestId: this is a unique ID generated per request. If the Lambda function retries a request, this ID does not change and appears in the logs for each subsequent retry.
- Start/End: these values bookmark a single invocation, so every log line between these belongs to the same invocation.
- Duration: the total invocation time for the handler function, excluding “INIT” code.
- Billed Duration: applies rounding logic for billing purposes.
- Memory Size: the amount of memory allocated to the function.
- Max Memory Used: the actual memory used during the invocation.
- Init Duration: the time taken to run the “INIT” section of code, outside of the main handler.
Important metrics for CloudWatch
Lambda reports some metrics directly to the CloudWatch service and these do not appear in the logs. With CloudWatch, you can create alarms that monitor metrics and provide notifications if metrics exceed typical values. You can also create composite alarms that combine multiple alarms and provide more useful notifications. You can create alarms either manually in the console or in an AWS SAM template, so the alarm is defined together with the resources of your application.
There are eight important integrated Lambda metrics that you can monitor to understand the performance of your workload:
- Invocations: Monitor this value as a general barometer for the amount of traffic flowing through your serverless application. Also, monitor for functions with zero invocations over a given period of time, since this can indicate that there are upstream problems in the application. It can also indicate that a function is no longer being used.
- Duration: This is the amount of time taken for a Lambda invocation. Apart from the impact on cost, it’s also important to monitor any functions that are running close to their timeout value.
- Errors: This logs the number of errors thrown by a function. It can be used with the Invocations metric to calculate the total percentage of errors.
- Throttles: Set alarms on this metric for any non-zero value since this only occurs if the number of invocations exceeds concurrency in your account. You can set Reserved Concurrency on critical functions and also request Service Quota increases, if needed.
- DeadLetterErrors: An error is triggered if Lambda cannot write to the designated dead-letter queue, so you should alarm on any non-zero values for this metric.
- IteratorAge: For Lambda functions that poll streaming sources, such as Kinesis or DynamoDB streams, this value indicates when events are being produced faster than they are being consumed by Lambda. IteratorAge is the difference between the current time and when the last record of the GetRecords call was written to the stream.
- ConcurrentExecutions: monitor this value to ensure that your functions are not running close to the total concurrency limit for your AWS account. You can request a Service Quota increase, if needed.
- UnreservedConcurrentExecutions: similar to the previous metric but excludes functions using reserved capacity.
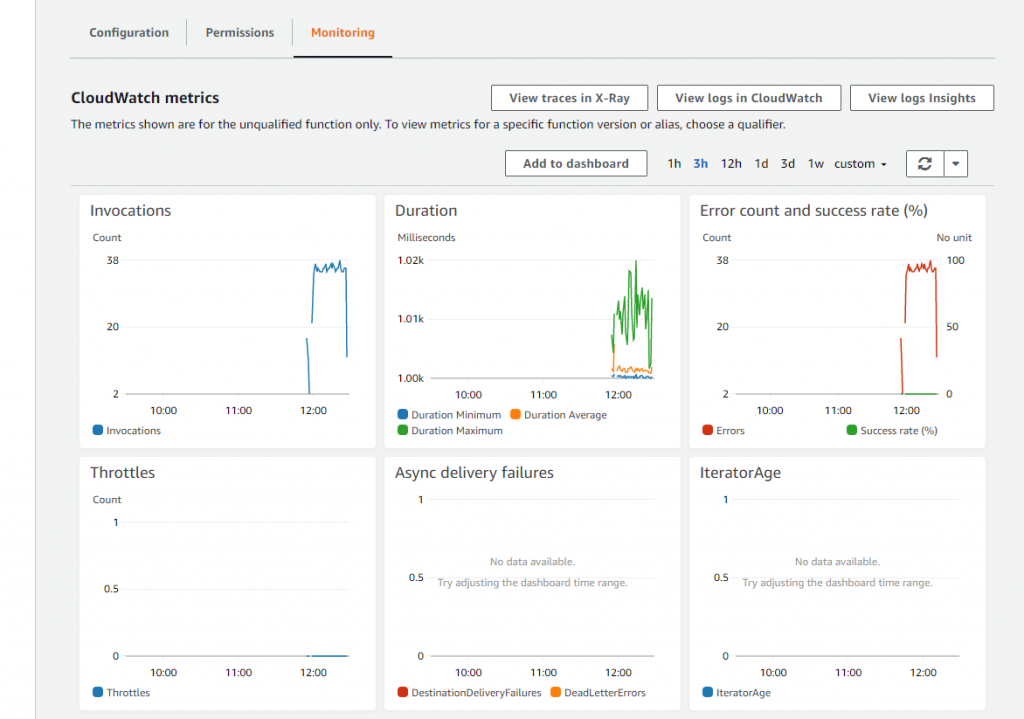
Common Lambda errors often have distinct patterns in standard Lambda metrics. For example, a function that is running normally but starts to experience timeouts may generate Duration and Error count metrics charts as shown below. The Duration value is tightly grouped around a second-level interval (1.00–1.02 seconds) and the error count matches the Invocations count, indicating that every invocation is failing.
Custom metrics
CloudWatch can also track custom metrics that are application-specific. By default, metrics from AWS services are stored with “standard resolution”, which provides a one-minute granularity. You can define custom metrics as either standard or high resolution, which provides a one-second granularity. High-resolution metrics provide more immediate insight into subminute activity, and can be used to generate alarms more quickly, based upon 10-second or 30-second activity. You can develop graphs, dashboards, and statistical analysis on custom metrics in the same way as you can for AWS-generated metrics.
Custom metrics can be used for tracking statistics in the application domain, instead of measuring performance related to the Lambda function (for example, duration). A single statistic may have multiple dimensions to use for later analysis. Each custom metric must be published to a namespace, which isolates groups of custom metrics, so often a namespace equates to an application or workload domain.
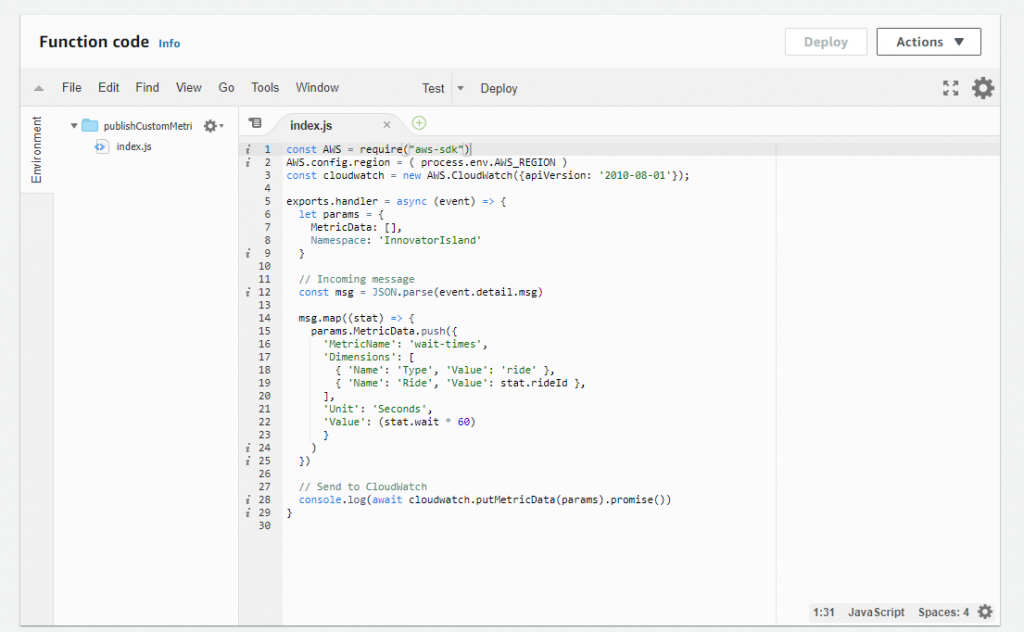
You can use the Embedded Metrics format to embed custom metrics alongside detailed log event data. CloudWatch automatically extracts the custom metrics so you can visualize and alarm on them, for real-time incident detection. For example, the Innovator Island workshop uses custom metrics to publish wait times for theme park rides, as follows:
Conclusion
Many existing monitoring and observability concepts also apply to Lambda-based applications. This post introduces key terms, application performance monitoring, with broad metrics can be useful for monitoring workloads.
This post explores using CloudWatch for logging and metrics and how logs are structured. I highlight some of the important metrics in CloudWatch relating to Lambda-based applications, and show how you can create custom metrics.
Part 3 will walk through troubleshooting application issues in an example walkthrough.
For more serverless learning resources, visit Serverless Land.


